. 2023 Mar 31;13(1):5268.
doi: 10.1038/s41598-023-29742-2.

Gene loss during a transition to multicellularity

Affiliations

Gene loss during a transition to multicellularity

Berenice Jiménez-Marín et al. Sci Rep. .

Abstract

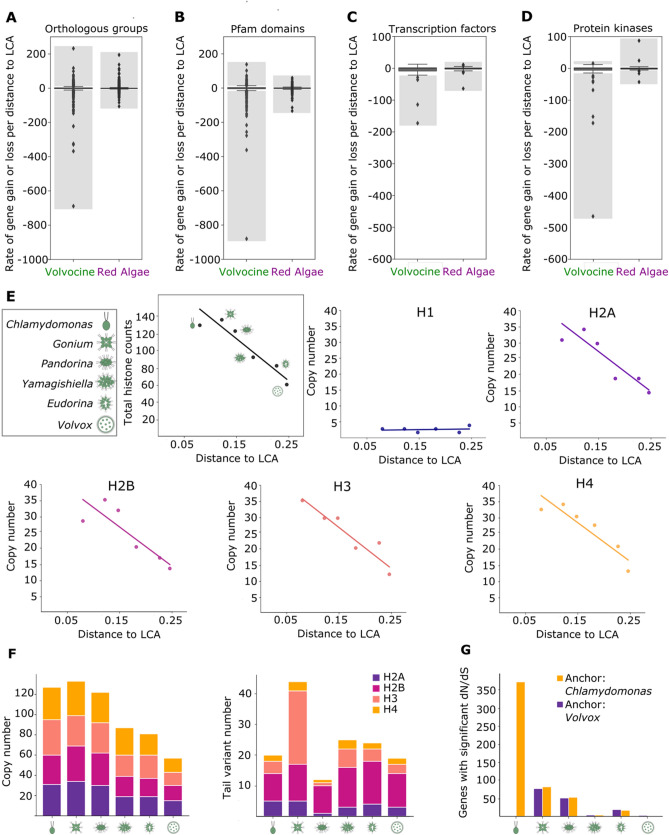
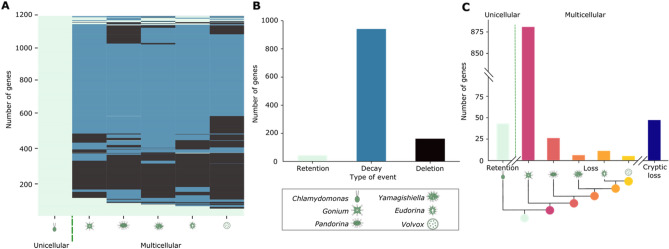
Multicellular evolution is a major transition associated with momentous diversification of multiple lineages and increased developmental complexity. The volvocine algae comprise a valuable system for the study of this transition, as they span from unicellular to undifferentiated and differentiated multicellular morphologies despite their genomes being similar, suggesting multicellular evolution requires few genetic changes to undergo dramatic shifts in developmental complexity. Here, the evolutionary dynamics of six volvocine genomes were examined, where a gradual loss of genes was observed in parallel to the co-option of a few key genes. Protein complexes in the six species exhibited novel interactions, suggesting that gene loss could play a role in evolutionary novelty. This finding was supported by gene network modeling, where gene loss outpaces gene gain in generating novel stable network states. These results suggest gene loss, in addition to gene gain and co-option, may be important for the evolution developmental complexity.


Conflict of interest statement

The authors declare no competing interests.

Figures

Figure 1
Figure 1
Volvocine algal genomes are similar. (A) Genome-wide phylogeny of the volvocine algae (green) compared to other chlorophyte outgroups (blue) inferred by PosiGene. Branch values indicate distance from the nearest node. Note Chlamydomonas is unicellular and closely related to colonial volvocines. (B) Orthologous groups shared between the six volvocine species (Supplementary File 1). (C), Pfam domains shared between six volvocine species.
Figure 2
Figure 2
Gene loss outpaces gain in volvocine algae genomes. Distribution of the gene loss and gain rates per distance to LCA in the volvocine genomes compared to Rhodophyceae (red algae) of (A) orthologous groups, (B) Pfam domains, (C) transcription factors, and (D) protein kinases. Outlier groups, which represent significant loss (negative values) or gain (positive values) rates, are within the shaded grey area. (E) Histone copy number relative to distance to LCA shows a decreasing trend except for H1 in the volvocine genomes. Top left panel describes total histone counts per species. (F) Histone copy numbers (left) are reduced with minimal loss of tail variants (right). (G) Quantification of positively selected genes per species using Chlamydomonas (yellow) and Volvox (purple) as reference genomes.
Figure 3
Figure 3
Gene loss in the volvocine algae occurs primarily by gradual decay. (A) Retention (light green), decay (blue), and deletion (black) of 1184 loci belonging to orthologous groups undergoing contraction in volvocine species. (B) Cross species quantification of retention (light green), decay (blue), and deletion (black) of loci in contracting orthologous groups. (C) Quantification of events of retention and loss by decay relative to evolutionary relationships between volvocine species. Losses that do not follow phylogenetic distributions are considered cryptic (dark blue).
Figure 4
Figure 4
Protein–protein interactions differ among volvocine species. Blue Native (BN) PAGE followed by SDS-PAGE of lysates from Chlamydomonas (pseudocolored cyan), Gonium (pseudocolored magenta), and Eudorina (pseudocolored yellow) were performed. (A) Overlay of silver stains. RuBisCO signal is circled in red. (B) Overlay of western blot signals for α-tubulin. Tubulin signals for species-specific complexes are indicated by color coded arrows. (C) Overlay of western blot signals for β-actin. Actin signals from unique complexes are indicated by color coded arrows.
Figure 5
Figure 5
Gene loss in a fully connected network (c = 1) of genes (N = 10) yields a higher proportion of novel stable network states than gene gain. Wagner model simulates loss (red) and duplication (blue) of k genes. Grey shading represents variance.

References

    1. Grosberg RK, Strathmann RR. The evolution of multicellularity: A minor major transition? Annu. Rev. Ecol. Evol. Syst. 2007;38:621–654. doi: 10.1146/annurev.ecolsys.36.102403.114735. - DOI
    1. Knoll AH. The multiple origins of complex multicellularity. Annu. Rev. Earth Planet. Sci. 2011;39:217–239. doi: 10.1146/annurev.earth.031208.100209. - DOI
    1. Olson BJ, Nedelcu AM. Co-option during the evolution of multicellular and developmental complexity in the volvocine green algae. Curr. Opin. Genet. Dev. 2016;39:107–115. doi: 10.1016/j.gde.2016.06.003. - DOI - PubMed
    1. Herron MD, Hackett JD, Aylward FO, Michod RE. Triassic origin and early radiation of multicellular volvocine algae. Proc. Natl. Acad. Sci. U. S. A. 2009;106:3254–3258. doi: 10.1073/pnas.0811205106. - DOI - PMC - PubMed
    1. Hanschen ER, Herron MD, Wiens JJ, Nozaki H, Michod RE. Multicellularity drives the evolution of sexual traits. Am. Nat. 2018;192:E93–E105. doi: 10.1086/698301. - DOI - PMC - PubMed

Publication types