. 2023 Mar 31;13(1):5280.
doi: 10.1038/s41598-023-32433-7.

Alpha-linolenic acid modulates systemic and adipose tissue-specific insulin sensitivity, inflammation, and the endocannabinoid system in dairy cows

Affiliations

Alpha-linolenic acid modulates systemic and adipose tissue-specific insulin sensitivity, inflammation, and the endocannabinoid system in dairy cows

Gitit Kra et al. Sci Rep. .

Abstract

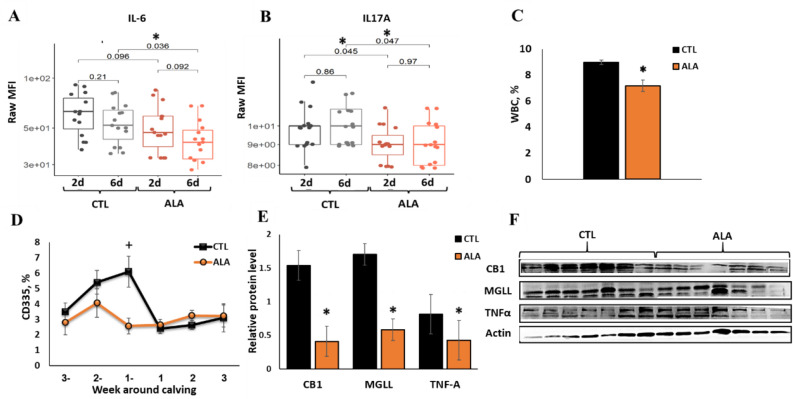
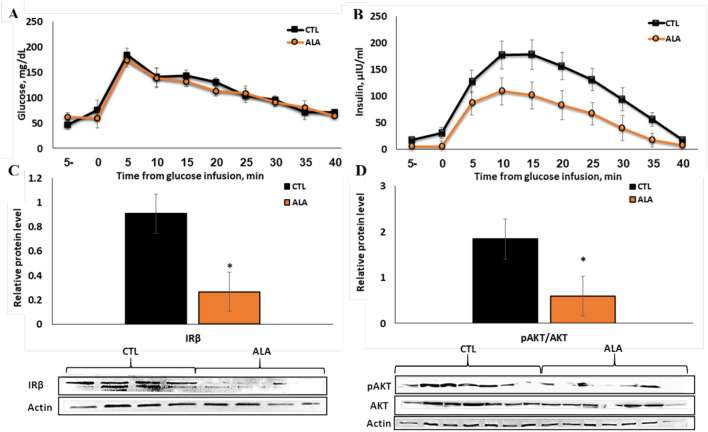
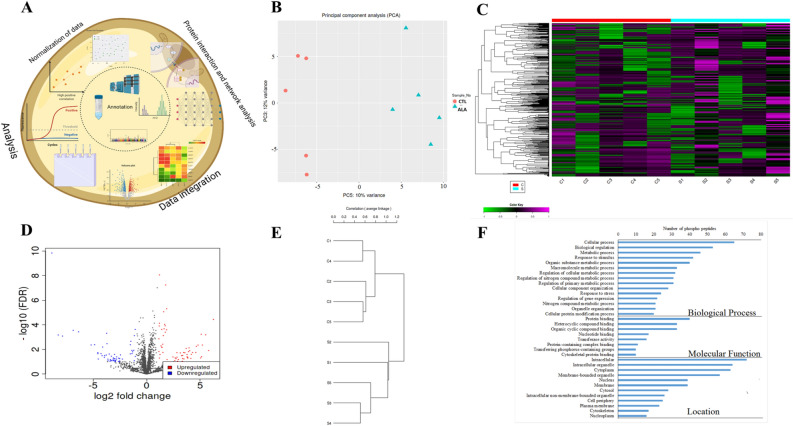
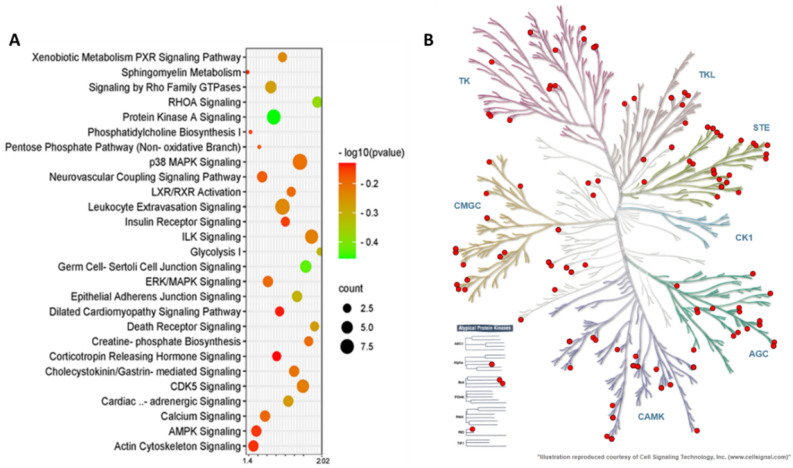
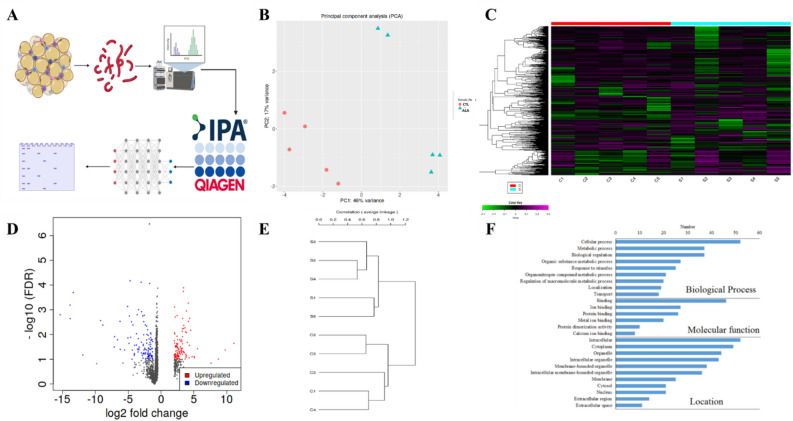
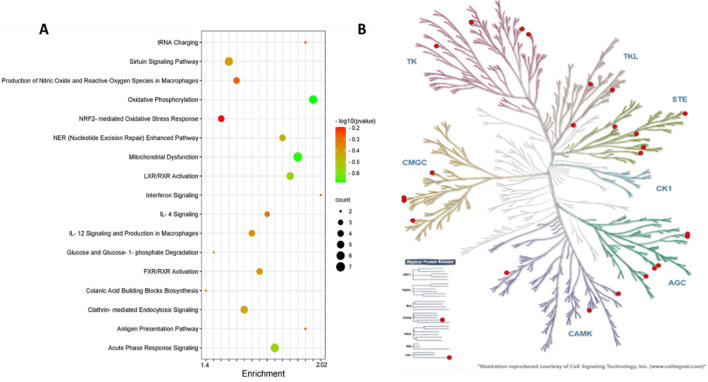
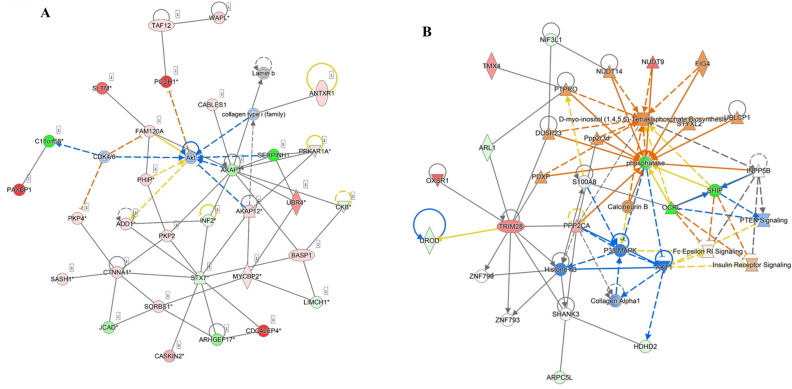
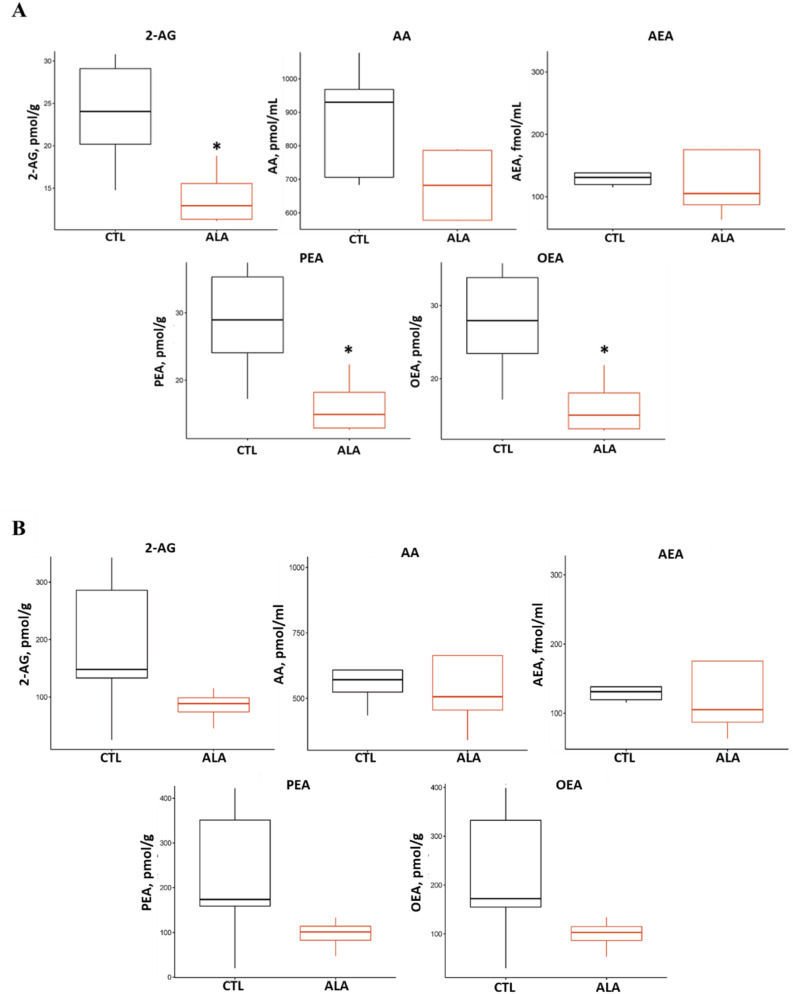
Metabolic disorders are often linked to alterations in insulin signaling. Omega-3 (n-3) fatty acids modulate immunometabolic responses; thus, we examined the effects of peripartum n-3 on systemic and adipose tissue (AT)-specific insulin sensitivity, immune function, and the endocannabinoid system (ECS) in dairy cows. Cows were supplemented peripartum with saturated fat (CTL) or flaxseed supplement rich in alpha-linolenic acid (ALA). Blood immunometabolic biomarkers were examined, and at 5-8 d postpartum (PP), an intravenous glucose-tolerance-test (GTT) and AT biopsies were performed. Insulin sensitivity in AT was assessed by phosphoproteomics and proteomics. Peripartum n-3 reduced the plasma concentrations of Interleukin-6 (IL-6) and IL-17α, lowered the percentage of white blood cells PP, and reduced inflammatory proteins in AT. Systemic insulin sensitivity was higher in ALA than in CTL. In AT, the top canonical pathways, according to the differential phosphoproteome in ALA, were protein-kinase-A signaling and insulin-receptor signaling; network analysis and immunoblots validated the lower phosphorylation of protein kinase B (Akt), and lower abundance of insulin receptor, together suggesting reduced insulin sensitivity in ALA AT. The n-3 reduced the plasma concentrations of ECS-associated ligands, and lowered the abundances of cannabinoid-1-receptor and monoglycerol-lipase in peripheral blood mononuclear cells PP. Peripartum ALA supplementation in dairy cows improved systemic insulin sensitivity and immune function, reduced ECS components, and had tissue-specific effects on insulin-sensitivity in AT, possibly counter-balancing the systemic responses.


Conflict of interest statement

The authors declare no competing interests.

Figures

Figure 1
Figure 1
Immune factors in plasma, white blood cells (WBC), and the peripheral blood mononuclear cells (PBMCs) of postpartum dairy cows supplemented with ALA during the peripartum period. Dairy cows at 257 days of pregnancy were divided into two nutritional groups supplemented with (i) CTL (n = 16)—encapsulated saturated fat, (ii) ALA (n = 12)—flaxseed supplement providing α-linolenic acid (ALA). (A) interleukin–6 (IL6) at days 2 and 6 postpartum (PP); (B) Plasma concentrations of Interleukin-17A (IL17A) at days 2 and 6 PP; (C) WBC percentage in blood according to CBC; (D) Flow cytometry analysis of WBC subpopulation CD335 (Natural killer cells) in blood; (E,F) the relative protein abundance in PBMCs (at 10 d PP, n = 7); CB1 Cannabinoid-1 receptor, MGLL monoglycerol lipase, TNF-A tumor necrotic factor α; β-Actin was used as a reference protein. Data are presented as the mean ± SEM.
Figure 2
Figure 2
Response to the glucose tolerance test (GTT) in postpartum (PP) dairy cows (5–8 days PP) supplemented with n-3 during the peripartum period. Dairy cows at 257 days of pregnancy were divided into two nutritional groups supplemented with (i) CTL—encapsulated saturated fat, (ii) ALA—flaxseed supplement providing α-linolenic acid (ALA). n = 7. Time 0—Glucose infusion. (A) Plasma glucose concentrations during GTT; (B) plasma insulin concentrations during GTT; (C) protein abundance of insulin receptor beta (IRβ; n = 4) in insulin-stimulated AT; (D) phosphorylation of protein kinase B (pAkt; n = 7) in insulin-stimulated AT; two ALA samples were excluded from the analysis, one due to low protein levels and one due to ketosis diagnosed at 10 d PP. Data are presented as the mean ± SEM.
Figure 3
Figure 3
Phospho-proteomic analysis of insulin-stimulated adipose tissue from postpartum (PP) of dairy cows supplemented peripartum with ALA. Dairy cows were divided into two groups from 21 to 60 days PP; (i) CTL—encapsulated saturated fat, (ii) ALA—flaxseed supplement providing α-linolenic acid (ALA). n = 5 per treatment. (A) Work flow diagram of phospho-proteome analysis. (B) Principal component analysis (PCA) of AT phospho-proteome; CTL samples are denoted as red circles, whereas ALA samples are denoted as blue triangles. (C) Heat map analysis of AT phospho-proteome, low phosphopeptide intensity is denoted in green, whereas high intensity is denoted in purple. Each cow in the study is numbered and represented in columns. (D) Volcano plot analysis of AT phospho-proteome; the P value (≤ 0.05) is represented on the Y-axis and FDR (± 1.5) is represented on the X-axis. Each dot represents one protein; red indicates more, whereas blue indicates fewer phosphoproteins in AT. (E) Correlation of CTL vs ALA adipose generated by the IDEP9.5 server where c1, c2, c3, c4, and c5 represent CTL; s1, s2, s3, s4, and s5 represent ALA-supplemented cows. (F) GO analysis of AT phosphoproteome supplemented with ALA including the biological process category, the molecular function category, and the cell component category. Image was generated using www.Biorender.com.
Figure 4
Figure 4
Top canonical pathway analysis and the kinome tree analysis of the adipose tissue phospho-proteome of postpartum (PP) dairy cows supplemented with ALA 20 min after glucose infusion. Dairy cows were divided into two groups from 21 to 60 days PP; (i) CTL—encapsulated saturated fat, (ii) ALA—flaxseed supplement providing α-linolenic acid (ALA). n = 5 per treatment. (A) Top canonical pathways associated with ALA supplementation of dairy cows on the Y-axis and—log (P-value) on the X-axis. The size and color of each bubble represent the number of peptides in each pathway and the P value, respectively. (B) The predicted kinases of phospho-proteome in ALA-supplemented AT as represented in the kinome tree using the kinmap server. The identified kinases of the Phosphoproteome of dairy cows are represented as follows: AGC PKA/PKG/PKC-family kinases, CAMK calcium/calmodulin-dependent kinases, CK1 casein kinases, CMGC CDK/MAPK/GSK3/CLK-family kinases, STE sterile homologue kinases, TK tyrosine kinases, TKL tyrosine kinase-like kinases. The kinases are separated and denoted as red circles on the branches of the tree based on their category.
Figure 5
Figure 5
Proteomic analysis of insulin-stimulated adipose tissue from postpartum (PP) dairy cows supplemented with ALA. Dairy cows were divided into two nutritional regiment groups from 21 to 60 days PP; (i) CTL—encapsulated saturated fat, (ii) ALA—flaxseed supplement providing α-linolenic acid (ALA). n = 5 per treatment. (A) Work flow for the proteomic analysis; proteins extracted from adipose were digested and peptides were identified for their differential expression. Bioinformatic analysis and network analysis were performed to identify the enriched pathways. Western blot analysis was used for validation. (B) Principal component analysis (PCA) of the AT proteome; CTL samples are denoted in red circles, whereas ALA samples are denoted in blue triangles. (C) Heat map analysis of AT proteome: low peptide intensity is denoted in green, whereas high intensity is denoted in purple. Each cow in the study is numbered and represented in columns. (D) Volcano plot analysis of the AT proteome; the P value (< 0.05) is represented on the Y-axis and FDR (± 1.5) is represented on the X-axis. Each dot represents one protein: red denotes more, whereas blue denotes fewer proteins in AT. (E) Correlation of CTL vs ALA cows generated by the IDEP9.5 server where c1, c2, c3, c4, and c5 represent CTL; s1, s2, s3, s4, and s5 represent ALA-supplemented cows. (F) GO analysis of AT proteome supplemented with ALA including the biological process category, the molecular function category, and the cell component category. Image was generated using www.Biorender.com.
Figure 6
Figure 6
Top canonical pathway analysis and the kinome tree analysis of insulin-stimulated adipose tissue proteome from postpartum (PP) dairy cows supplemented with ALA. Dairy cows were fed; (i) CTL—encapsulated saturated fat, (ii) ALA—flaxseed supplement providing α-linolenic acid (ALA). n = 5 per treatment. (A) Top canonical pathways according to differential proteins in ALA vs. CTL (Y-axis), and—log (P-value) on the X-axis. The size and color of each bubble represent the number of proteins enriched in each pathway and the P value, respectively. (B) The predicted kinases of proteome in ALA-supplemented AT represented in the kinome tree using the kinmap server. The identified kinases in the proteome of AT are represented as follows: AGC PKA/PKG/PKC-family kinases, CAMK calcium/calmodulin-dependent kinases, CK1 casein kinases, CMGC CDK/MAPK/GSK3/CLK-family kinases, STE sterile homologue kinases, TK tyrosine kinases, TKL tyrosine kinase-like kinases. The kinases are separated and denoted as red circles on the branches of the tree, based on their category.
Figure 7
Figure 7
Network analysis of phosphoproteomics (A) and proteomics (B) of insulin-stimulated adipose tissue reveals the main role of Akt signaling following peripartum dietary ALA supplementation in postpartum dairy cows. Dairy cows were fed; (i) CTL—encapsulated saturated fat, (ii) ALA—flaxseed supplement providing α-linolenic acid (ALA). n = 5 per treatment. The upregulated phosphopeptides or proteins are represented in red, whereas green indicates downregulation. Full lines represent direct interaction, whereas dotted lines represent indirect interaction.
Figure 8
Figure 8
Endocannabinoid concentrations in plasma (A) and adipose tissue (B) at 20 min after glucose infusion from postpartum (PP) dairy cows supplemented with ALA. *P ≤ 0.05. Dairy cows were divided into two nutritional groups from 21 to 60 days PP; (i) CTL—encapsulated saturated fat, (ii) ALA—flaxseed supplement providing α-linolenic acid (ALA). n = 5 per treatment. 2-AG 2-arachidonoylglycerol, AA arachidonic acid, AEA anandamide, PEA N-palmitoylethanolamide, OEA N-oleoylethanolamide.

References

    1. Zachut M, Contreras GA. Symposium review: Mechanistic insights into adipose tissue inflammation and oxidative stress in periparturient dairy cows. J. Dairy Sci. 2022;105:3670–3686. doi: 10.3168/jds.2021-21225. - DOI - PubMed
    1. Delarue J, LeFoll C, Corporeau C, Lucas D. N-3 long chain polyunsaturated fatty acids: A nutritional tool to prevent insulin resistance associated to type 2 diabetes and obesity? Reprod. Nutr. Dev. 2004;44:289–299. doi: 10.1051/rnd:2004033. - DOI - PubMed
    1. Kalupahana NS, et al. Eicosapentaenoic acid prevents and reverses insulin resistance in high-fat diet-induced obese mice via modulation of adipose tissue inflammation. J. Nutr. 2010;140:1915–1922. doi: 10.3945/jn.110.125732. - DOI - PubMed
    1. Cartiff SE, Fellner V, Eisemann JH. Eicosapentaenoic and docosahexaenoic acids increase insulin sensitivity in growing steers. J. Anim. Sci. 2013;91:2332–2342. doi: 10.2527/jas.2012-5694. - DOI - PubMed
    1. Moradi M, et al. Moderate over-feeding of different sources of metabolizable energy and protein improved gestational insulin resistance markers and maternal metabolic status of sheep around lambing. Theriogenology. 2021;161:332–342. doi: 10.1016/j.theriogenology.2020.12.016. - DOI - PubMed

Publication types