. 2023 Mar 31;13(1):5292.
doi: 10.1038/s41598-023-31479-x.

Carbonate system in the Cabo Frio upwelling

Affiliations

Carbonate system in the Cabo Frio upwelling

Carlos Augusto Ramos E Silva et al. Sci Rep. .

Abstract

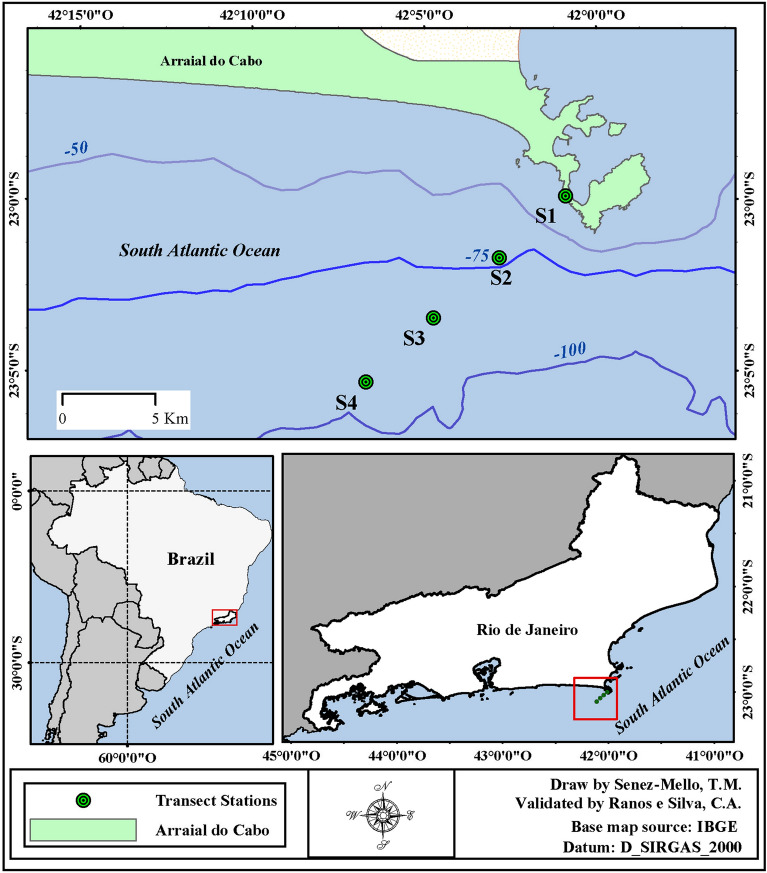
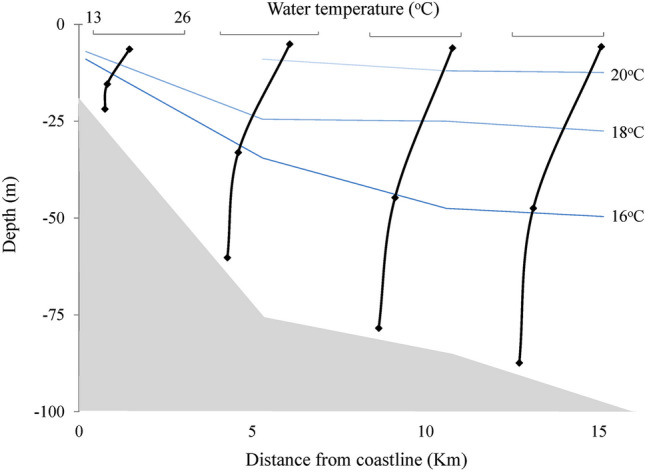
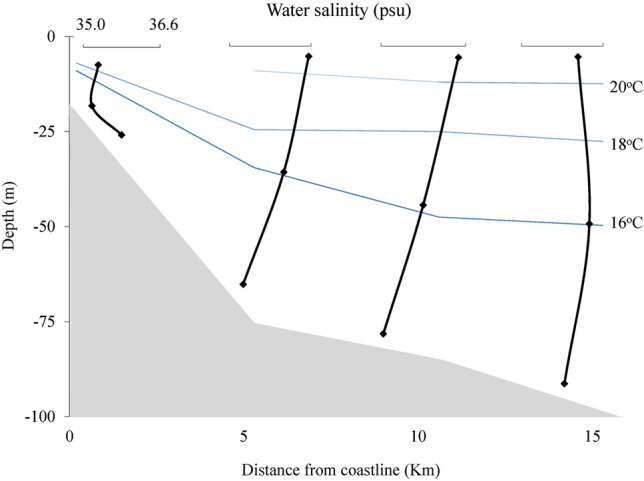
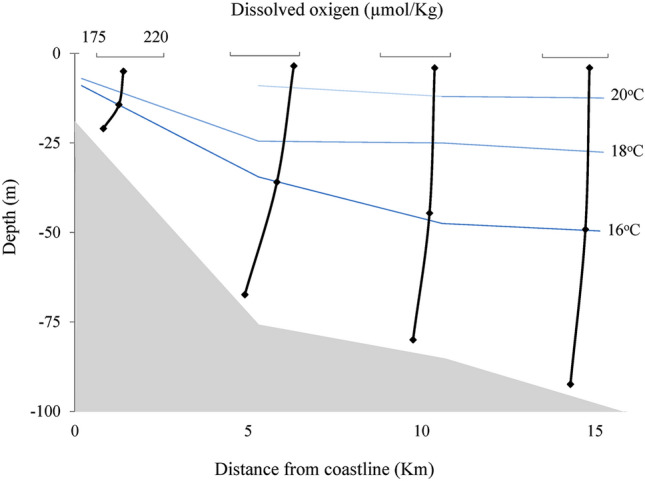
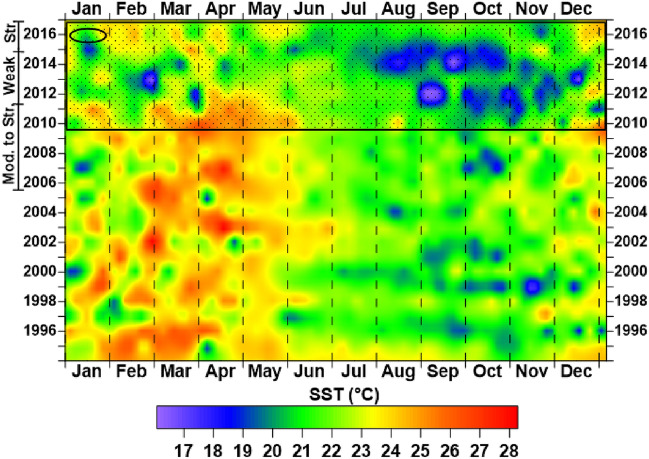
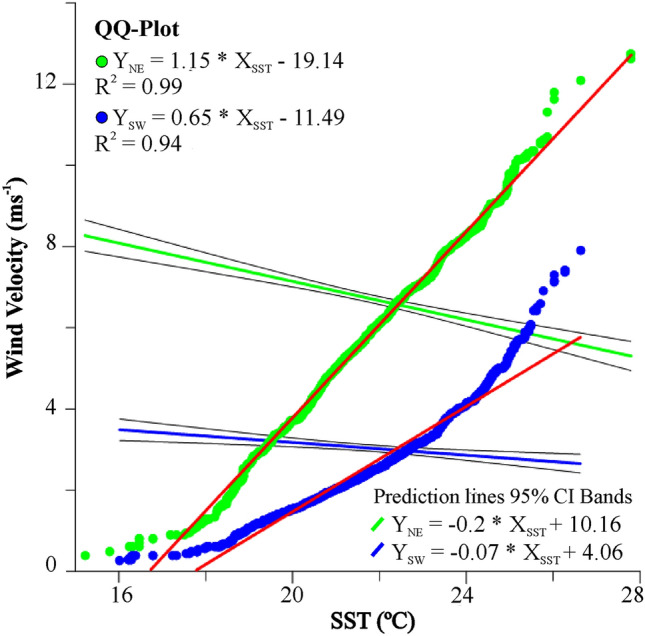
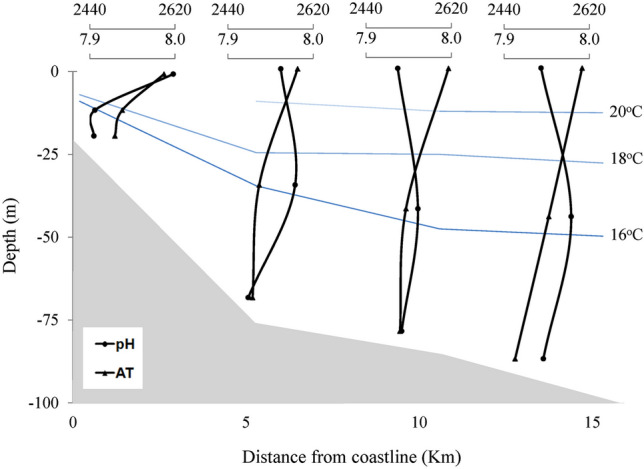
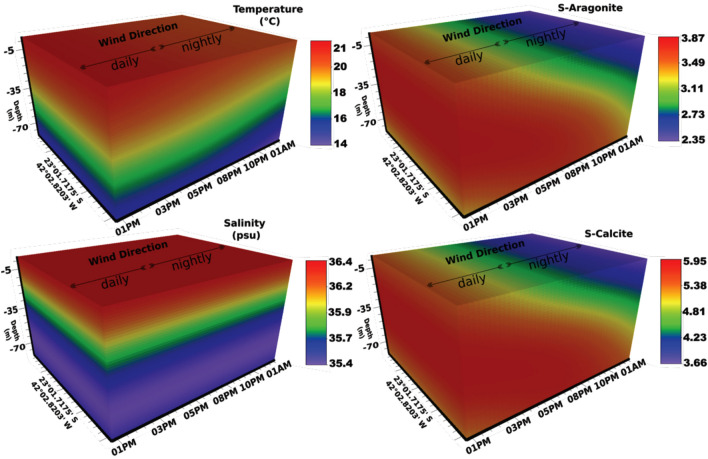
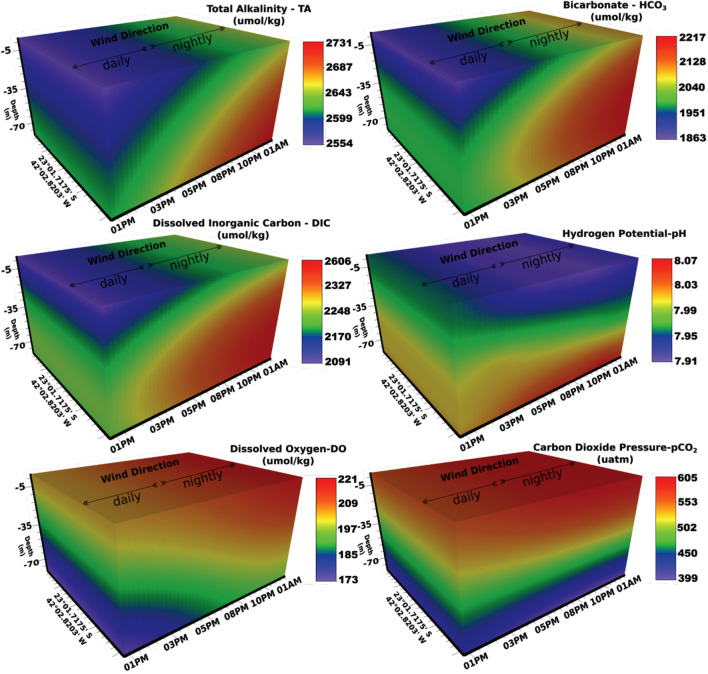
The quantitative assessment of the carbonate system represents one of the biggest challenges toward the "Sustainable Development Goals" defined by the United Nations in 2015. In this sense, the present study investigated the Spatio-temporal dynamics of the carbonate system and the effects of the El Niño and La Niña phenomena over the Cabo Frio upwelling area. The physical characterization of the site was carried out through data on wind speed and sea surface temperature. Water samples were also collected during the oceanographic cruise onboard the Diadorim R/V (Research Vessel). From these samples, the parameters of absolute and practical salinity, density, pH, total alkalinity, carbonate, calcite, aragonite, bicarbonate dissolved inorganic carbon, carbon dioxide, partial pressure of carbon, calcium, and total boron were obtained. The highest average concentration of bicarbonate in S1 (2018 µmol/kg) seems to contribute to the dissolved inorganic carbon values (2203 µmol/kg). The values of calcite saturation state, aragonite saturation state, and carbonate were higher on the surface of each station (calcite saturation state = 4.80-5.48; aragonite saturation state = 3.10-3.63, and carbonate = 189-216 µmol/kg). The mean values of pH were similar in the day/night samples (7.96/7.97). The whole carbonate system was calculated through thermodynamic modeling with the Marine Chemical Analysis (AQM) program loaded with the results of the following parameters: temperature, salinity, total alkalinity, and pH parameters. This manuscript presents original data on the carbonate system and the "acidification" process influenced by the Cabo Frio upwelling, which directly depends on the El Niño and La Niña phenomena oscillations in the sea surface temperature.


Conflict of interest statement

The authors declare no competing interests.

Figures

Figure 1
Figure 1
Study area. Sampling stations are represented by dots and respective numbers (S1, S2, S3, and S4). This map was generated with the ArcMap software v. 10.8.2 (https://www.esri.com/en-us/arcgis/about-arcgis/overview), by Senez-Mello, TM.
Figure 2
Figure 2
Temperature of the longitudinal samples from the surface, middle, and bottom of the water column.
Figure 3
Figure 3
Salinity of the longitudinal samples from the surface, middle, and bottom of the water column.
Figure 4
Figure 4
Dissolved oxygen in the longitudinal samples from the surface, middle, and bottom of the water column.
Figure 5
Figure 5
Wind velocity at quadrants SW and NE (blue line) with the respective variation of sea surface temperature (SST) at the Cabo Frio/RJ upwelling area (circle with a vertical bar in red), showing the average temperature and the standard deviation between 09/2006 and 12/2016, according to mild (Weak), and moderate to strong (Mod. to Str.) El Niño and La Niña events.
Figure 6
Figure 6
Temperature Grid of the Sea Surface Temperature (SST) at the Cabo Frio upwelling obtained by Kriging the SST data (1995–2016). Blue spots (cold): longer-term and intensity of the upwelling phenomenon. Red blots (hot): longer-term and intensity of temperature anomalies. Ellipse: SST in the period correspondent to the sampling campaign. Hachured rectangle: Str—increased wind magnitude period (from 2010 to 2016); Weak—absence of the events of a mild El Niño (from 2012 to 2013); and Mod. To Str—moderate to strong winds (from 2006 to 2010).
Figure 7
Figure 7
Quantile–Quantile plot (QQ-plot) displaying the SST and Wind Velocity data distribution from 2006 to 2016 in the Cabo Frio upwelling area. Blue dots: SW wind. Green dots: NE wind. Red lines: best-fit linear equation. Greenline: NE wind intensity trend curve; blue line: SW wind intensity trend curve, both fitted to 95% prediction bands.
Figure 8
Figure 8
pH and Alkalinity of the longitudinal samples from the surface, middle, and bottom water column.
Figure 9
Figure 9
Calcite saturation state (ΩCalcite) and carbonate concentration (µmol/kg) of the longitudinal samples from the water column's surface, middle, and bottom.
Figure 10
Figure 10
Temporal sampling. Temperature (°C), salinity (psu), aragonite, and calcite saturation state. X-axis: hour–day. Y-axis: coordinates of stations. Z-axis: Depth-m. Data sampled from 1:00 p.m. to 1:00 a.m. on the 20th and 21st of January 2016.
Figure 11
Figure 11
Temporal sampling. Total Alkalinity (µmol/kg), bicarbonate (µmol/kg), Dissolved Inorganic Carbon (µmol/kg), Potential Hydrogenionic (pH). Dissolved Oxygen (µmol/kg) and Carbon Dioxide Partial Pressure (atm). X-axis: hour–day. Y-axis: coordinates of stations. Z-axis: Depth-m. Data sampled from 1:00 p.m. to 1:00 a.m. on the 20th and 21st of January 2016.

References

    1. Ramos e Silva CA, et al. Inventory of water masses and carbonate system from Brazilian’s northeast coast: Monitoring ocean acidification. PLoS ONE. 2022;17:e0271875. doi: 10.1371/journal.pone.0271875. - DOI - PMC - PubMed
    1. Ramos e Silva CA, Dávalos PB, Da Silva MP, de Miranda LB. Variability and transport of inorganic carbon dioxide in a tropical estuary. J. Oceanogr. Mar. Res. 2017;05:155.
    1. Chester R. Marine Geochemistry. Academic Division of Unwin Hyman Ltd; 1990.
    1. Cai WJ, et al. Acidification of subsurface coastal waters enhanced by eutrophication. Nat. Geosci. 2011;4:766–770. doi: 10.1038/ngeo1297. - DOI
    1. Feely RA, Sabine CL, Hernandez-Ayon JM, Ianson D, Hales B. Evidence for upwelling of corrosive ‘acidified’ water onto the continental shelf. Science (80-). 2008;320:1490–1492. doi: 10.1126/science.1155676. - DOI - PubMed

LinkOut - more resources