Review
. 2023 Aug;24(8):550-572.
doi: 10.1038/s41576-023-00586-w. Epub 2023 Mar 31.

Best practices for single-cell analysis across modalities

Collaborators, Affiliations
Review

Best practices for single-cell analysis across modalities

Lukas Heumos et al. Nat Rev Genet. 2023 Aug.

Abstract

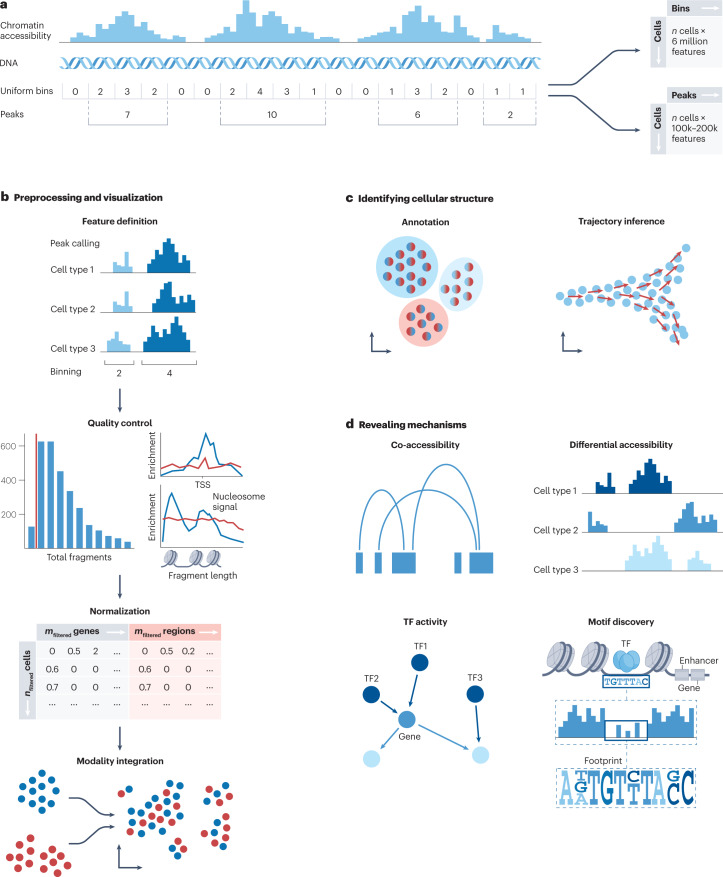
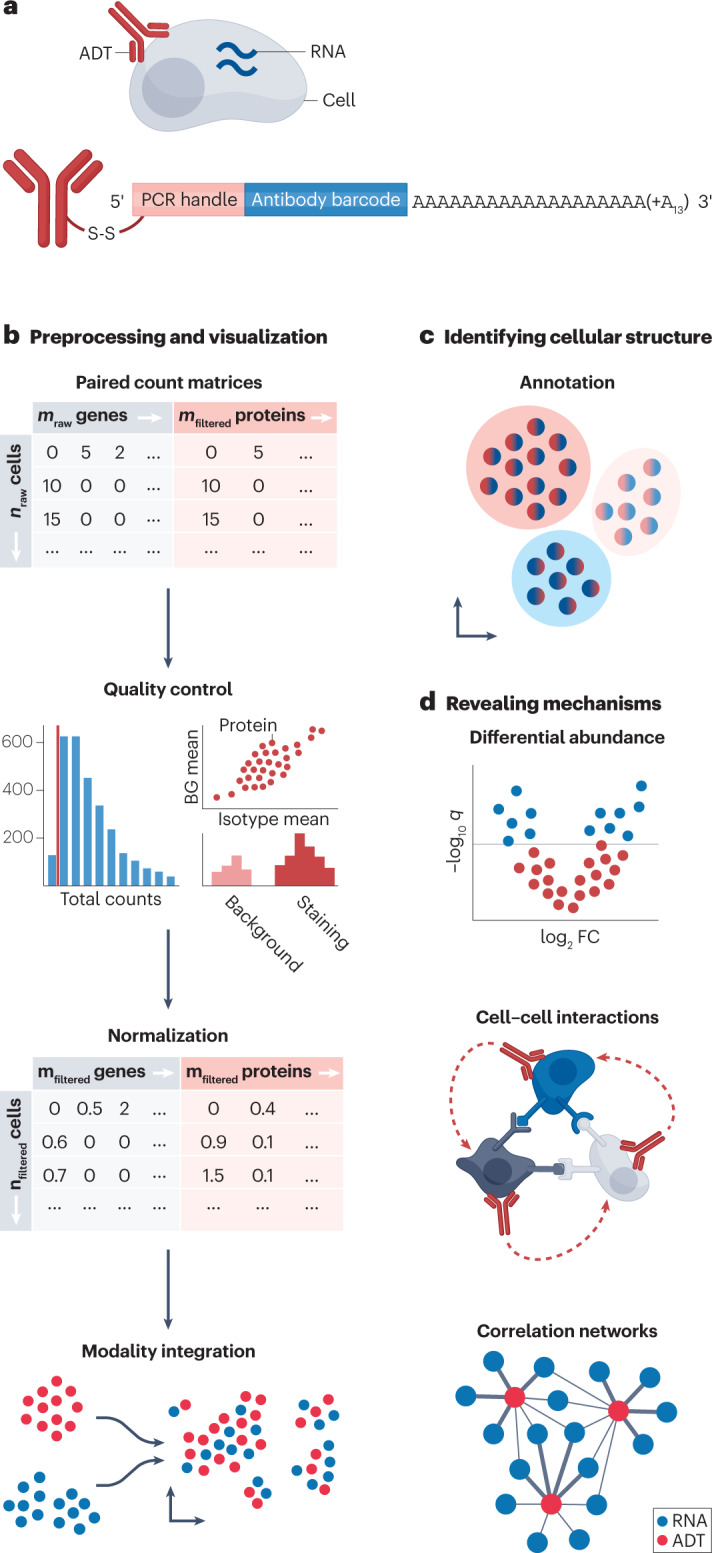
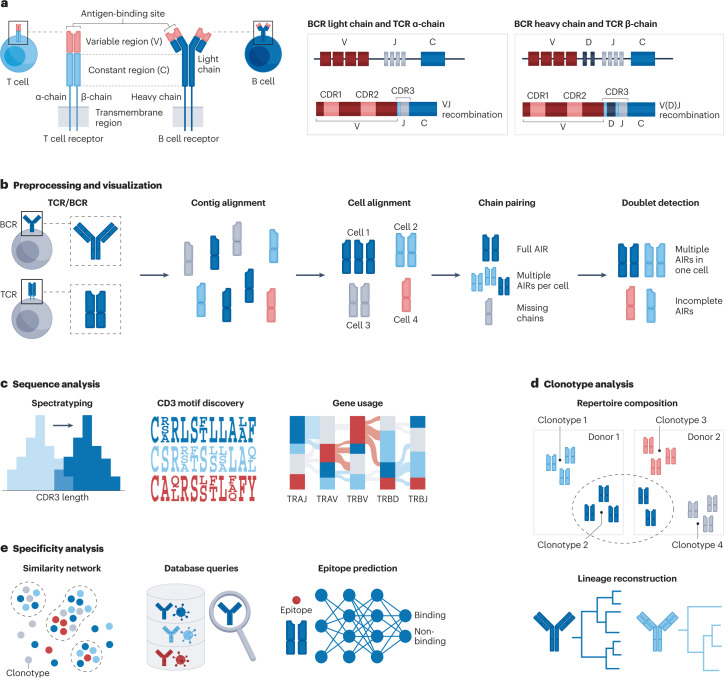
Recent advances in single-cell technologies have enabled high-throughput molecular profiling of cells across modalities and locations. Single-cell transcriptomics data can now be complemented by chromatin accessibility, surface protein expression, adaptive immune receptor repertoire profiling and spatial information. The increasing availability of single-cell data across modalities has motivated the development of novel computational methods to help analysts derive biological insights. As the field grows, it becomes increasingly difficult to navigate the vast landscape of tools and analysis steps. Here, we summarize independent benchmarking studies of unimodal and multimodal single-cell analysis across modalities to suggest comprehensive best-practice workflows for the most common analysis steps. Where independent benchmarks are not available, we review and contrast popular methods. Our article serves as an entry point for novices in the field of single-cell (multi-)omic analysis and guides advanced users to the most recent best practices.


Conflict of interest statement

Main author list: M.D.L. has received speaker’s honoraria from Pfizer and Janssen, and received consulting fees from Chan-Zuckerberg Initiative. F.J.T. consults for Immunai Inc., Singularity Bio B.V., CytoReason Ltd and Omniscope Ltd, and has ownership interest in Dermagnostix GmbH and Cellarity. M.G.J. consults for and has ownership interests in Vevo Therapeutics. L. Heumos has received speaker’s honorarium from Vesalius Therapeutics. Single-Cell Best Practices Consortium: M.G.J. consults for and has ownership interests in Vevo Therapeutics. R.P. is co-founder of Ocean Genomics, Inc. The other authors declare no competing interests.

Figures

Fig. 1
Fig. 1. Single-cell analysis across modalities.
Cellular state is characterized by various modalities, including, but not limited to, RNA transcription, chromatin accessibility, surface proteins including T cell receptors (TCRs) and B cell receptors (BCRs), as well as spatial location. Various frameworks covering the most important analysis steps have been developed. Transcriptomics data can be analysed with Scanpy, Seurat and Bioconductor-based SingleCellExperiment; chromatin accessibility measurements with muon, ArchR, snapATAC and Signac; TCR and BCR repertoire analysis with Scirpy, Dandelion and scRepertoire; surface protein expression with muon, Seurat and CiteFuse; spatially resolved single-cell data sets with frameworks such as Squidpy, Seurat, Giotto and Bioconductor-based SpatialExperiment. These frameworks are complemented with a myriad of additional tools for specific subsequent analysis tasks.
Fig. 2
Fig. 2. Overview of unimodal analysis steps for scRNA-seq.
a, Count matrices of cells by genes are obtained from raw data processing pipelines. To ensure that only high-quality cells are captured, count matrices are corrected for cell-free ambient RNA and filtered for doublets and low-quality or dying cells. The latter is done by removing outliers with respect to quality control metrics (the number of counts per barcode, called count depth or library size, the number of genes per barcode and the fraction of counts from mitochondrial genes per barcode (percentage  mito.)). All counts represent successful capture, reverse transcription and sequencing of an mRNA molecule. These steps vary across cells, and therefore count depths for identical cells can differ. Hence, when comparing gene expression between cells, differences may originate solely from sampling effects. This is addressed by normalization to obtain correct relative gene abundances between cells. Single-cell RNA sequencing (scRNA-seq) data sets can contain counts for up to 30,000 genes for humans. However, most genes are not informative, with many genes having no observed expression. Therefore, the most variably expressed genes are selected. Different batches of data are integrated to obtain a corrected data matrix across samples. To ease computational burden and to reduce noise, dimensionality reduction techniques are commonly applied. This further allows for the low-dimensional embedding of the transcriptomics data for visualization purposes. b, The corrected space can then be organized into clusters, which represent groups of cells with similar gene expression profiles, annotated by labels of interest such as cell type. The annotation can be conducted manually using prior knowledge or with automatic annotation approaches. Continuous processes, such as transitions between cell identities during differentiation or reprogramming, can be inferred to describe cellular diversity that does not fit into discrete classes. c, Depending on the question of interest and experimental set-up, conditions in the data set can be tested for upregulated or downregulated genes (differential expression analysis), effects on pathways (gene set enrichment) and changes in cell-type composition. Perturbation modelling enables the assessment of the effect of induced perturbations and the prediction of unmeasured perturbations. Expression patterns of ligands and receptors can reveal altered cell–cell communication. Transcriptomics data further enable the recovery of gene regulatory networks. q, q value.
Fig. 3
Fig. 3. Overview of scATAC-seq analysis steps.
a, Single-cell assay for transposase-accessible chromatin sequencing (scATAC-seq) measures single-cell chromatin accessibility. The data can be represented in several distinct ways. The two most common options are cell-by-peak and cell-by-bin matrices. Peak-calling algorithms find regions of high accessibility compared with background noise, whereas binning algorithms capture Tn5 transposition events in equally sized bins. b, To ensure that subsequent analyses focus on biologically meaningful features and not noise, the feature matrix is subject to quality control. The data need to be controlled for the total number of fragments per cell (representing cellular sequencing depth) and several other tests for relevant signal: the number of peaks with non-zero counts per cell, the transcription start site (TSS) enrichment score, the nucleosome signal reflecting the ratio of mononucleosome to nucleosome-free fragments and finally the ratio of reads in genomic regions that have been associated with artefactual signals. The sparsely distributed scATAC-seq features are then corrected through normalization. The subsequent preprocessing and visualization workflow closely follows the steps of a typical RNA analysis. c, scATAC-seq data can be annotated with cell types based on known differentially accessible regions, often by coupling to nearby or annotated coding DNA regions. The annotated cells can be leveraged to analyse continuous processes through trajectory inference. d, Depending on the question of interest, the data can now be investigated for co-accessibility to identify cis-regulatory interactions, differentially accessible regions to understand changes between conditions, transcription factor (TF) activity to identify key regulators and motif discovery to identify DNA sequence patterns serving as TF binding sites, amongst others.
Fig. 4
Fig. 4. Overview of CITE-seq data processing.
a, Antibody-derived tags (ADTs) are antibody clones with unique barcodes attached to poly(A) sequences and a PCR handle that is specifically amplified in subsequent library processing steps. The antibody binds to surface proteins, and the sequenced ADT counts represent the expression level of those proteins. b, Although ADT data can be unimodally analysed, it is rarely measured alone, but more commonly in conjunction with matching gene expression data. Such paired count matrices of gene expression and ADTs are subject to individual quality control and normalization followed by individual or jointly visualized embeddings. c, The annotation of CITE-seq data can happen at the level of either the transcriptomics data, the ADT data or jointly by matching clusters to both marker gene and marker ADTs. d, To learn about biological mechanisms, ADT data can be tested for differential abundance, cell–cell communication can be inferred and correlation networks of RNA and ADT information can be constructed. q, q value.
Fig. 5
Fig. 5. Overview of the adaptive immune receptor analysis.
a, Structure of T cell receptors (TCRs) and B cell receptors (BCRs). The diverse adaptive immune receptor (AIR) repertoire is generated through V(D)J recombination, whereby variable (V) and joining (J) gene segments are randomly rearranged for the TCR α-chain and BCR light chain, and further diversity (D) regions are incorporated for the TCR β-chain and BCR heavy chain. b, The generated TCR/BCR raw sequencing data are first mapped against TCR/BCR reference sequences to obtain continuous sequences assembled from mapped reads (contigs). In a process known as contig alignment, the contigs are annotated by V(D)J gene usage and complementarity-determining region (CDR) 1, 2 and 3 amino acid sequences. After cell alignment, the obtained measurements need to be matched to ideally unique full AIR chains. Cells with multiple matching AIRs, missing chains or doublets can influence downstream processing and should be marked. c, The investigation of over-represented V(D)J sequences through spectratyping, motif discovery and gene usage enables insight into preferential sequence selection. d, Clonotypes can be identified to reconstruct recent immune responses through clonotype composition analysis and lineage reconstruction. e, The construction of clonotype similarity networks, database queries and epitope prediction provide insight into the targets recognized by B and T cells.
Fig. 6
Fig. 6. Overview of spatial transcriptomics preprocessing and downstream analysis steps.
a, Array-based spatial transcriptomics technologies quantify gene expression in predefined barcoded (BC) regions with regions spanning areas between 10 μm and 200 μm. BC regions contain measurements from multiple cells, resulting in count matrices and spatial coordinates where each observation is a BC region. Cell-type deconvolution methods decompose the cellular composition of individual BC regions to obtain count matrices and spatial coordinates where each observation is a single cell. Further preprocessing can be performed analogously to analysis of single-cell RNA sequencing (scRNA-seq) data sets. b, Image-based spatial transcriptomics, such as fluorescent in situ hybridization (FISH) and in situ sequencing (ISS) technologies, capture individual locations of transcripts in multiple sequential hybridization rounds. Transcript locations can be aggregated to obtain count matrices and spatial coordinates at single-cell level. Subsequent processing is again performed in a similar manner to scRNA-seq. c, Cellular structure in spatial transcriptomics can be identified at the resolution of single cells or BC regions. Limitations of small feature space in image-based spatial transcriptomics (owing to only the targeted subset of transcripts being measured) can be resolved using spatial mapping, which imputes unmeasured transcripts onto spatial coordinates. d, Mechanisms in spatial transcriptomics can be analysed with respect to spatial positions of cells by identifying genes that vary across space, analysing neighbourhoods of cells and inferring communication events based on receptors and ligands, tight junctions, mechanical effects or indirect mechanisms.

References

    1. Zappia L, Theis FJ. Over 1000 tools reveal trends in the single-cell RNA-seq analysis landscape. Genome Biol. 2021;22:301. doi: 10.1186/s13059-021-02519-4. - DOI - PMC - PubMed
    1. Amezquita RA, et al. Orchestrating single-cell analysis with bioconductor. Nat. Methods. 2020;17:137–145. doi: 10.1038/s41592-019-0654-x. - DOI - PMC - PubMed
    1. Hao Y, et al. Integrated analysis of multimodal single-cell data. Cell. 2021;184:3573–3587.e29. doi: 10.1016/j.cell.2021.04.048. - DOI - PMC - PubMed
    1. Wolf FA, Angerer P, Theis FJ. SCANPY: large-scale single-cell gene expression data analysis. Genome Biol. 2018;19:15. doi: 10.1186/s13059-017-1382-0. - DOI - PMC - PubMed
    1. Luecken MD, Theis FJ. Current best practices in single-cell RNA-seq analysis: a tutorial. Mol. Syst. Biol. 2019;15:e8746. doi: 10.15252/msb.20188746. - DOI - PMC - PubMed

Publication types

MeSH terms