. 2023 Mar 31;23(1):205.
doi: 10.1186/s12877-023-03849-7.

Functional activity level reported by an informant is an early predictor of Alzheimer's disease

Affiliations

Functional activity level reported by an informant is an early predictor of Alzheimer's disease

Alexandra Vik et al. BMC Geriatr. .

Abstract

Background: Loss of autonomy in day-to-day functioning is one of the feared outcomes of Alzheimer's disease (AD), and relatives may have been worried by subtle behavioral changes in ordinary life situations long before these changes are given medical attention. In the present study, we ask if such subtle changes should be given weight as an early predictor of a future AD diagnosis.

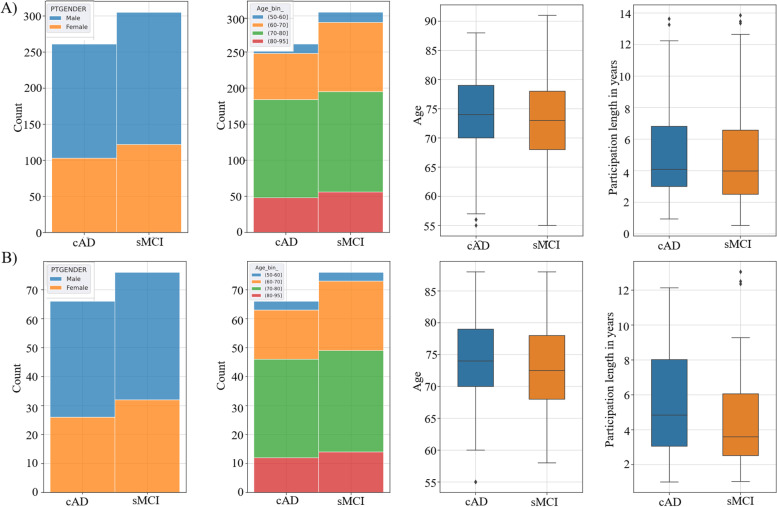
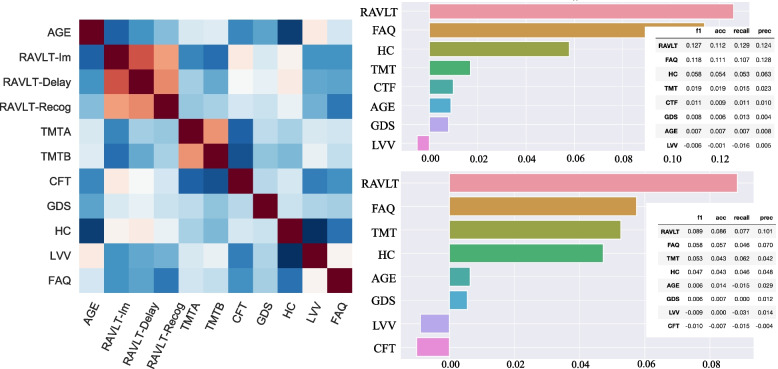
Methods: Longitudinal data from the Alzheimer's Disease Neuroimaging Initiative (ADNI) were used to define a group of adults with a mild cognitive impairment (MCI) diagnosis remaining stable across several visits (sMCI, n=360; 55-91 years at baseline), and a group of adults who over time converted from having an MCI diagnosis to an AD diagnosis (cAD, n=320; 55-88 years at baseline). Eleven features were used as input in a Random Forest (RF) binary classifier (sMCI vs. cAD) model. This model was tested on an unseen holdout part of the dataset, and further explored by three different permutation-driven importance estimates and a comprehensive post hoc machine learning exploration.

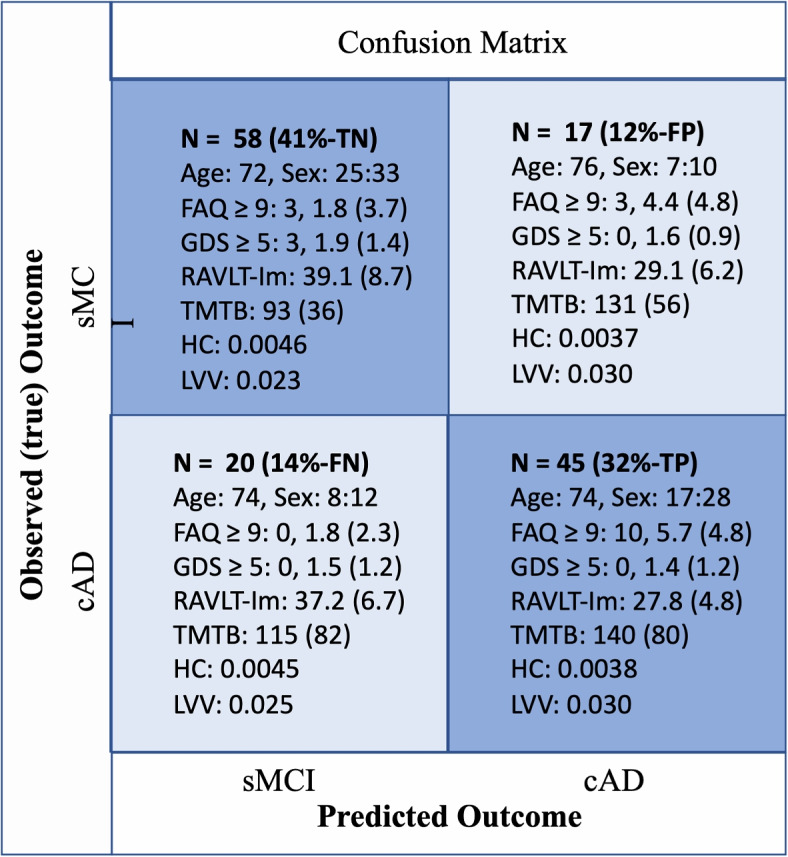
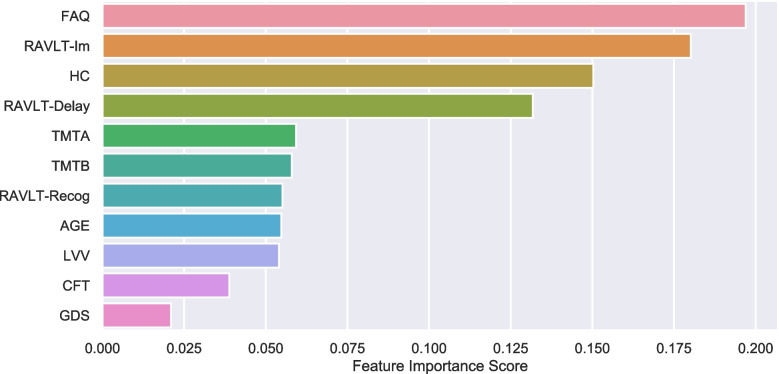
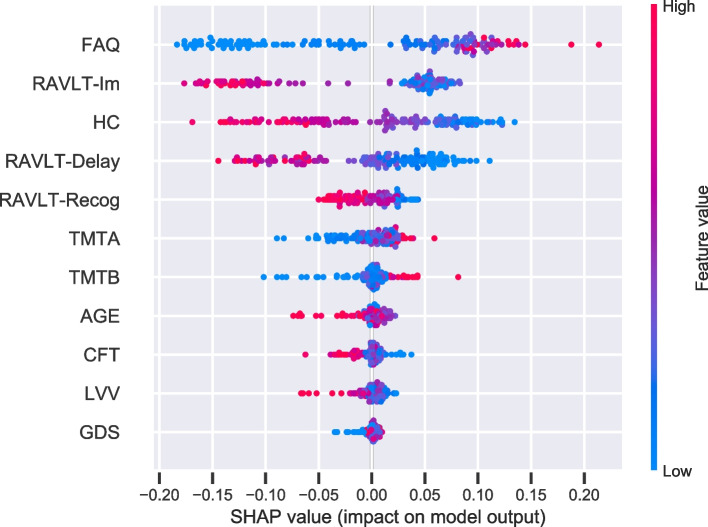
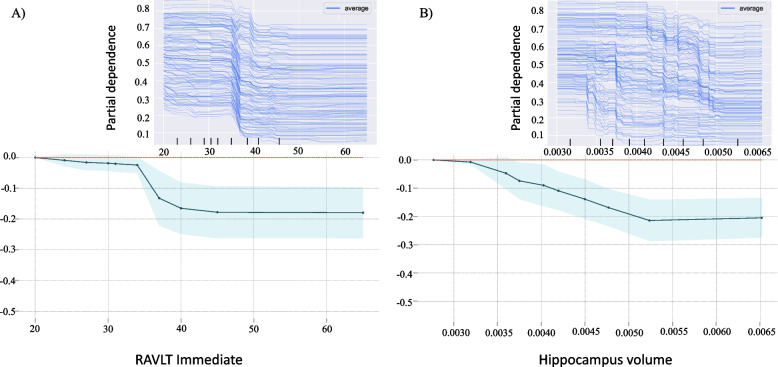
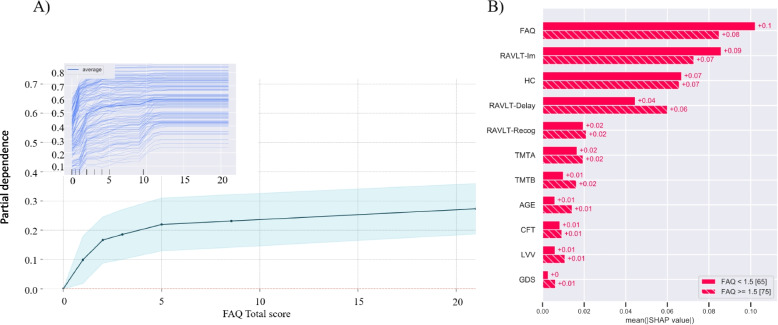
Results: The results consistently showed that measures of daily life functioning, verbal memory function, and a volume measure of hippocampus were the most important predictors of conversion from an MCI to an AD diagnosis. Results from the RF classification model showed a prediction accuracy of around 70% in the test set. Importantly, the post hoc analyses showed that even subtle changes in everyday functioning noticed by a close informant put MCI patients at increased risk for being on a path toward the major cognitive impairment of an AD diagnosis.

Conclusion: The results showed that even subtle changes in everyday functioning should be noticed when reported by relatives in a clinical evaluation of patients with MCI. Information of these changes should also be included in future longitudinal studies to investigate different pathways from normal cognitive aging to the cognitive decline characterizing different stages of AD and other neurodegenerative disorders.

Keywords: Alzheimer’s disease; Classification; Explainable machine learning; Functional activity questionnaire; Mild cognitive impairment; Partial dependency plots; SHapley Additive exPlanations.


Conflict of interest statement

The authors declare no competing interests.

Figures

Fig. 1
Fig. 1
Train-Test Balance. Controlling for gender, age bins, age and length of participation in years in the train (A) and test (B) set
Fig. 2
Fig. 2
Confusion Matrix. The 2 × 2 confusion matrix computed for the sMCI and cAD labels returned from applying the trained nonlinear RF model prediction on the test set compared with the co-occurrences of the true (observed) sMCI/cAD (longitudinal defined diagnose) labels. The diagonal cells represent correctly classified subjects (the number of occurrences in each cell is given as N, TN: true negative, TP: true positive, FP: false positive, FN: false negative), and these cells are shaded in blue. Off-diagonal cells represent various events of misclassification. Observed/predicted co-occurrences are also accompanied, for each cell, with corresponding information about sex ratio (F/M), mean(SD) in; FAQ: Functional Activity Questioner, GDS: Geriatric Depression Scale, RAVLT-Im: Rey Auditory Verbal Learning Test immediate recall, TMTB: Trail Making Test part B, HC: hippocampus volume, LVV: lateral ventricle volume
Fig. 3
Fig. 3
Feature Importance. Bar graph displaying the relative order of the eleven features (y-axis) when classifying sMCI versus cAD by the RF model evaluated on the hold-out validation set. The importance is estimated as gini importance. The x-axis shows the relative importance score. RAVLT: Rey Auditory Verbal Learning Test, TMT: Trail Making Test part A and B, CFT: Category Fluency Test; LVV: lateral ventricle volumes, GDS: Geriatric Depression Scale, FAQ: Functional Activity Questioner
Fig. 4
Fig. 4
Permutation importance with grouping of correlated features. Displays permutation importance (right upper panel) and the drop-feature importance (right lower panel). Results are reported by taking the average across 2000 repetitions. The importance score (x-axis) is illustrated by the F1-score in the graphs, whereas the complete model evaluation table (accuracy, recall, precision, and F1 scores) is superimposed. Due to multicollinearity, illustrated in the correlation matrix (left panel), RAVLT subscores (Im, Delay and Recog) were grouped: RAVLT, and also for the two parts, A and B, of the TMT in the presented permutation results (right upper and lower panels)
Fig. 5
Fig. 5
SHAP importance. The figure displays the SHAP summary plot of the features of the RF model. A dot is created for each feature attribution value for the model of each subject. Dots are colored according to feature values. Thus, higher values (represented by red color) for FAQ and lower values for RAVLT -Im, -Delay, and HC (blue) increase the prediction of conversion to AD. Symmetrically, low values in FAQ and high values in RAVLT and HC decrease the prediction of conversion to AD. When the distribution is clustered around 0 indicates that the feature is less relevant. The more skewed the distribution, the more important the feature. The features are ordered according to their importance
Fig. 6
Fig. 6
The dependence of the prediction on a single features. Illustrates the marginal effect of RAVLT Immediate (A) and hippocampus volume (B), have on our RF model. The X-axis represents the range of the feature, and the Y-axis shows changes in the prediction. Positive values represent the contribution of the feature to the increase in the odds to convert to AD. The shaded area represents the standard deviation. The same effects can be observed in the ICE plot and the PDP for RAVLT recall (A). However, the ICE plot for the hippocampus shows a skewed tendency (B)
Fig. 7
Fig. 7
Model exploration: PDP of the FAQ and SHAP auto-cohort split. A Illustrates the marginal effect the FAQ total score have on the RF model. The X-axis represents the range of FAQ values (0-30), and the Y-axis shows changes in the prediction. Positive values represent the contribution of the FAQ to the increase in the odds to convert to AD. The shaded area represents the standard deviation. The individual composition expectation (ICE) plot is superimposed on the PDP. B Two cohorts are optimally separated by the SHAP values by applying auto-cohort feature of explanation, utilizing a DecisionTreeRegressor from scikit-learn. By this, separation is given between those scoring less than 1.5 and those 1.5 in the FAQ. Hence, creating two cohorts with 65 and 75 subjects in each. The bar plot displays the mean SHAP values for each group for each feature

References

    1. Jekel K, Damian M, Wattmo C, Hausner L, Bullock R, Connelly PJ, et al. Mild cognitive impairment and deficits in instrumental activities of daily living: a systematic review. Alzheimers Res Ther. 2015;7(1):17. doi: 10.1186/s13195-015-0099-0. - DOI - PMC - PubMed
    1. Cipriani G, Danti S, Picchi L, Nuti A, Fiorino MD. Daily functioning and dementia. Dement Neuropsychologia. 2020;14:93–102. doi: 10.1590/1980-57642020dn14-020001. - DOI - PMC - PubMed
    1. Petersen RC. Mild cognitive impairment as a diagnostic entity. J Intern Med. 2004;256(3):183–194. doi: 10.1111/j.1365-2796.2004.01388.x. - DOI - PubMed
    1. Daly E, Zaitchik D, Copeland M, Schmahmann J, Gunther J, Albert M. Predicting conversion to Alzheimer disease using standardized clinical information. Arch Neurol. 2000;57:675–680. doi: 10.1001/archneur.57.5.675. - DOI - PubMed
    1. Tomaszewski Farias S, Cahn-Weiner DA, Harvey DJ, Reed BR, Mungas D, Kramer JH, et al. Longitudinal changes in memory and executive functioning are associated with longitudinal change in instrumental activities of daily living in older adults. Clin Neuropsychologist. 2009;23:446–461. doi: 10.1080/13854040802360558. - DOI - PMC - PubMed

Publication types