. 2023 Mar 31;24(1):125.
doi: 10.1186/s12859-023-05210-6.

Sparse clusterability: testing for cluster structure in high dimensions

Affiliations

Sparse clusterability: testing for cluster structure in high dimensions

Jose Laborde et al. BMC Bioinformatics. .

Abstract

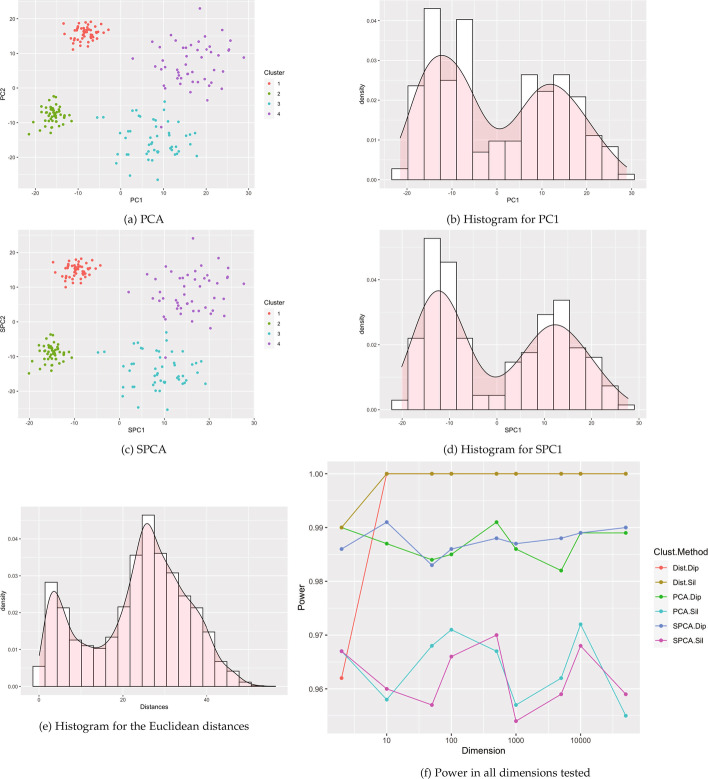
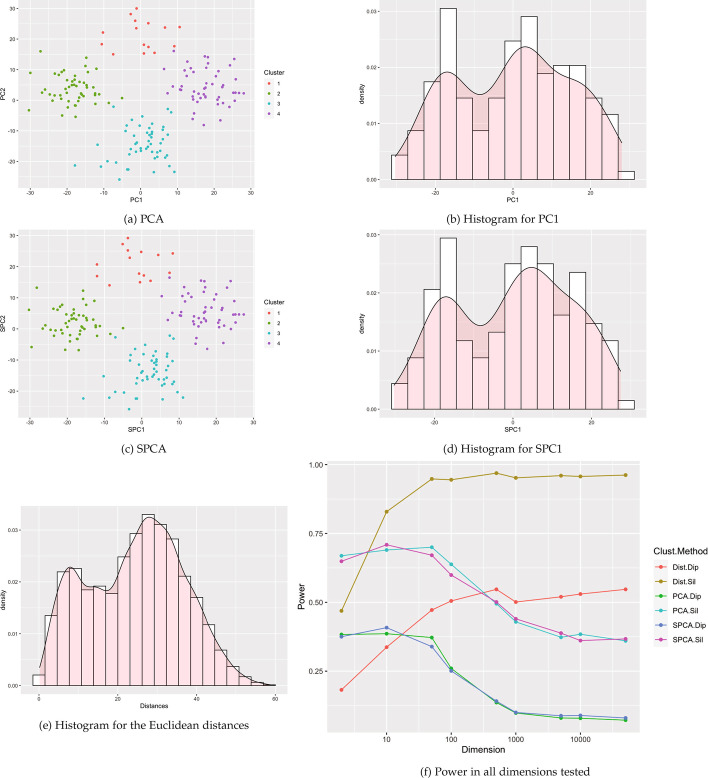
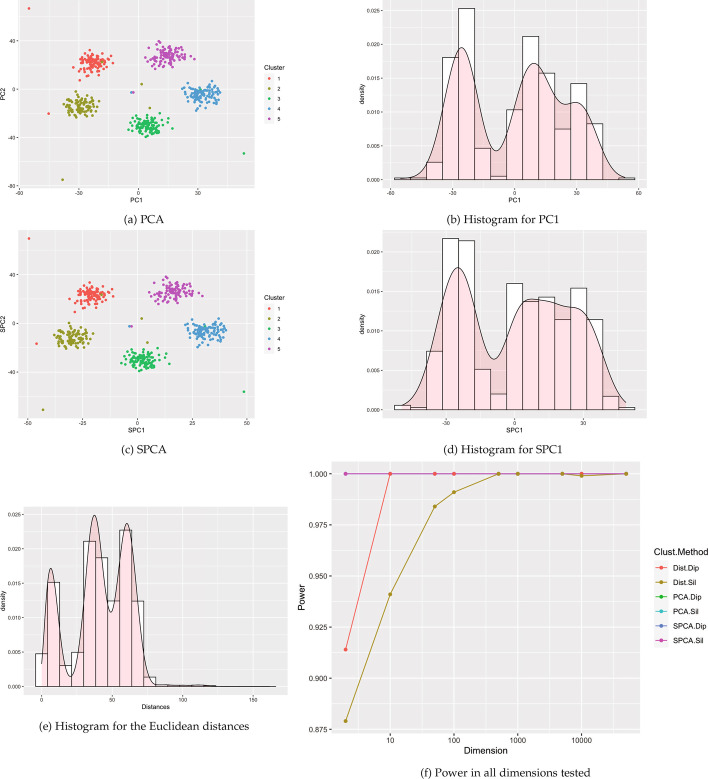
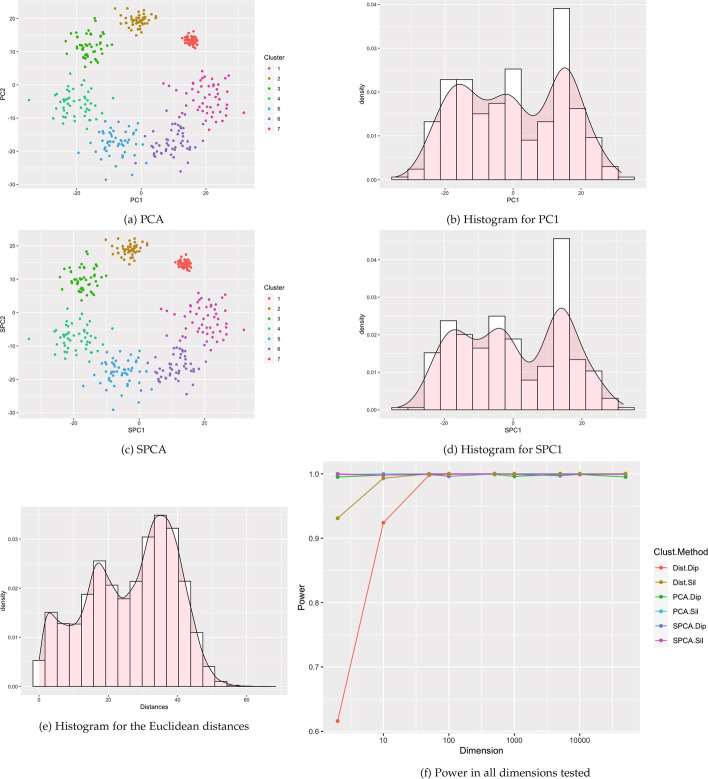
Background: Cluster analysis is utilized frequently in scientific theory and applications to separate data into groups. A key assumption in many clustering algorithms is that the data was generated from a population consisting of multiple distinct clusters. Clusterability testing allows users to question the inherent assumption of latent cluster structure, a theoretical requirement for meaningful results in cluster analysis.

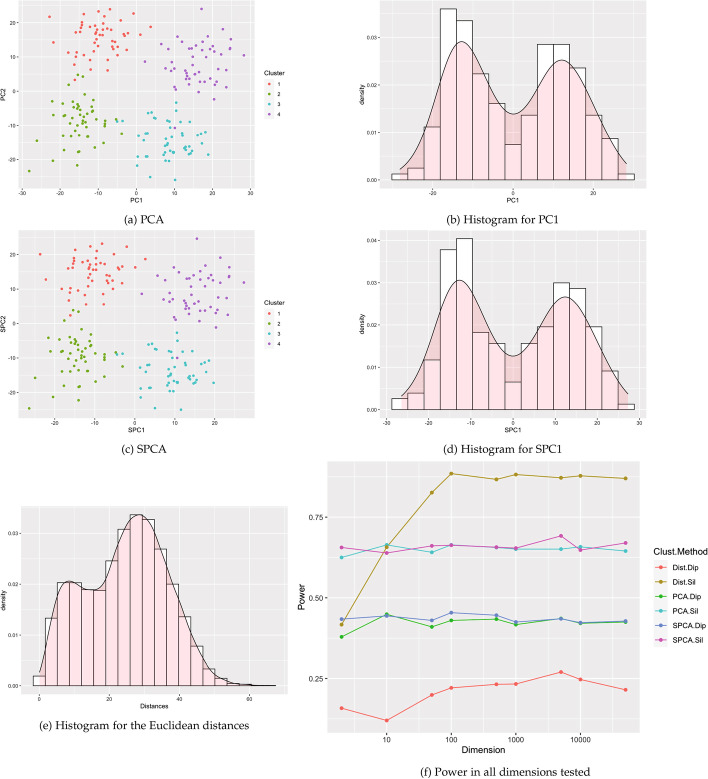
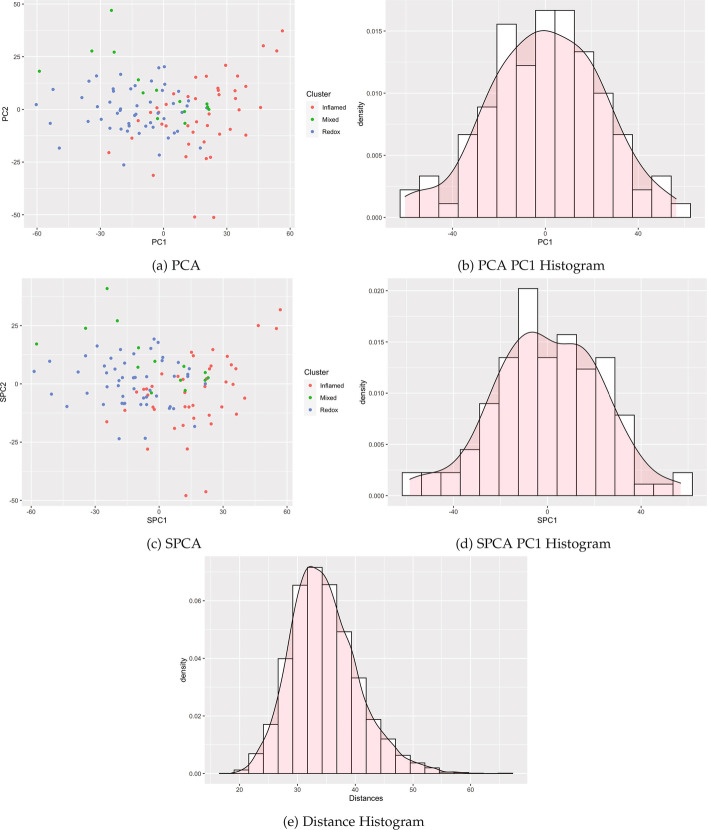
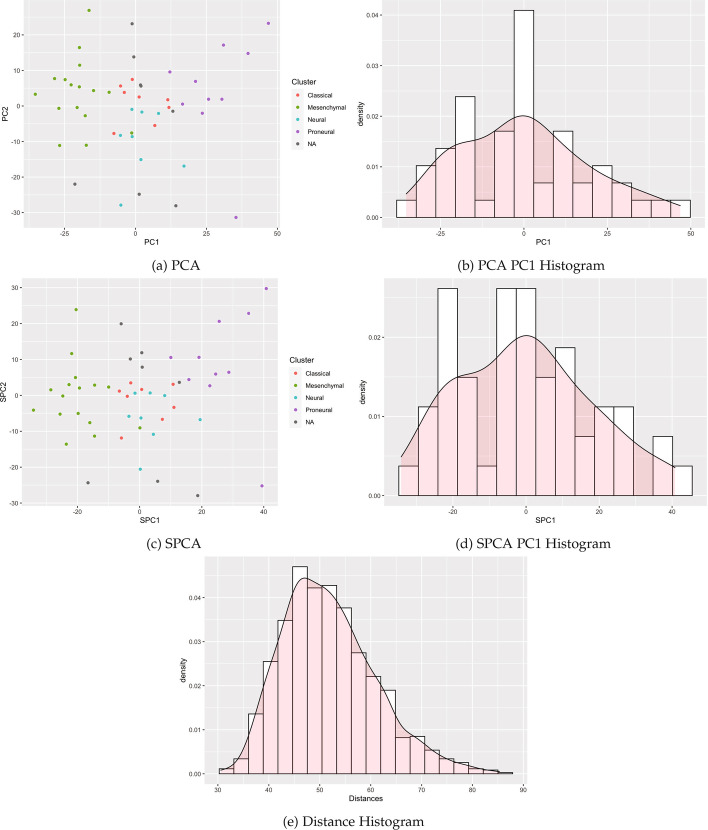
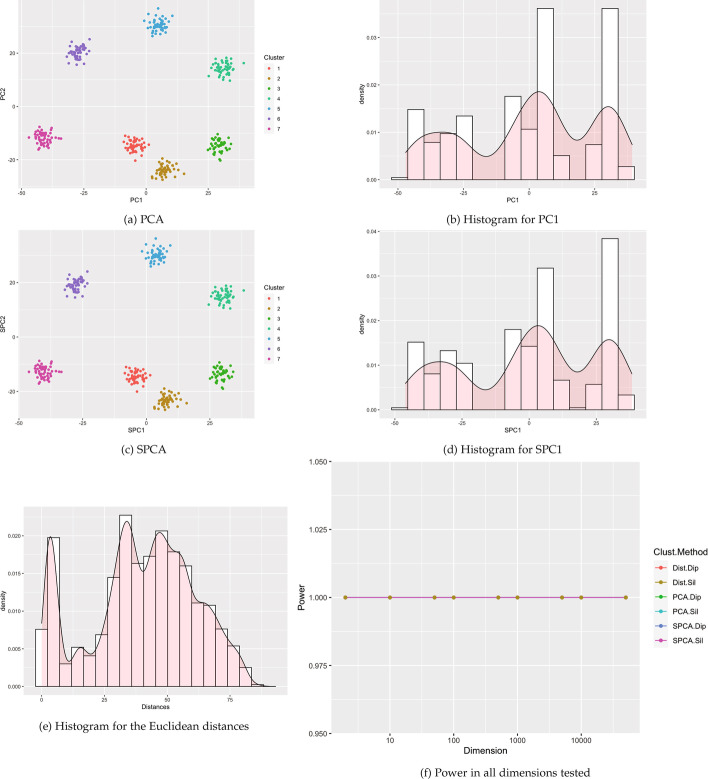
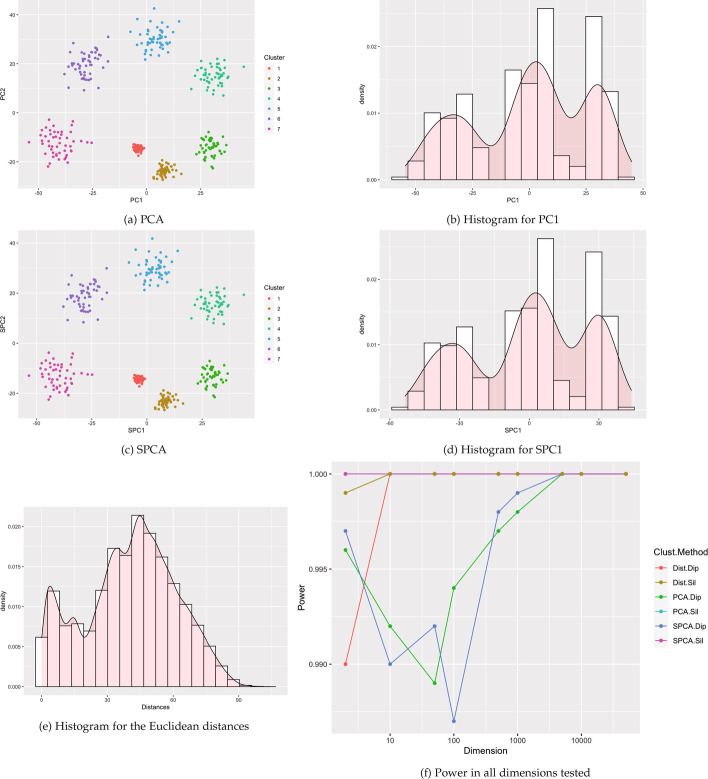
Results: This paper proposes methods for clusterability testing designed for high-dimensional data by utilizing sparse principal component analysis. Type I error and power of the clusterability tests are evaluated using simulated data with different types of cluster structure in high dimensions. Empirical performance of the new methods is evaluated and compared with prior methods on gene expression, microarray, and shotgun proteomics data. Our methods had reasonably low Type I error and maintained power for many datasets with a variety of structures and dimensions. Cluster structure was not detectable in other datasets with spatially close clusters.

Conclusion: This is the first analysis of clusterability testing on both simulated and real-world high-dimensional data.

Keywords: Big data; Cluster analysis; Cluster tendency; Clustering; Dimension reduction; Distance metrics; Multimodality testing; Principal component analysis; Sparsity.


Conflict of interest statement

NCB served as an ad hoc reviewer in 2020 for the American Cancer Society, for which she received sponsored travel during the review meeting and a stipend of US $300. NCB received a series of small awards for conference and travel support, including US $500 from the Statistical Consulting Section of the American Statistical Association (ASA) for Best Paper Award at the 2019 Joint Statistical Meetings. Currently, NCB serves as the Vice President for the Florida Chapter of the ASA and Section Representative for the ASA Statistical Consulting Section, and on the Regional Committee for the Eastern North American Region of the International Biometrics Society. Previously, NCB served as the Florida ASA Chapter Representative, as the mentoring subcommittee chair for the Regional Advisory Board of the Eastern North American Region of the International Biometrics Society, and on the Scientific Review Board at Moffitt Cancer Center. JL is the Information Officer for the ASA Florida Chapter. YAC currently serves on the Scientific Review Board at Moffitt Cancer Center.

Figures

Fig. 1
Fig. 1
Example visualizations based 4 Gaussian clusters with equal variances (Case 2). ae are example visuals based on p=500 dimensions. f shows power estimates in dimensions from p=2 to 50,000, using 1000 simulated data sets of n=200 observations for each dimension
Fig. 2
Fig. 2
Visualizations based on a single cluster (Case 1). ae are example visuals based on p=500 dimensions. f shows Type I error estimates in dimensions from p=2 to 50,000, using 1000 simulated data sets for each dimension
Fig. 3
Fig. 3
Flowchart for options of data reduction methods and multimodality tests. New methods proposed in this paper are denoted by the yellow bubble for SPCA as a new dimension reduction method, combined with each of two available multimodality tests (dip and Silverman) shown with orange bubbles
Fig. 4
Fig. 4
Single cell RNA-seq
Fig. 5
Fig. 5
Pan-cancer RNA-seq
Fig. 6
Fig. 6
Pan-lung cancer microarray
Fig. 7
Fig. 7
Squamous cell lung cancer proteomics
Fig. 8
Fig. 8
Glioblastoma RNA-seq
Fig. 9
Fig. 9
Visualizations for example Case 3: data set generated with 4 Gaussian clusters where 2 clusters have different variances to the other 2. All visualizations represent the use of a single example simulation in dimension p=500 except for Power which is measured in dimensions from p=2 to 50 K via estimation based off 1000 simulated data sets on each dimension
Fig. 10
Fig. 10
Visualizations for example Case 4: 4 Gaussian clusters with one cluster pushed to the outside. All visualizations represent the use of a single example simulation in dimension p=500 except for Power which is measured in dimensions from p=2 to 50 K via estimation based off 1000 simulated data sets on each dimension
Fig. 11
Fig. 11
Visualizations for example Case 5: four clusters with one small cluster. All visualizations represent the use of a single example simulation in dimension p=500 except for Power which is measured in dimensions from p=2 to 50 K via estimation based off 1000 simulated data sets on each dimension
Fig. 12
Fig. 12
Visualizations for example Case 6: five clusters with one central cluster. All visualizations represent the use of a single example simulation in dimension p=500 except for Power which is measured in dimensions from p=2 to 50 K via estimation based off 1000 simulated data sets on each dimension
Fig. 13
Fig. 13
Visualizations for example Case 7: five clusters with ten outliers. All visualizations represent the use of a single example simulation in dimension p=500 except for Power which is measured in dimensions from p=2 to 50K via estimation based off 1000 simulated data sets on each dimension
Fig. 14
Fig. 14
Visualizations for example Case 8: seven clusters with different variances. All visualizations represent the use of a single example simulation in dimension p=500 except for Power which is measured in dimensions from p=2 to 50 K via estimation based off 1000 simulated data sets on each dimension
Fig. 15
Fig. 15
Visualizations for example Case 9: seven clusters with different push apart degrees. All visualizations represent the use of a single example simulation in dimension p=500 except for Power which is measured in dimensions from p=2 to 50 K via estimation based off 1000 simulated data sets on each dimension
Fig. 16
Fig. 16
Visualizations for example Case 10: seven clusters with different push apart degrees and variances. All visualizations represent the use of a single example simulation in dimension p=500 except for Power which is measured in dimensions from p=2 to 50K via estimation based off 1000 simulated data sets on each dimension

References

    1. Adolfsson A, Ackerman M, Brownstein NC. To cluster, or not to cluster: an analysis of clusterability methods. Pattern Recognit. 2019;88:13–26. doi: 10.1016/j.patcog.2018.10.026. - DOI
    1. Brownstein NC, Adolfsson A, Ackerman M. Descriptive statistics and visualization of data from the r datasets package with implications for clusterability. Data Brief. 2019;25:104004. doi: 10.1016/j.dib.2019.104004. - DOI - PMC - PubMed
    1. Alexander TA, Irizarry RA, Bravo HC. Capturing discrete latent structures: choose LDs over PCs. Biostatistics. 2023;24(1):1–16. doi: 10.1093/biostatistics/kxab030. - DOI - PMC - PubMed
    1. Zou H, Hastie T, Tibshirani R. Sparse principal component analysis. J Comput Graph Stat. 2006;15(2):265–286. doi: 10.1198/106186006X113430. - DOI
    1. Yellamraju T, Boutin M. Clusterability and clustering of images and other “real” high-dimensional data. IEEE Trans Image Process. 2018;27(4):1927–1938. doi: 10.1109/TIP.2017.2789327. - DOI - PubMed

LinkOut - more resources