

Metabolomic analysis of aqueous humor reveals potential metabolite biomarkers for differential detection of macular edema
- PMID: 37004107
- PMCID: PMC10067239
- DOI: 10.1186/s40662-023-00331-8
Metabolomic analysis of aqueous humor reveals potential metabolite biomarkers for differential detection of macular edema
Abstract
Background: Macular edema (ME) is a major complication of retinal disease with multiple mechanisms involved in its development. This study aimed to investigate the metabolite profile of aqueous humor (AH) in patients with ME of different etiologies and identify potential metabolite biomarkers for early diagnosis of ME.
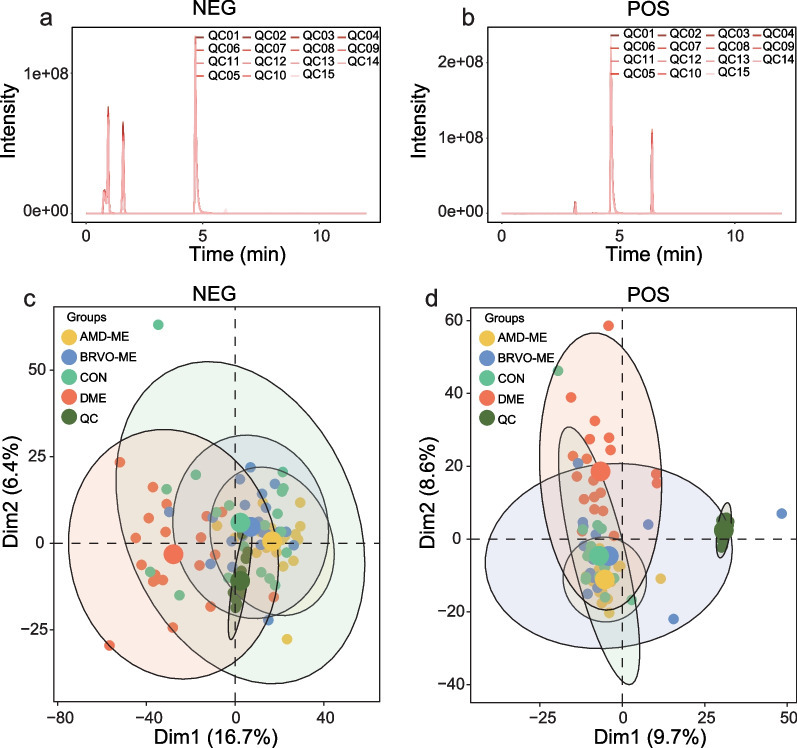
Methods: Samples of AH were collected from 60 patients with ME and 20 age- and sex-matched controls and analyzed by liquid chromatography-mass spectrometry (LC/MS)-based metabolomics. A series of univariate and multivariate statistical analyses were performed to identify differential metabolites and enriched metabolite pathways.
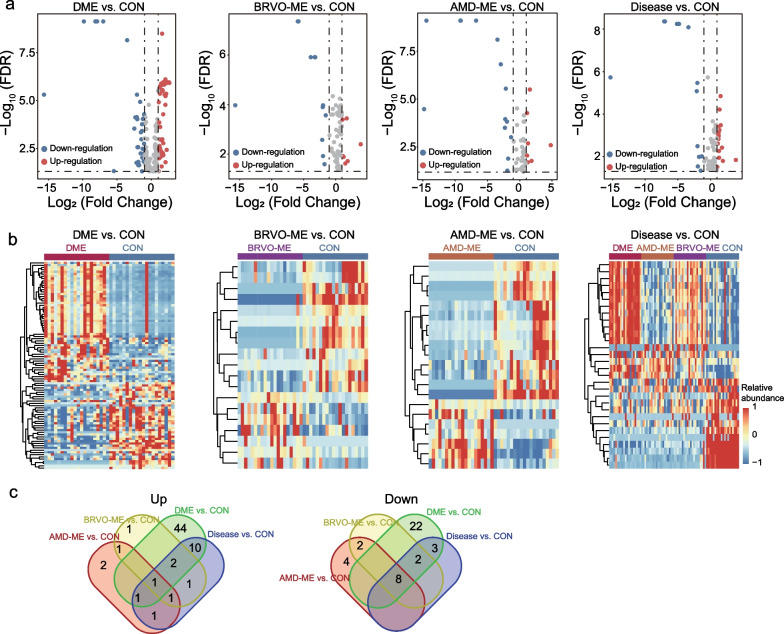
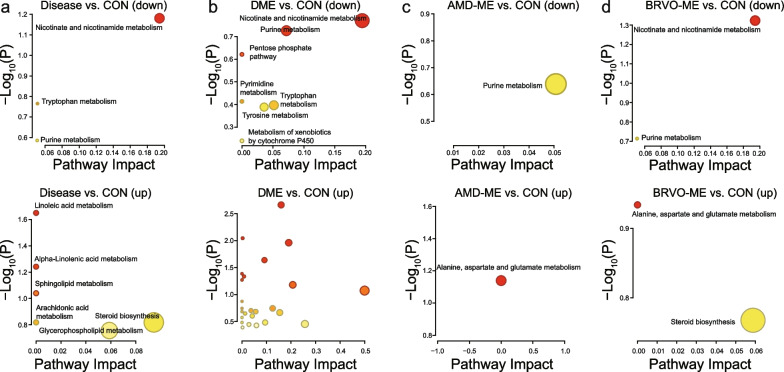
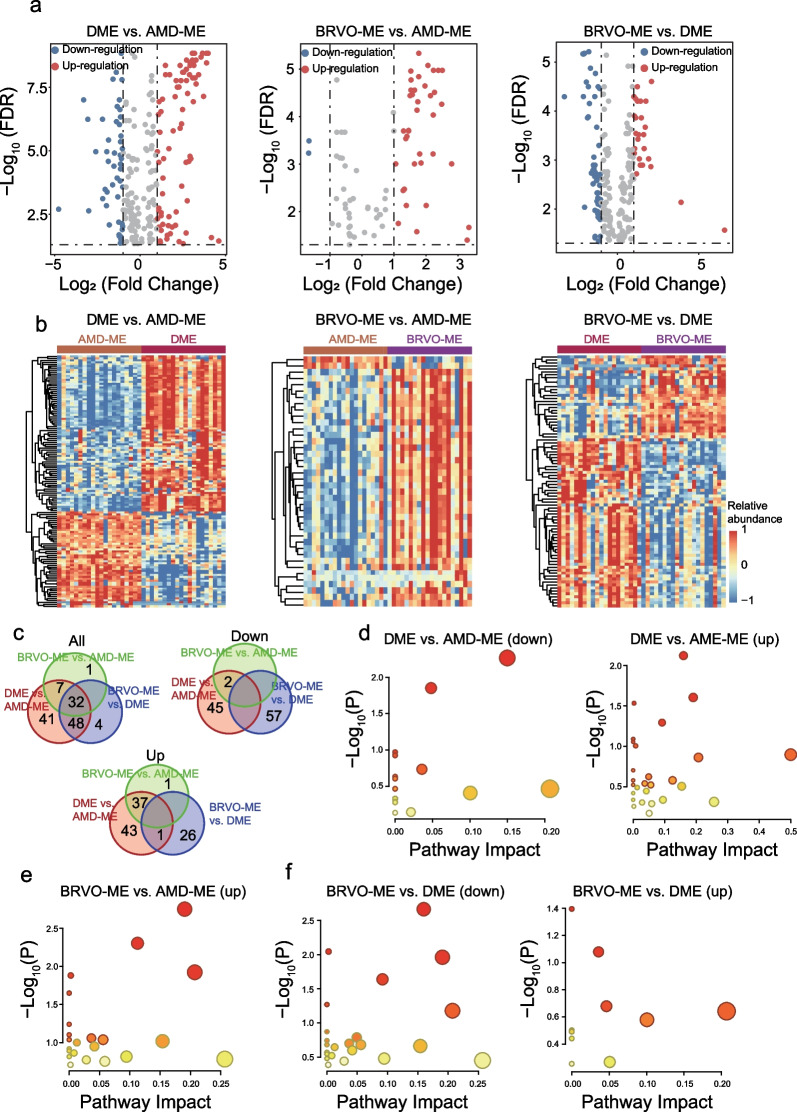
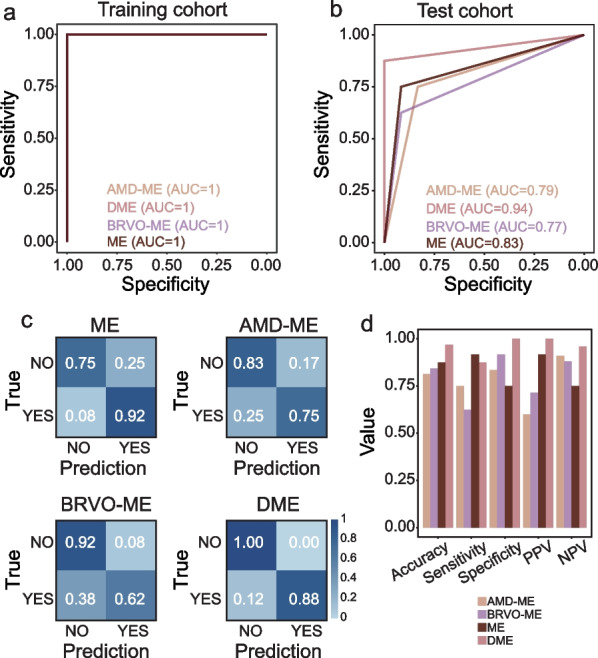
Results: The metabolic profile of AH differed significantly between ME patients and healthy controls, and differentially expressed metabolites were identified. Pathway analysis revealed that these differentially expressed metabolites are mainly involved in lipid metabolism and amino acid metabolism. Moreover, significant differences were identified in the metabolic composition of AH from patients with ME due to different retinal diseases including age-related macular degeneration (AMD-ME), diabetic retinopathy (DME) and branch retinal vein occlusion (BRVO-ME). In total, 39 and 79 etiology-specific altered metabolites were identified for AMD-ME and DME, respectively. Finally, an AH-derived machine learning-based diagnostic model was developed and successfully validated in the test cohort with an area under the receiver operating characteristic (ROC) curve of 0.79 for AMD-ME, 0.94 for DME and 0.77 for BRVO-ME.
Conclusions: Our study illustrates the potential underlying metabolic basis of AH of different etiologies across ME populations. We also identify AH-derived metabolite biomarkers that may improve the differential diagnosis and treatment stratification of ME patients with different etiologies.
Keywords: Liquid chromatography-mass spectrometry; Macular edema; Metabolic biomarkers; Metabolomics.
© 2023. The Author(s).
Conflict of interest statement
The authors declare that they have no competing interests.
Figures
Similar articles
-
Metabolomics analysis uncovers metabolic changes and remodeling of anti-VEGF therapy on macular edema.Eye Vis (Lond). 2025 Jul 14;12(1):28. doi: 10.1186/s40662-025-00444-2. Eye Vis (Lond). 2025. PMID: 40653498 Free PMC article.
-
Untargeted Metabolomic Study of Patients with Macular Edema Secondary to Retinal Vein Occlusion in Aqueous Humor.Clin Ophthalmol. 2025 Jan 6;19:59-72. doi: 10.2147/OPTH.S500860. eCollection 2025. Clin Ophthalmol. 2025. PMID: 39801565 Free PMC article.
-
Metabolite Changes in the Aqueous Humor of Patients With Retinal Vein Occlusion Macular Edema: A Metabolomics Analysis.Front Cell Dev Biol. 2021 Dec 21;9:762500. doi: 10.3389/fcell.2021.762500. eCollection 2021. Front Cell Dev Biol. 2021. PMID: 34993196 Free PMC article.
-
Aqueous humour concentrations of PEDF and Erythropoietin are not influenced by subthreshold micropulse laser treatment of diabetic macular edema.Biosci Rep. 2019 Jun 18;39(6):BSR20190328. doi: 10.1042/BSR20190328. Print 2019 Jun 28. Biosci Rep. 2019. PMID: 31138761 Free PMC article. Review.
-
Differentiation of Underlying Pathologies of Macular Edema Using Spectral Domain Optical Coherence Tomography (SD-OCT).Ocul Immunol Inflamm. 2019;27(3):474-483. doi: 10.1080/09273948.2019.1603313. Ocul Immunol Inflamm. 2019. PMID: 31184556 Review.
Cited by
-
Second-derivative UV spectral analysis of aqueous humor for eye disease diagnosis and assessing the effects of food additives on ocular health.Sci Rep. 2025 May 19;15(1):17307. doi: 10.1038/s41598-025-02190-w. Sci Rep. 2025. PMID: 40389612 Free PMC article.
-
Implications of Ocular Confounding Factors for Aqueous Humor Proteomic and Metabolomic Analyses in Retinal Diseases.Transl Vis Sci Technol. 2024 Jun 3;13(6):17. doi: 10.1167/tvst.13.6.17. Transl Vis Sci Technol. 2024. PMID: 38913008 Free PMC article.
-
Recurrence of macular edema in patients with branch retinal vein occlusion: a proteomic study.BMC Ophthalmol. 2024 Feb 22;24(1):82. doi: 10.1186/s12886-024-03359-z. BMC Ophthalmol. 2024. PMID: 38388341 Free PMC article.
-
Revolutionary Point-of-Care Wearable Diagnostics for Early Disease Detection and Biomarker Discovery through Intelligent Technologies.Adv Sci (Weinh). 2024 Sep;11(36):e2400595. doi: 10.1002/advs.202400595. Epub 2024 Jul 3. Adv Sci (Weinh). 2024. PMID: 38958517 Free PMC article. Review.
-
Molecular-Genetic Biomarkers of Diabetic Macular Edema.J Clin Med. 2024 Dec 5;13(23):7426. doi: 10.3390/jcm13237426. J Clin Med. 2024. PMID: 39685883 Free PMC article. Review.
References
-
- Bekkers A, Borren N, Ederveen V, Fokkinga E, De Jesus DA, Brea LS, Klein S, van Walsum T, Barbosa-Breda J, Stalmans I. Microvascular damage assessed by OCT angiography for glaucoma diagnosis: a systematic review of the most discriminative regions. Acta Ophthalmol. 2020;98(6):537–558. doi: 10.1111/aos.14392. - DOI - PMC - PubMed
Grants and funding
LinkOut - more resources
Full Text Sources
