. 2023 Mar 31;14(1):7.
doi: 10.1186/s43008-023-00112-x.

The first two mitochondrial genomes from Apiotrichum reveal mitochondrial evolution and different taxonomic assignment of Trichosporonales

Affiliations

The first two mitochondrial genomes from Apiotrichum reveal mitochondrial evolution and different taxonomic assignment of Trichosporonales

Qiang Li et al. IMA Fungus. .

Abstract

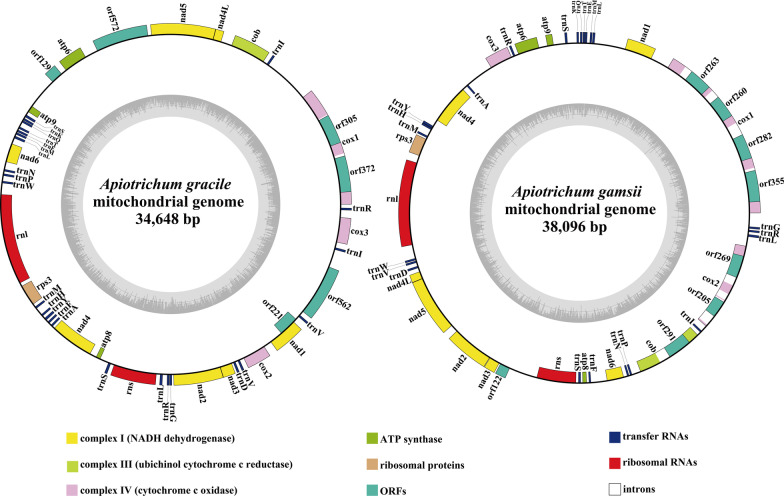
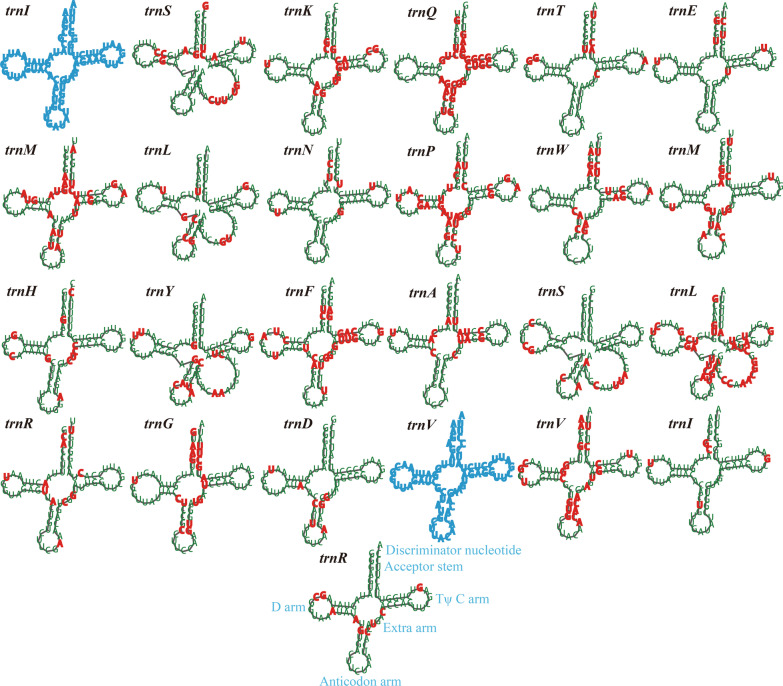
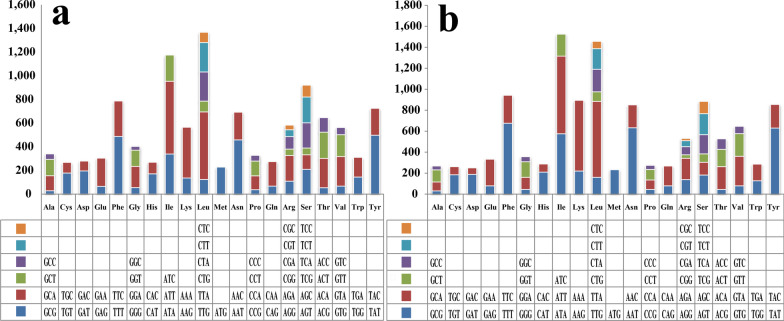
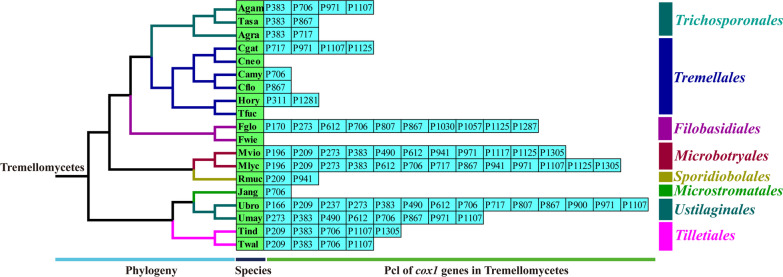
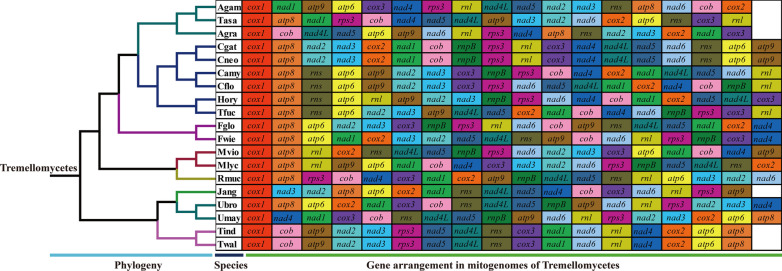
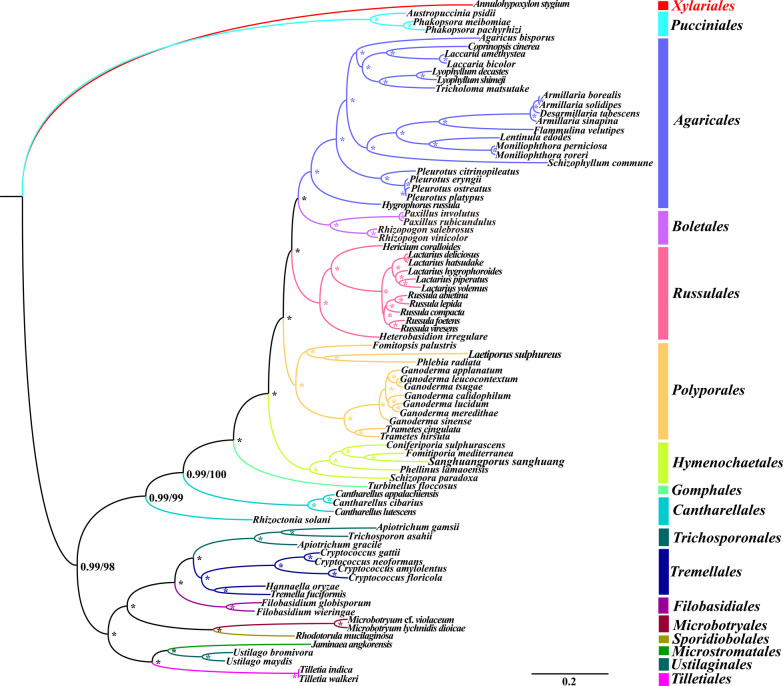
Apiotrichum is a diverse anamorphic basidiomycetous yeast genus, and its mitogenome characterization has not been revealed. In this study, we assembled two Apiotrichum mitogenomes and compared them with mitogenomes from Agaricomycotina, Pucciniomycotina and Ustilaginomycotina. The mitogenomes of Apiotrichum gracile and A. gamsii comprised circular DNA molecules, with sizes of 34,648 bp and 38,096 bp, respectively. Intronic regions were found contributed the most to the size expansion of A. gamsii mitogenome. Comparative mitogenomic analysis revealed that 6.85-38.89% of nucleotides varied between tRNAs shared by the two Apiotrichum mitogenomes. The GC content of all core PCGs in A. gamsii was lower than that of A. gracile, with an average low value of 4.97%. The rps3 gene differentiated the most among Agaricomycotina, Pucciniomycotina and Ustilaginomycotina species, while nad4L gene was the most conserved in evolution. The Ka/Ks values for cob and rps3 genes were > 1, indicating the two genes may be subjected to positive selection in Agaricomycotina, Pucciniomycotina and Ustilaginomycotina. Frequent intron loss/gain events and potential intron transfer events have been detected in evolution of Agaricomycotina, Pucciniomycotina and Ustilaginomycotina. We further detected large-scale gene rearrangements between the 19 mitogenomes from Agaricomycotina, Pucciniomycotina and Ustilaginomycotina, and fifteen of the 17 mitochondrial genes shared by Apiotrichum varied in gene arrangements. Phylogenetic analyses based on maximum likelihood and Bayesian inference methods using a combined mitochondrial gene dataset revealed different taxonomic assignment of two Apiotrichum species, wherein A. gamsii had a more closely relationship with Trichosporon asahii. This study served as the first report on mitogenomes from the genus Apiotrichum, which promotes the understanding of evolution, genomics, and phylogeny of Apiotrichum.

Keywords: Gene rearrangement; Intron; Mitogenome; Phylogenetic analysis; Taxonomy.


Conflict of interest statement

The authors declare that they have no competing interests.

Figures

Fig. 1
Fig. 1
Circular maps of the two Apiotrichum mitogenomes. Genes are represented by different colored blocks. Colored blocks outside each ring indicate that the genes are on the direct strand, while colored blocks within the ring indicates that the genes are located on the reverse strand. The inner grayscale bar graph shows the GC content of the mitochondrial sequences. The circle inside the GC content graph marks the 50% threshold
Fig. 2
Fig. 2
Putative secondary structures of tRNA genes identified in the mitogenomes of two Apiotrichum species. The 23 tRNAs in green or red fonts represent tRNAs shared by the two Apiotrichum species, while the tRNA in blue font represent tRNA only in A. gracile. Residues conserved across the two mitogenomes are shown in green, while variable sites are shown in red. All genes are shown in order of occurrence in the mitochondrial genome of A. gracile starting from trnI
Fig. 3
Fig. 3
The protein-coding, intronic, intergenic, and RNA gene region proportions of the entire mitogenomes of the two Apiotrichum species. The bottom panel shows the contribution of different gene regions to the expansion of the A. gamsii mitogenome
Fig. 4
Fig. 4
Codon usage in the mitogenomes of two Apiotrichum species. Frequency of codon usage is plotted on the y-axis. a Apiotrichum gracile; b Apiotrichum gamsii
Fig. 5
Fig. 5
Genetic analysis of 15 protein coding genes conserved in 19 mitogenomes from Agaricomycotina, Pucciniomycotina and Ustilaginomycotina. K2P, the Kimura-2-parameter distance; Ka, the mean number of nonsynonymous substitutions per nonsynonymous site; Ks, the mean number of synonymous substitutions per synonymous site
Fig. 6
Fig. 6
Position class (Pcl) information of cox1 genes in the 19 species. Introns in cox1 genes of 19 published mitogenomes were classified into different position classes (Pcls) using the cox1 gene of Ganoderma calidophilum as the reference. Each Pcl was constituted by introns inserted at the same position of corresponding cox1 gene and named according to its insertion site in the aligned corresponding reference sequence (nt). The Pcls present in more than 1/5 of species were considered as common Pcls, while introns detected in less than 1/5 of species were considered to be rare introns. Phylogenetic positions of the 19 species were established using the Bayesian inference (BI) method and Maximum Likelihood (ML) method based on combined mitochondrial data sets. Species information is shown in Additional file 1: Table S7
Fig. 7
Fig. 7
Mitochondrial gene arrangement analyses of the 19 mitogenomes from Agaricomycotina, Pucciniomycotina and Ustilaginomycotina. The same gene were represented by same color blocks. Phylogenetic positions of the 19 species were established using the Bayesian inference (BI) method and Maximum Likelihood (ML) method based on combined mitochondrial data sets. Species information is shown in Additional file 1: Table S7
Fig. 8
Fig. 8
Molecular phylogeny of 81 Basidiomycota species based on Bayesian inference (BI) and Maximum likelihood (ML) analysis of 15 protein coding genes. Support values are Bayesian posterior probabilities (BPP, before slash) and bootstrap values (BS, after slash). An asterisk indicates that the BPP and BS values are 1.00 and 100, respectively. Species and NCBI accession numbers for mitogenomes used in the phylogenetic analysis are provided in Additional file 1: Table S7

References

    1. Abuduaini A, Wang YB, Zhou HY, Kang RP, Ding ML, Jiang Y, Suo FY, Huang LD. The complete mitochondrial genome of Ophiocordyceps gracilis and its comparison with related species. IMA Fungus. 2021;12:31. doi: 10.1186/s43008-021-00081-z. - DOI - PMC - PubMed
    1. Adams KL, Palmer JD. Evolution of mitochondrial gene content: gene loss and transfer to the nucleus. Mol Phylogenet Evol. 2003;29:380–395. doi: 10.1016/S1055-7903(03)00194-5. - DOI - PubMed
    1. Adams KL, Qiu YL, Stoutemyer M, Palmer JD. Punctuated evolution of mitochondrial gene content: high and variable rates of mitochondrial gene loss and transfer to the nucleus during angiosperm evolution. Proc Natl Acad Sci USA. 2002;99:9905–9912. doi: 10.1073/pnas.042694899. - DOI - PMC - PubMed
    1. Aguileta G, de Vienne DM, Ross ON, Hood ME, Giraud T, Petit E, Gabaldon T. High variability of mitochondrial gene order among fungi. Genome Biol Evol. 2014;6:451–465. doi: 10.1093/gbe/evu028. - DOI - PMC - PubMed
    1. Ali SS, Amoako-Attah I, Shao J, Kumi-Asare E, Meinhardt LW, Bailey BA. Mitochondrial genomics of six cacao pathogens from the basidiomycete family Marasmiaceae. Front Microbiol. 2021;12:752094. doi: 10.3389/fmicb.2021.752094. - DOI - PMC - PubMed

LinkOut - more resources