. 2023 May:91:104534.
doi: 10.1016/j.ebiom.2023.104534. Epub 2023 Mar 31.

SARS-CoV-2 variant transition dynamics are associated with vaccination rates, number of co-circulating variants, and convalescent immunity

Affiliations

SARS-CoV-2 variant transition dynamics are associated with vaccination rates, number of co-circulating variants, and convalescent immunity

Lauren J Beesley et al. EBioMedicine. 2023 May.

Abstract

Background: Throughout the COVID-19 pandemic, the SARS-CoV-2 virus has continued to evolve, with new variants outcompeting existing variants and often leading to different dynamics of disease spread.

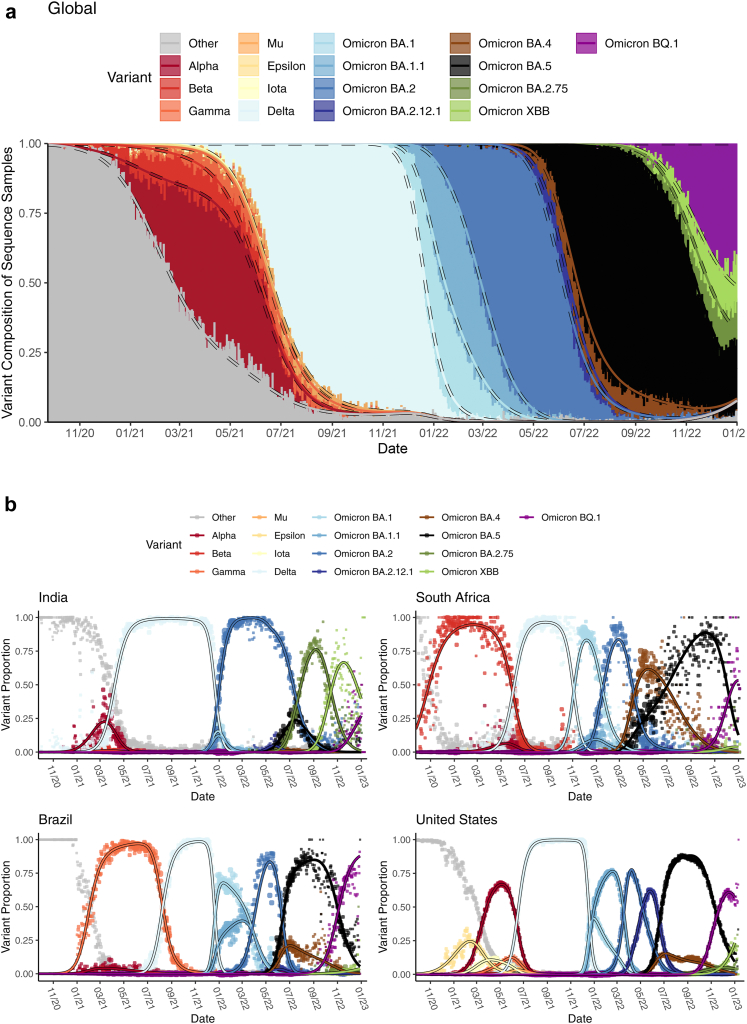
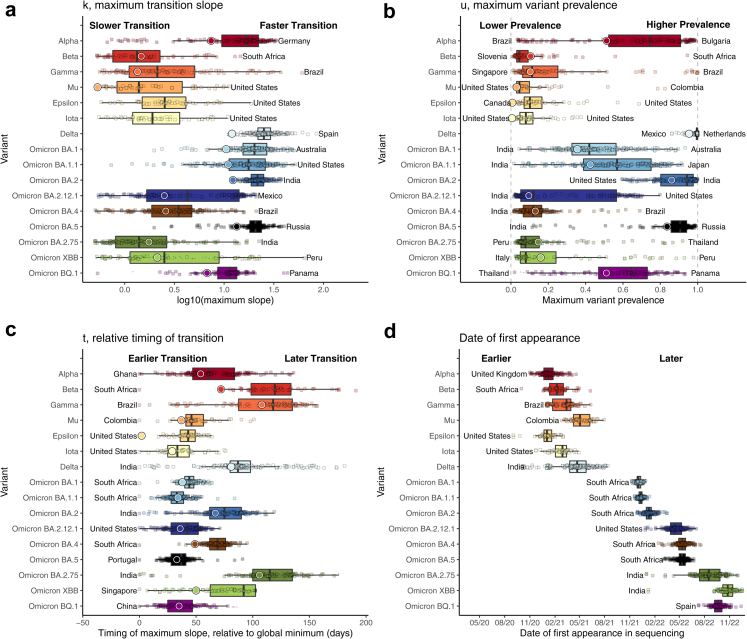
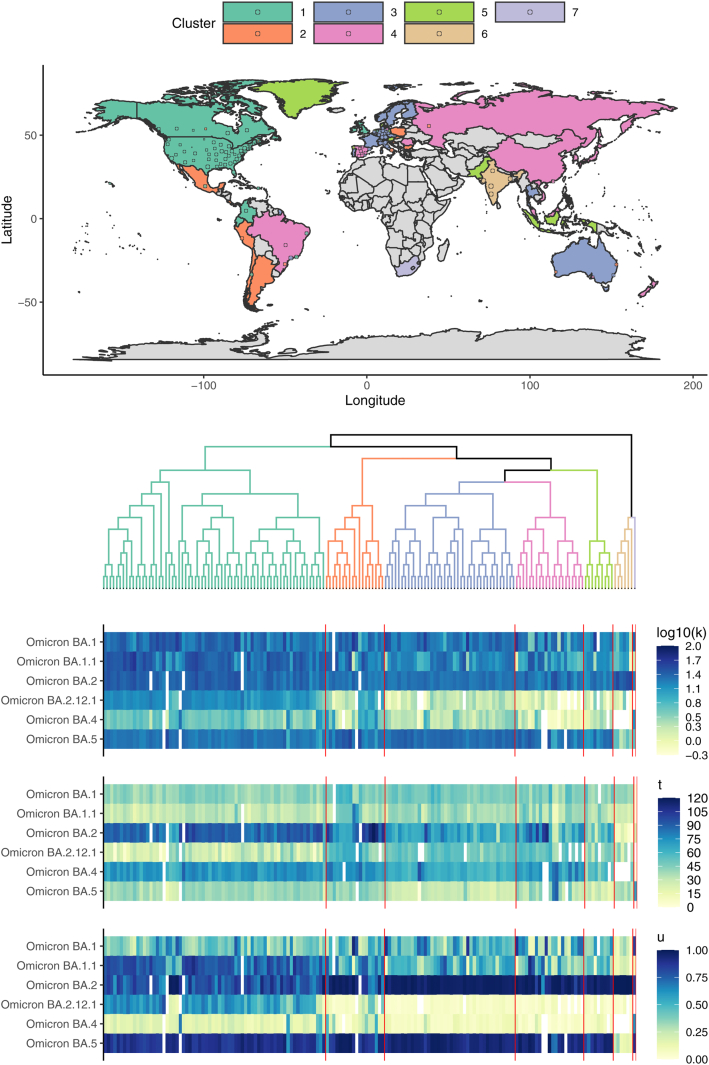
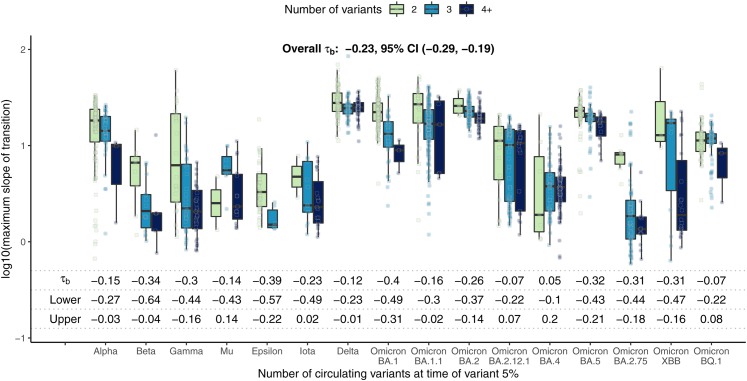
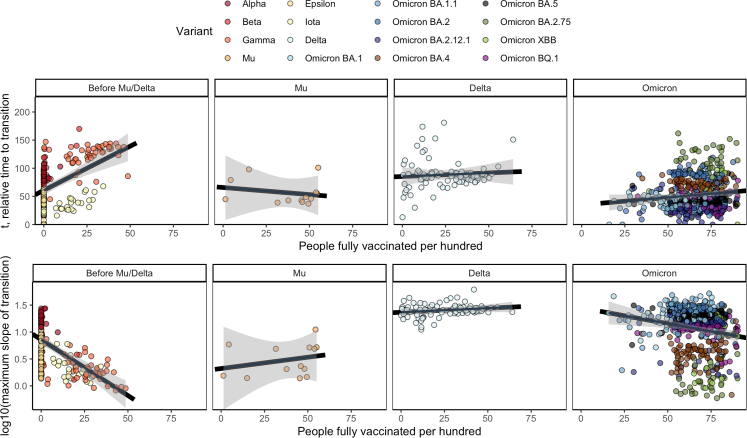
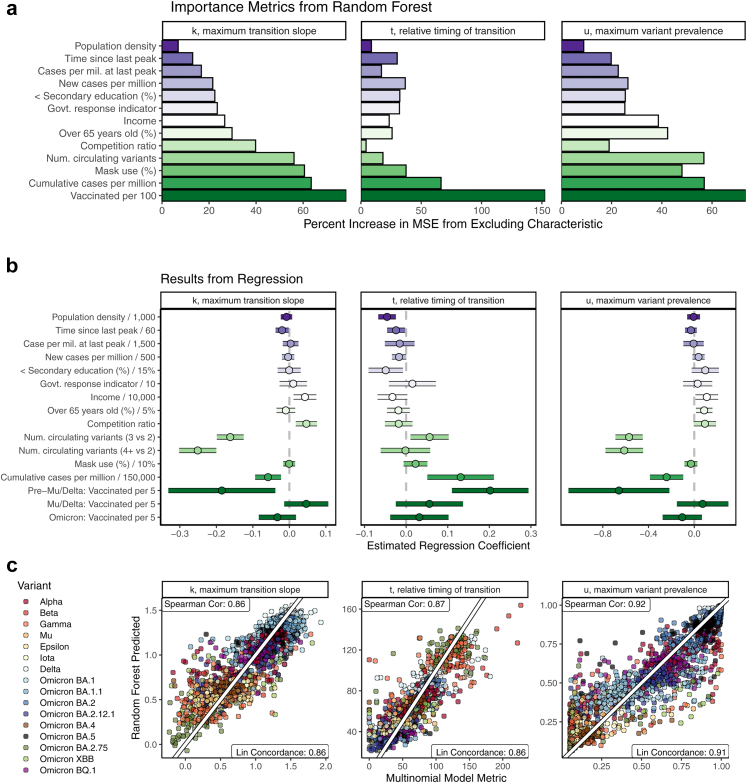
Methods: In this paper, we performed a retrospective analysis using longitudinal sequencing data to characterize differences in the speed, calendar timing, and magnitude of 16 SARS-CoV-2 variant waves/transitions for 230 countries and sub-country regions, between October 2020 and January 2023. We then clustered geographic locations in terms of their variant behavior across several Omicron variants, allowing us to identify groups of locations exhibiting similar variant transitions. Finally, we explored relationships between heterogeneity in these variant waves and time-varying factors, including vaccination status of the population, governmental policy, and the number of variants in simultaneous competition.

Findings: This work demonstrates associations between the behavior of an emerging variant and the number of co-circulating variants as well as the demographic context of the population. We also observed an association between high vaccination rates and variant transition dynamics prior to the Mu and Delta variant transitions.

Interpretation: These results suggest the behavior of an emergent variant may be sensitive to the immunologic and demographic context of its location. Additionally, this work represents the most comprehensive characterization of variant transitions globally to date.

Funding: Laboratory Directed Research and Development (LDRD), Los Alamos National Laboratory.

Keywords: COVID-19; GISAID; SARS-CoV-2; Variant transition.


Conflict of interest statement

Declaration of interests Dr. Theiler received a Bill and Melinda Gates Foundation Grant for bioinformatic analysis unrelated to the present work. The authors have no other conflicts of interest to report.

Figures

Fig. 1
Fig. 1
Daily variant composition of all SARS-CoV-2 sequences reported to GISAID (a) globally and (b) for four example countries (points) along with fitted variant proportions (lines) from the primary analysis. Fitted lines show the point estimates obtained from fitting the multinomial model in (Eq. 1). The size of the plotted points corresponds to the total number of sequenced samples, relative to the daily maximum within each country. For panel (a), global sequences attributed to each variant for a given date were weighted proportional to the confirmed cases reported for each sequence's corresponding country on that date.
Fig. 2
Fig. 2
Boxplots of (a) highest variant transition speeds, k, (b) highest variant prevalences, u, (c) relative timings, t, and (d) date of first variant appearance across 230 locations, with text annotations indicating the countries having the highest and/or lowest value. Large circles correspond to global estimates based on analyzing all locations together, weighting each sequence proportional to the confirmed cases reported for that sequence's corresponding country on that date. For emerging variants Omicron BA.2.75, XBB.1/XBB, and BQ.1, medium- and small-sized circles provide estimates for locations that have and have not reached their maximum fitted slope by 1/17/2023, respectively. For transitions that haven't yet reached their maximum slope, maximum slope estimates are expected to increase as more data become available. Maximum variant prevalences are also likely to increase as more data are collected. Small global estimates of k for Epsilon (0.11) and Iota (0.09) variants are not shown. These results demonstrate substantial heterogeneity in variant transition dynamics between locations. Rectangles represent the 25th–75th quantiles of the plotted variable, and outliers are defined as values exceeding 1.5 times the inter-quartile range beyond the rectangle in either direction.
Fig. 3
Fig. 3
Hierarchical clustering of k (maximum transition slope), t (relative timing of transition), and u (maximum prevalence) across Omicron variant waves, excluding Omicron BA.2.75, XBB, and BQ.1. The semi-transparent circles overlaid on the map provide estimates for included sub-national region locations. Some sub-national regions outside of contiguous national boundaries (e.g., Greenland, a sub-region of Denmark) are instead filled in with the appropriate color to reflect the regional value. Countries shown in grey are those for which data were either unavailable or insufficient. The heatmap illustrates the estimated summary metrics for all locations and all Omicron variant transitions considered for clustering. South Africa and India were notable for their distinctive transition dynamics.
Fig. 4
Fig. 4
Global estimate boxplots of k, the maximum slope of the variant transition curve, by the number of co-circulating variants (including the variant itself) at the time of variant 5% prevalence. Kendall's τb correlation and corresponding 95% confidence intervals are also provided. Overall, a higher number of co-circulating variants was associated with lower transition speed for many variants. Rectangles represent the 25th–75th quantiles of the plotted variable, and outliers are defined as values exceeding 1.5 times the inter-quartile range beyond the rectangle in either direction.
Fig. 5
Fig. 5
Global estimates of t and k, the timing and magnitude of the maximum slope of the transition curve, by the vaccination rate at the time of variant 5% prevalence. 95% confidence bands (Bonferroni multiple testing adjusted) for the fitted linear regression for each panel are shown in gray. Higher vaccination rates were associated higher transition speed and later transitions prior to the Mu/Delta variants. We did not see a clear association between vaccination and transition properties for Mu and Delta variants, and the association appeared attenuated for Omicron sub-variants.
Fig. 6
Fig. 6
Relative importance (a) and regression model coefficient estimates (b) of two adjusted models for associations between location characteristics and variant transition summaries. A comparison of random forest-predicted summary metrics to estimates from (Eq. 2) is shown in (c). Vaccination rates, cumulative prior cases per million, population density, population age, the time since the last case wave peak, and the number of co-circulating variants were all associated with variant transition dynamics after adjusting for other location characteristics.1 1Random forest importance measured in terms of percent increase in mean squared prediction error. For regression modeling, continuous predictors were scaled by constants, and point estimates and 95% confidence intervals are provided. Gaussian, Quasi-Poisson, and Beta regression were used for log10(k), t, and u, respectively. All models also adjusted for variant/sub-variant. Missing predictor information was handled using imputation. The out-of-bag root mean squared prediction error (RMSE) for random forest and regression models, respectively, were as follows: 0.217 vs. 0.271 for log(k), 16.39 vs. 20.78 for t, and 0.138 vs. 0.188 for u. RMSE was calculated across 10,000 bagged trees for random forest models and using 10-fold cross validation separately for each imputed dataset for regression models.

References

    1. Holmes E., Zhang Y.-Z. 2019. Novel 2019 coronavirus genome.https://virological.org/t/novel-2019-coronavirus-genome/319 URL.
    1. Badr H.S., Zaitchik B.F., Kerr G.H., et al. Unified real-time environmental-epidemiological data for multiscale modeling of the COVID-19 pandemic. medRxiv. 2021 doi: 10.1101/2021.05.05.21256712. - DOI - PMC - PubMed
    1. Korber B., Fischer W.M., Gnanakaran S., et al. Tracking changes in SARS-CoV-2 Spike: evidence that D614G increases infectivity of the COVID-19 virus. Cell. 2020;182(4):812–827.e19. doi: 10.1016/j.cell.2020.06.043. - DOI - PMC - PubMed
    1. Gobeil S.M.C., Janowska K., McDowell S., et al. D614G mutation alters SARS-CoV-2 spike conformation and enhances protease cleavage at the S1/S2 junction. Cell Rep. 2021;34(2):108630. doi: 10.1016/j.celrep.2020.108630. - DOI - PMC - PubMed
    1. Liu Y., Liu J., Plante K.S., et al. The N501Y spike substitution enhances SARS-CoV-2 infection and transmission. Nature. 2022;602(7896):294–299. doi: 10.1038/s41586-021-04245-0. - DOI - PMC - PubMed

Supplementary concepts