. 2023;16(1):17-37.
doi: 10.1016/j.jcmgh.2023.03.007. Epub 2023 Mar 31.

AXL Expression on Homeostatic Resident Liver Macrophages Is Reduced in Cirrhosis Following GAS6 Production by Hepatic Stellate Cells

Affiliations

AXL Expression on Homeostatic Resident Liver Macrophages Is Reduced in Cirrhosis Following GAS6 Production by Hepatic Stellate Cells

Oltin-Tiberiu Pop et al. Cell Mol Gastroenterol Hepatol. 2023.

Abstract

Background & aims: AXL and MERTK expression on circulating monocytes modulated immune responses in patients with cirrhosis (CD14+HLA-DR+AXL+) and acute-on-chronic liver failure (CD14+MERTK+). AXL expression involved enhanced efferocytosis, sustained phagocytosis, but reduced tumor necrosis factor-α/interleukin-6 production and T-cell activation, suggesting a homeostatic function. Axl was expressed on murine airway in tissues contacting the external environment, but not interstitial lung- and tissue-resident synovial lining macrophages. Here, we assessed AXL expression on tissue macrophages in patients with cirrhosis.

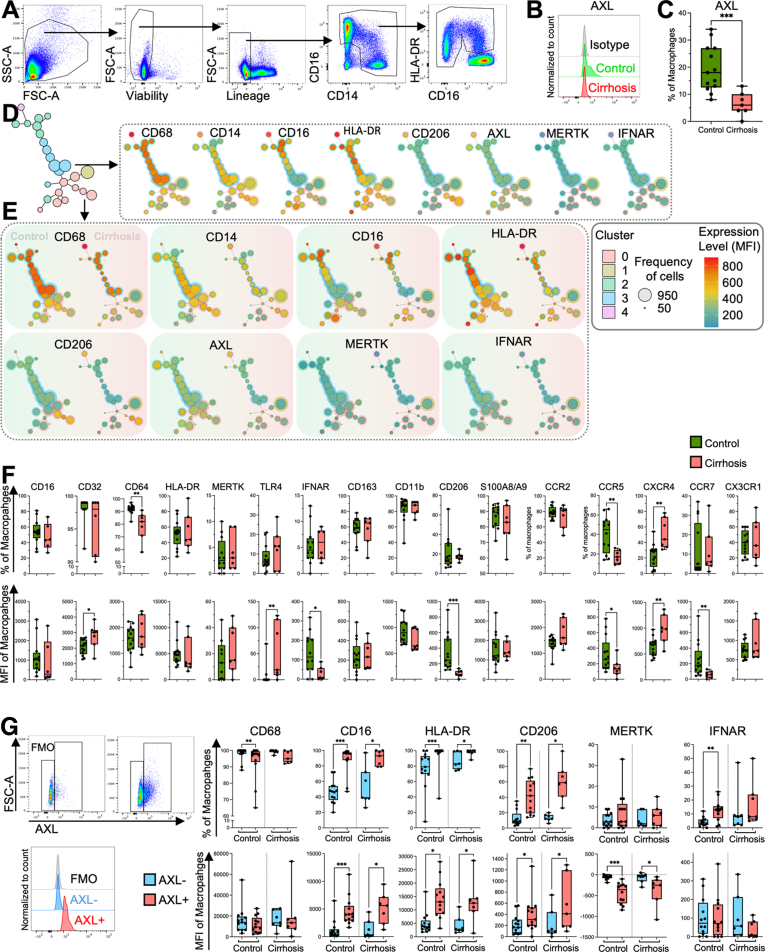
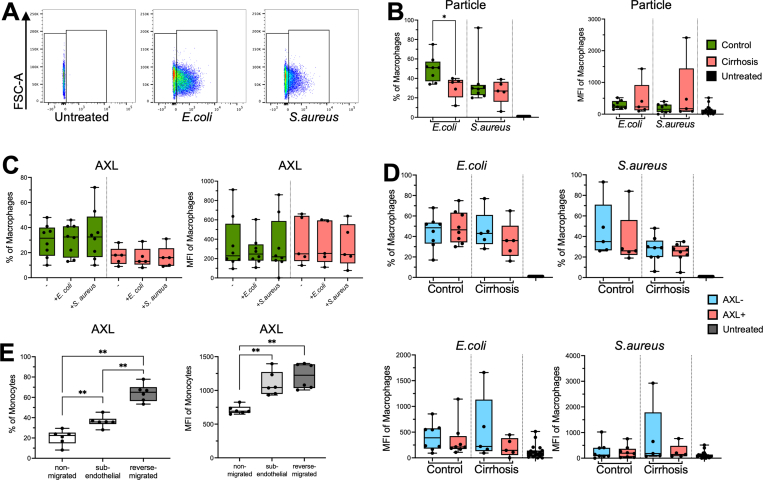
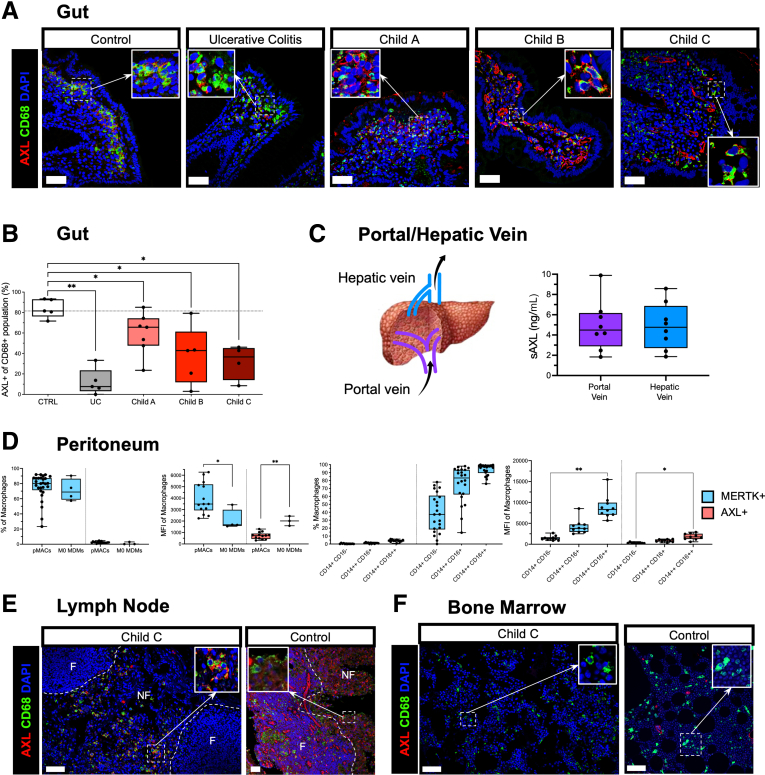
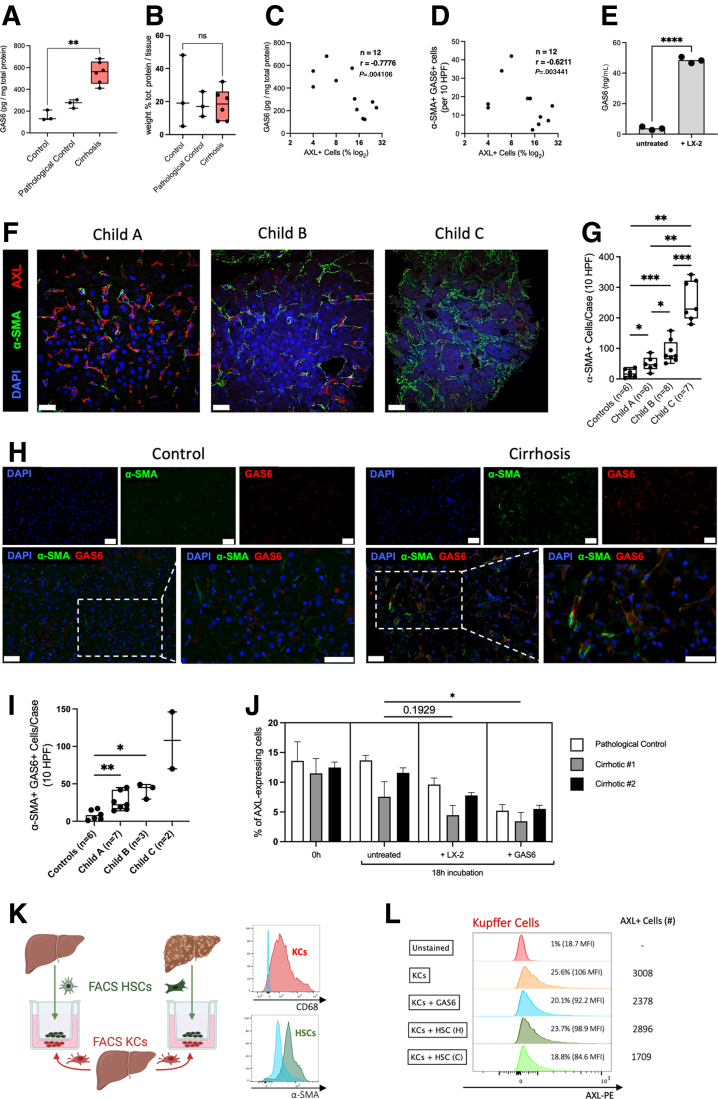
Methods: Using multiplexed immunofluorescence we compared AXL expression in liver biopsies in cirrhosis (n = 22), chronic liver disease (n = 8), non-cirrhotic portal hypertension (n = 4), and healthy controls (n = 4). Phenotype and function of isolated primary human liver macrophages were characterized by flow cytometry (cirrhosis, n = 11; control, n = 14) ex vivo. Also, AXL expression was assessed on peritoneal (n = 29) and gut macrophages (n = 16) from cirrhotic patients. Regulation of AXL expression was analyzed in vitro and ex vivo using primary hepatic stellate cells (HSCs), LX-2 cells, and GAS6 in co-culture experiments.

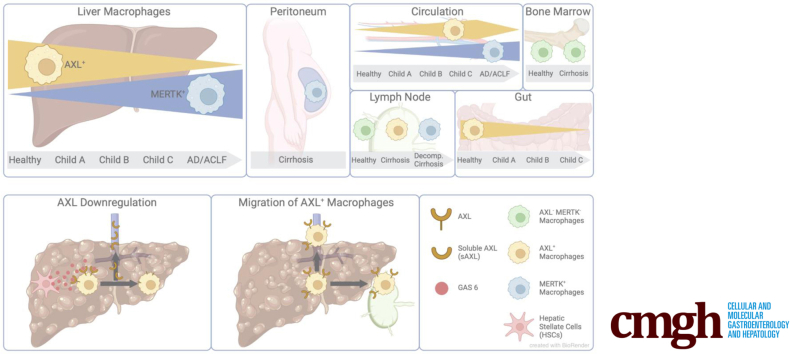
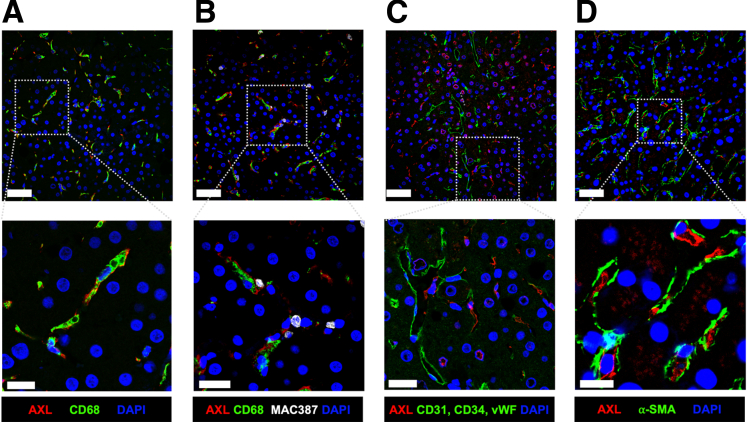
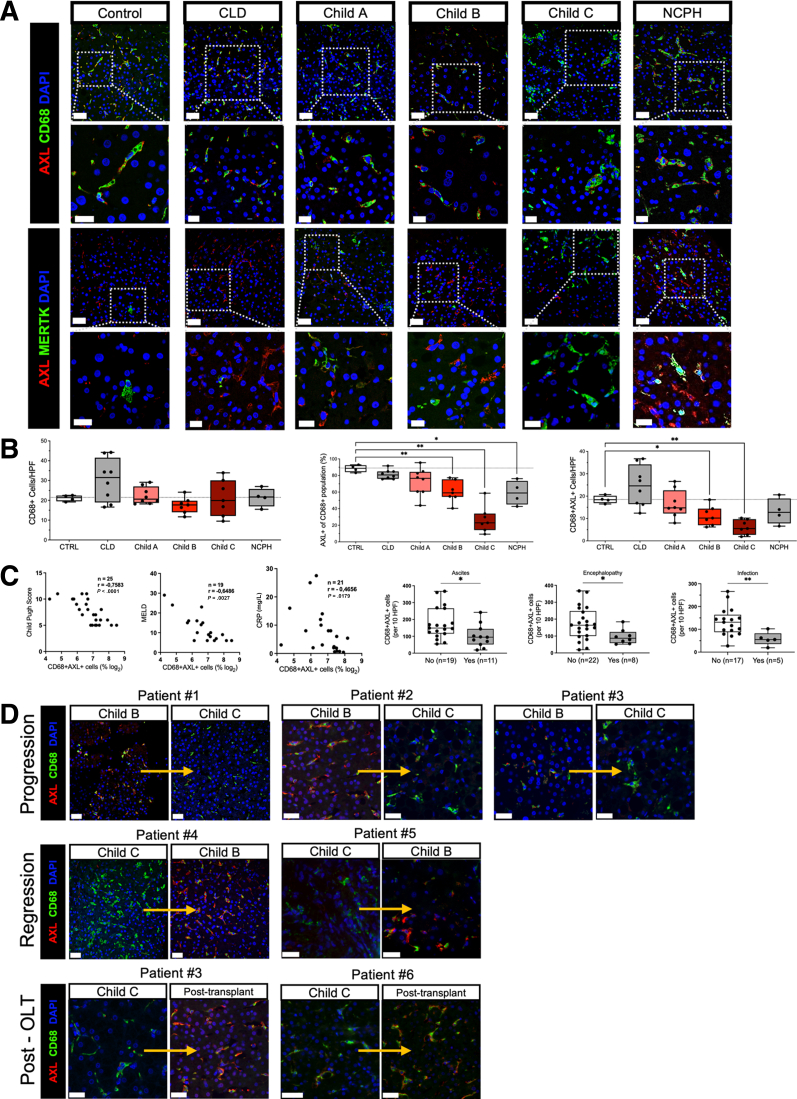
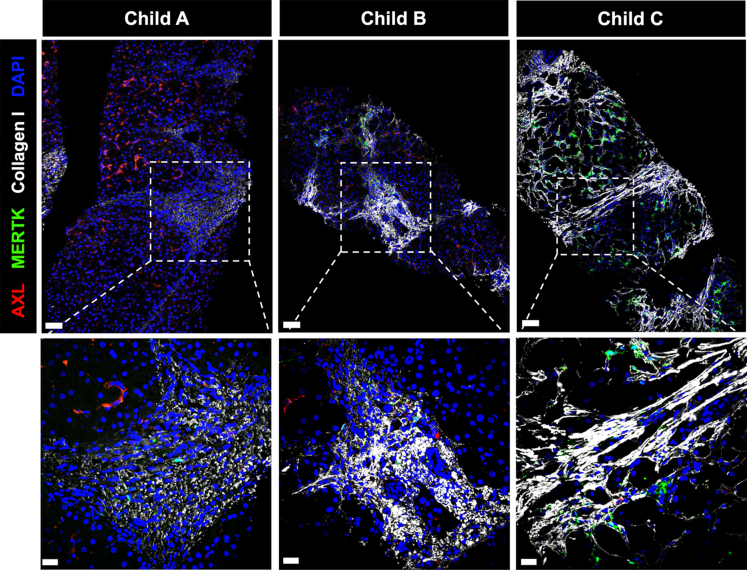
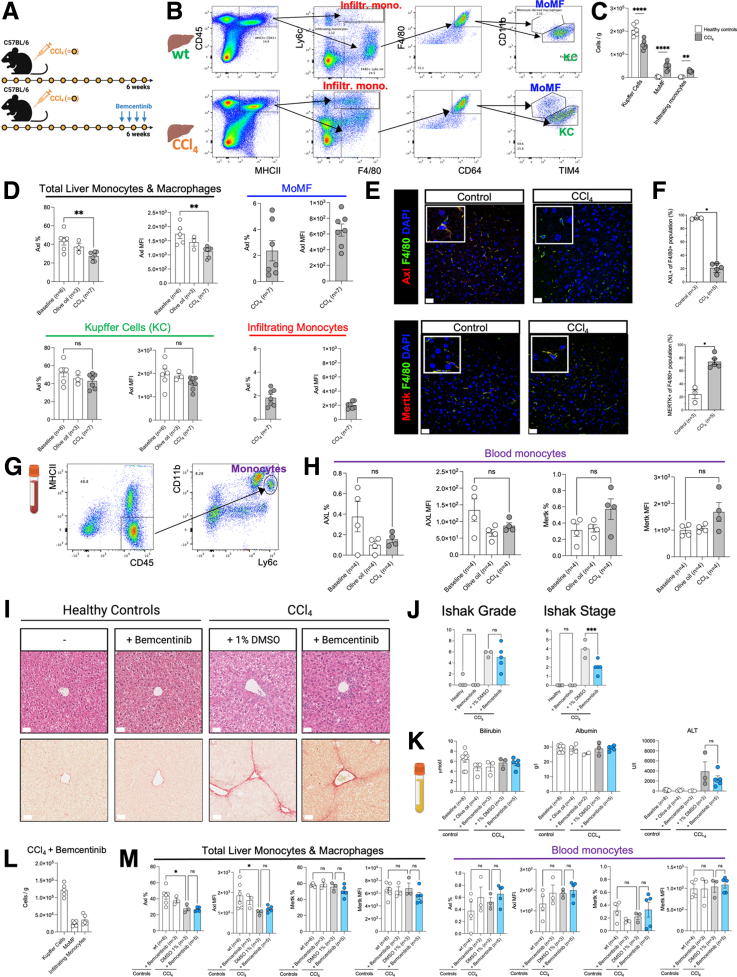
Results: AXL was expressed on resident (CD68+) but not tissue-infiltrating (MAC387+) liver macrophages, hepatocytes, HSCs, or sinusoidal endothelial cells. Prevalence of hepatic CD68+AXL+ cells significantly decreased with cirrhosis progression: (healthy, 90.2%; Child-Pugh A, 76.1%; Child-Pugh B, 64.5%; and Child-Pugh C, 18.7%; all P < .05) and negatively correlated with Model for End-Stage Liver Disease and C-reactive protein (all P < .05). AXL-expressing hepatic macrophages were CD68highHLA-DRhighCD16highCD206high. AXL expression also decreased on gut and peritoneal macrophages from cirrhotic patients but increased in regional lymph nodes. GAS6, enriched in the cirrhotic liver, appeared to be secreted by HSCs and down-regulate AXL in vitro.

Conclusions: Decreased AXL expression on resident liver macrophages in advanced cirrhosis, potentially in response to activated HSC-secreted GAS6, suggests a role for AXL in the regulation of hepatic immune homeostasis.

Keywords: Cirrhosis; Innate Immunity; Resident Liver Macrophages; TAM Receptors.


Figures

None
Graphical abstract
Figure 1
Figure 1
AXL is expressed on resident liver macrophages. Representative micrographs from immunofluorescence stains of liver biopsies from the control group (n = 4). (A) AXL/CD68/DAPI stain showing AXL expression on resident liver macrophages. (B) AXL/CD68/MAC387/DAPI stain showing absence of AXL expression on liver-infiltrating macrophages. (C) AXL/CD31+CD34+vWF/DAPI stain showing absence of AXL expression on LSECs. (D) AXL/α-SMA/DAPI stain of a control liver biopsy showing absence of AXL expression on aHSCs. Upper panels: original magnification, 400×; scale bar = 50 μm; lower panels: details, scale bar = 20 μm. AF594, red; AF488, green; AF647, white; DAPI, blue.
Figure 2
Figure 2
Loss of AXL-expressing resident liver macrophages with the progression of cirrhosis. (A) Representative immunofluorescence micrographs from AXL/CD68/DAPI and AXL/MERTK/DAPI stains of liver biopsies from the control group (n = 4), chronic liver disease (CLD) (n = 8), Child-Pugh A (n = 8), Child-Pugh B (n = 7), Child-Pugh C (n = 7), and NCPH (n = 4). Upper panels: original magnification, 400×; scale bar = 50 μm; lower panels: details, scale bar = 20 μm. (B) Cell count of CD68+ resident liver macrophages per HPF, AXL+ macrophages per HPF, and percentage of AXL+ cells of CD68+ population. (C) Correlations of AXL+ macrophages with Child-Pugh and MELD scores, C-reactive protein, encephalopathy, ascites, and infections. ∗P ≤ .05/∗∗P ≤ .01 (Mann-Whitney tests, Spearman correlation coefficients). (D) AXL/CD68/DAPI stain displaying longitudinal AXL expression on resident liver macrophages from patients undergoing either progression or regression or resolution of cirrhosis post transplantation (OLT). AF488, green; AF647, red; DAPI, blue; scale bar = 50 μm.
Figure 3
Figure 3
Reduced AXL expression in portal-septal areas. Representative micrographs from immunofluorescence stains of liver biopsies from patients with Child-Pugh A (left), Child-Pugh B (middle), and Child-Pugh C (right) cirrhosis. AXL/MERTK/collagen I/DAPI stain showing AXL and MERTK expression in relation to fibrotic areas; FITC, green; AF594, red; AF647, white; DAPI, blue; scale bar in upper panels = 50 μm, scale bar in lower panels = 20 μm.
Figure 4
Figure 4
Immunophenotyping by flow cytometry of liver macrophages. (A) Gating strategy with representative flow cytometry scatter plots. Side scatter area (SSC-A), forward scatter area (FSC-A). (B) Representative histograms for AXL expression on liver macrophages in control and compensated cirrhosis. (C) AXL expression on liver macrophages (%) in controls (n = 13) and compensated cirrhosis (n = 7). Box plots showing median with 10–90 percentile and all points min-max. ∗∗∗P ≤ .001 (Mann-Whitney test). (D) Scaffold reference map of the mixed control (n = 5, 2550 cells/sample) and compensated cirrhosis (n = 5, 2550 cells/sample) macrophages landscape constructed from fluorescence cytometry data displaying 25 unsupervised FlowSOM nodes in 5 clusters with representative fluorescent marker expression in the scaffold map. (E) Comparison of control (n = 5, 2550 cells/sample) and compensated cirrhosis (n = 5, 2550 cells/sample) macrophages representative fluorescent marker expression mapped in the scaffold map. (F) Immunophenotyping of control and compensated cirrhosis liver macrophages. Expression level as percentage of all macrophages and as median fluorescence intensity (MFI) of all macrophages. (G) Gating strategy and histograms for AXL expression used to distinguish AXL-expressing from AXL-negative liver macrophages. Immunophenotyping of AXL+ and AXL liver macrophages in controls (n = 13) and compensated cirrhosis (n = 7). Expression level as percentage (%) and MFI of all macrophages. Box plots showing median with 10–90 percentile and all points min-max. ∗P ≤ .05/∗∗P ≤ .01/∗∗∗P ≤ .001, Mann-Whitney and Wilcoxon test.
Figure 5
Figure 5
Phagocytosis of bacteria by primary liver macrophages and AXL on migrating monocyte. (A) Gating strategy for determination of bioparticle (E coli, S aureus) positive macrophages from liver resections based on 1% border of untreated control. FSC-A (forward scatter area). (B) E coli and S aureus bioparticle uptake by primary liver macrophages from controls (n = 8) and compensated cirrhosis samples (n = 5); untreated control (n = 8). In percentage and median fluorescence intensity (MFI) of macrophages. (C) AXL expression in percentage and MFI on E coli and S aureus bioparticle uptake on macrophages from controls (n = 8), compensated cirrhosis (n = 5), and untreated controls (n = 8). (D) Phagocytosis capacity for E coli and S aureus bioparticles of AXL+/AXL- liver macrophages in percentage and MFI of macrophages from control (n = 8) and compensated cirrhosis samples (n = 5) and untreated controls (n = 8). (E) AXL expression levels as percentage and MFI on magnetically sorted CD14+ monocytes from healthy donors in an established migration assay (n = 6). Box plots showing median with 10–90 percentile and all points min-max. ∗P ≤ .05, ∗∗P ≤ .01, Wilcoxon, Kruskal-Wallis, and Mann-Whitney test.
Figure 6
Figure 6
Prevalence of AXL expression on macrophages in gut, peritoneum, bone marrow, and lymph node. (A) Representative immunofluorescence micrographs from AXL/CD68/DAPI stains of gut biopsies from control group (n = 4), ulcerative colitis (UC) (n = 5), Child-Pugh A (n = 7), Child-Pugh B (n = 5), and Child-Pugh C (n = 4). (B) Percentage of AXL+ macrophages lining the epithelial barrier relative to total population per HPF. (C) Schematic drawing of liver vessels with blood flow indicated and soluble AXL (sAXL) levels (pg/mL) in blood from portal and hepatic veins (n = 8). (D) AXL and MERTK expression of peritoneal macrophages from cirrhosis patients (pMACs, n = 23) in classical (CD14+CD16, class), intermediate (CD14++CD16+, inter), and non-classical (CD14++CD16++, non-class) subsets and monocyte-derived macrophages (M0-MDMs). (E) Representative immunofluorescence micrographs from AXL/CD68/DAPI stains of a lymph node from explant patient (Child-Pugh C) and control in follicular (F) and non-follicular (NF) regions. (F) Representative micrograph from AXL/CD68/DAPI stains of bone marrow from explant patient (Child-Pugh C) and control. Box plots showing median with 10–90 percentile and all points min-max. ∗P ≤ .05/∗∗P ≤ .01, Mann-Whitney and Kruskal-Wallis test. AF594, red; AF488, green; AF647, white; DAPI, blue; scale bar = 50 μm.
Figure 7
Figure 7
Mechanism of AXL loss on resident liver macrophages. (A) GAS6 levels in liver tissue lysates and (B) protein percentage of liver tissue lysates assessed by bicinchoninic acid assay (BCA) from controls (n = 3), pathologic control (n = 3), and compensated cirrhosis liver resections (n = 6). (C) GAS6 levels in liver tissue in correlation with AXL expression on liver macrophages determined by flow cytometry (n = 12, Spearman r correlation). (D) α-SMA+GAS6+ cell numbers (immunofluorescence) in correlation with AXL expression on liver macrophages (flow cytometry) (n = 12, Spearman r correlation). (E) GAS6 levels in supernatants after 18 hours of liver macrophage cultures or co-cultures of liver macrophages and LX-2 cells (n = 3). (F) Representative immunofluorescence micrographs from α-SMA/AXL/DAPI stains of either liver resections from histologically normal livers (n = 6) or liver biopsies from patients with cirrhosis (Child-Pugh A, n = 6; Child-Pugh B, n = 8; Child-Pugh C, n = 7). AF594, red; AF488, green; DAPI, blue; original magnification, 400×; scale bar = 20 μm. (G) Cell count of α-SMA+ cells per 10 HPF in healthy controls and patients with cirrhosis. (H) Representative immunofluorescence micrographs from α-SMA/GAS6/DAPI stains of liver resections from histologically normal livers (n = 6), as well as liver biopsies and liver resections from patients with cirrhosis (Child-Pugh A, n = 7; Child-Pugh B, n = 3; Child-Pugh C, n = 2). AF647, red; AF488, green; DAPI, blue. Upper panels: original magnification, 400×; scale bar = 50 μm; lower panels: details, scale bar = 50 μm. (I) Cell count of α-SMA+ GAS6+ cells per 10 HPF in healthy controls and patients with cirrhosis. (J) AXL expression change in liver macrophages on either co-culture with LX-2 cells or GAS6 treatment (n = 3, technical triplicates); bar plots with standard deviation error, nested t tests. (K) Experimental setup for co-culture of healthy KCs with either healthy HSCs or cirrhotic HSCs in a transwell system and confirmatory flow cytometry analysis of sorted cells. (L) Flow cytometry analysis of either CD68+ KCs or α-SMA+ HSCs after co-culture experiment depicted in G (n = 1). Box plots showing median with 10–90 percentile and all points min-max. ∗P ≤ .05/∗∗P ≤ .01, Mann-Whitney and Kruskal-Wallis test.
Figure 8
Figure 8
Efficacy and safety of Axl inhibition in a carbon tetrachloride-induced liver fibrosis model. (A) Overview of carbon tetrachloride (CCl4) model involving biweekly administration of CCl4 (intraperitoneal 0.4 mL/kg) for 6 weeks and therapeutic immunomodulation with bemcentinib for 1 week every other day (intraperitoneal 100 mg/kg). (B) Flow cytometry gating strategies for liver cell subsets including infiltrating monocytes, monocyte-derived macrophages (MoMF), and Kupffer cells (KCs) in a wild-type (wt) and CCl4 mouse model. (C) Monocyte/macrophage cell numbers per gram of liver tissue in healthy controls and CCl4 model. (D) Flow cytometry analysis of Axl expression levels displayed as either % or median fluorescence intensity (MFI) on liver cell subsets identified in B. (E) Representative micrographs from either Axl/F4/80/DAPI stains or Mertk/F4/80/DAPI stains of mouse livers from healthy controls and CCl4-treated animals. (F) Percentage of either Axl-expressing macrophages or Mertk-expressing macrophages relative to total population (mean per mouse). (G) Flow cytometry gating strategy for blood monocytes. (H) Flow cytometry analysis of either Axl or Mertk expression levels displayed as % or MFI on blood monocytes identified in G. (I) Representative images of hematoxylin-eosin stainings (above) and Sirius Red stainings (below) of FFPE liver sections from either healthy controls or CCl4-treated mice with or without bemcentinib treatment. (J) Liver necroinflammation score (Ishak grade) and liver fibrosis score (Ishak stage) based on histopathology analysis of H&E and Sirius Red stainings. (K) Plasma levels of bilirubin, albumin, and alanine aminotransferase (ALT) assessed with a clinical chemistry analyzer. (L) Cells per gram of liver tissue from CCl4-treated mice after administration of bemcentinib. (M) Axl and Mertk (% and MFI values) on either liver monocytes/macrophages or blood monocytes assessed with flow cytometry analysis. ns = not significant/∗P < .05/∗∗P < .01, unpaired t tests and one-way ordinary analysis of variance. AF594, red; AF488, green; DAPI, blue; scale bar = 50 μm.

References

    1. Balmer M.L., Slack E., Gottardi A de, et al. The liver may act as a firewall mediating mutualism between the host and its gut commensal microbiota. Sci Transl Med. 2014;6 - PubMed
    1. Bernsmeier C., van der Merwe S., Périanin A. Innate immune cells in cirrhosis. J Hepatol. 2020;73:186–201. - PubMed
    1. Albillos A., Lario M., Álvarez-Mon M. Cirrhosis-associated immune dysfunction: distinctive features and clinical relevance. J Hepatol. 2014;61:1385–1396. - PubMed
    1. Wiest R., Lawson M., Geuking M. Pathological bacterial translocation in liver cirrhosis. J Hepatol. 2014;60:197–209. - PubMed
    1. Stengel S., Quickert S., Lutz P., et al. Peritoneal level of CD206 associates with mortality and an inflammatory macrophage phenotype in patients with decompensated cirrhosis and spontaneous bacterial peritonitis. Gastroenterology. 2020;158:1745–1761. - PubMed

Publication types

Substances