. 2023 Jun:72:101717.
doi: 10.1016/j.molmet.2023.101717. Epub 2023 Mar 31.

Aryl hydrocarbon receptor maintains hepatic mitochondrial homeostasis in mice

Affiliations

Aryl hydrocarbon receptor maintains hepatic mitochondrial homeostasis in mice

Mi Jeong Heo et al. Mol Metab. 2023 Jun.

Abstract

Objective: Mitophagy removes damaged mitochondria to maintain cellular homeostasis. Aryl hydrocarbon receptor (AhR) expression in the liver plays a crucial role in supporting normal liver functions, but its impact on mitochondrial function is unclear. Here, we identified a new role of AhR in the regulation of mitophagy to control hepatic energy homeostasis.

Methods: In this study, we utilized primary hepatocytes from AhR knockout (KO) mice and AhR knockdown AML12 hepatocytes. An endogenous AhR ligand, kynurenine (Kyn), was used to activate AhR in AML12 hepatocytes. Mitochondrial function and mitophagy process were comprehensively assessed by MitoSOX and mt-Keima fluorescence imaging, Seahorse XF-based oxygen consumption rate measurement, and Mitoplate S-1 mitochondrial substrate utilization analysis.

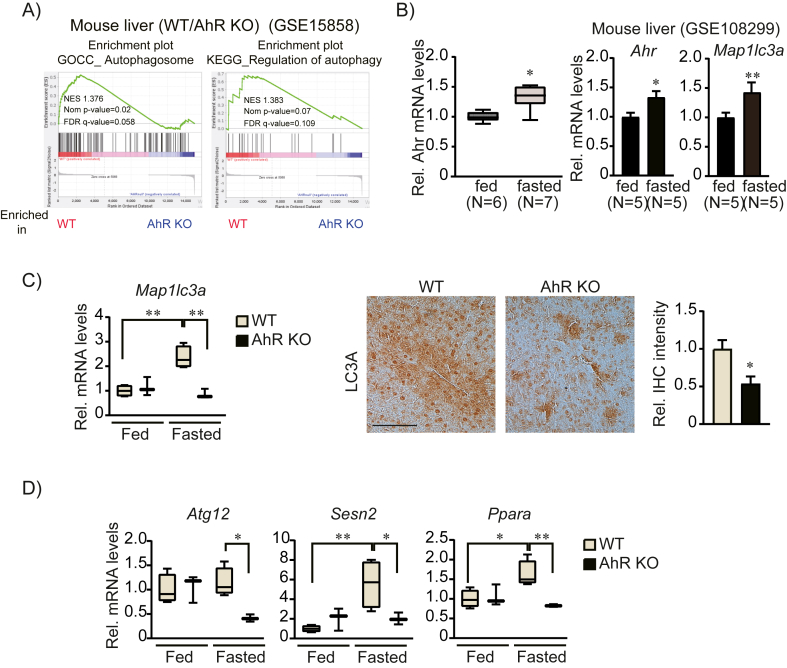
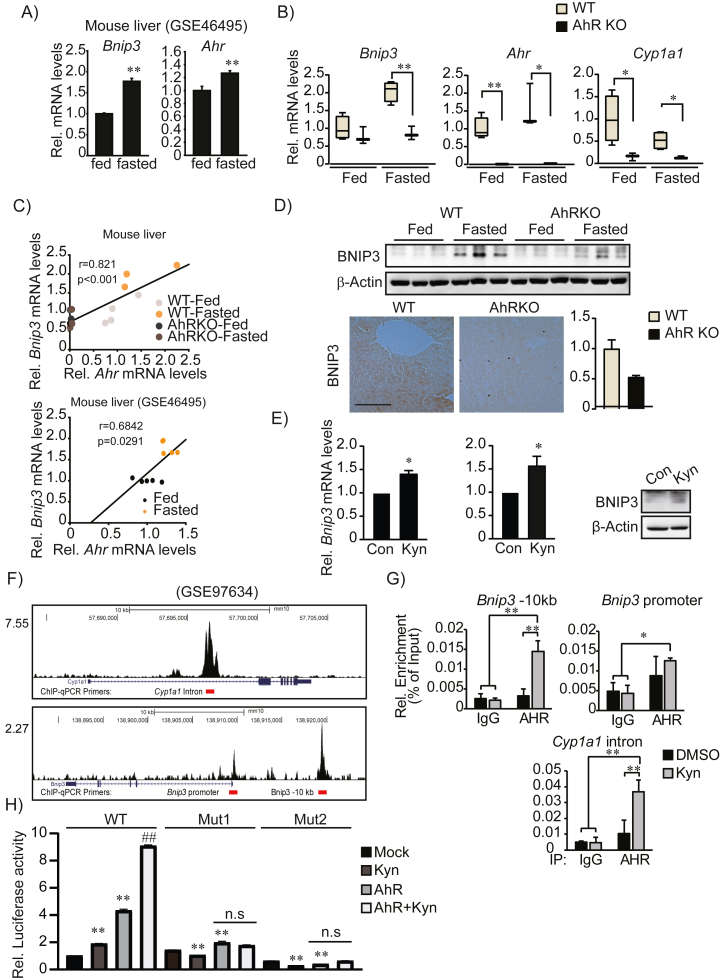
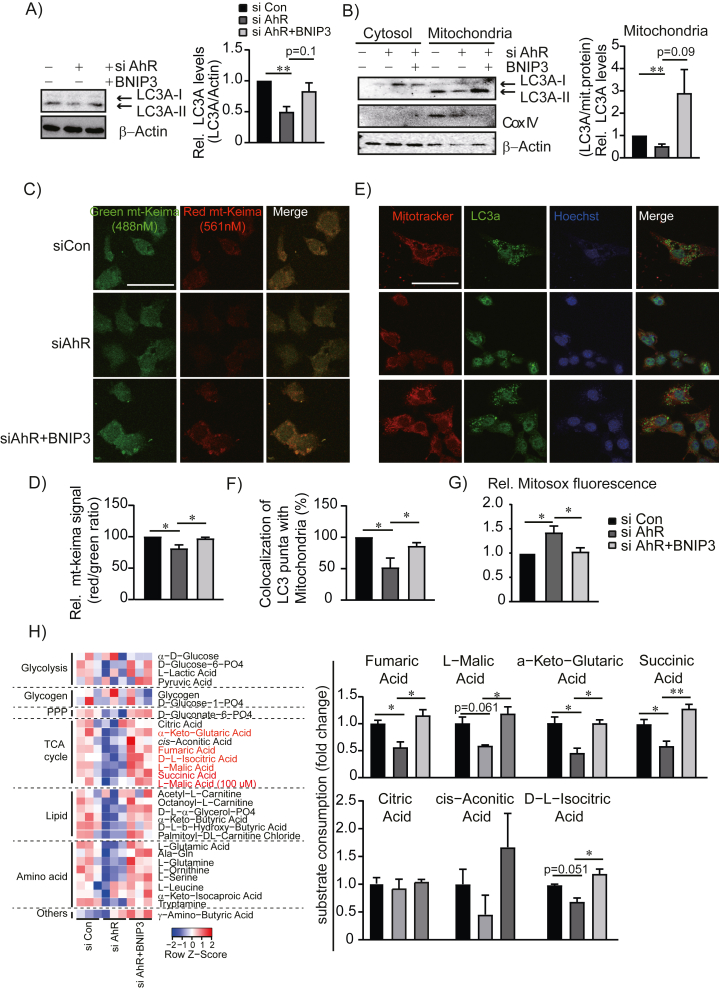
Results: Transcriptomic analysis indicated that mitochondria-related gene sets were dysregulated in AhR KO liver. In both primary mouse hepatocytes and AML12 hepatocyte cell lines, AhR inhibition strongly suppressed mitochondrial respiration rate and substrate utilization. AhR inhibition also blunted the fasting response of several essential autophagy genes and the mitophagy process. We further identified BCL2 interacting protein 3 (BNIP3), a mitophagy receptor that senses nutrient stress, as an AhR target gene. AhR is directly recruited to the Bnip3 genomic locus, and Bnip3 transcription was enhanced by AhR endogenous ligand treatment in wild-type liver and abolished entirely in AhR KO liver. Mechanistically, overexpression of Bnip3 in AhR knockdown cells mitigated the production of mitochondrial reactive oxygen species (ROS) and restored functional mitophagy.

Conclusions: AhR regulation of the mitophagy receptor BNIP3 coordinates hepatic mitochondrial function. Loss of AhR induces mitochondrial ROS production and impairs mitochondrial respiration. These findings provide new insight into how endogenous AhR governs hepatic mitochondrial homeostasis.

Keywords: Autophagy; BNIP3; Kynurenine; Mitophagy; Reactive oxygen species.


Figures

Image 1
Graphical abstract
Figure 1
Figure 1
Decreased mitochondrial gene signatures in AhR KO. (A) Gene ontology analyses of AhR KO liver treated with TCDD (GSE15858). Down-regulated genes (fold change >1.5, p-value < 0.05) in AhR KO livers were further analyzed for the enrichment of biological process (upper), cellular component (middle), and molecular function (lower) using David bioinformatics software. Top 5 terms in each category were shown. (B) Gene set enrichment analysis of AhR KO liver with TCDD treatment (GSE10082). Enrichment plots are shown enriched signaling pathways in WT (left) and AhR KO (right) livers with TCDD treatment.
Figure 2
Figure 2
Mitochondrial dysfunction by AhR inhibition. (A) OCRs in mouse primary hepatocytes from WT or AhR KO mice. Real-time readings (upper) and indicated rates of oxygen consumption (lower) are shown (n = 4 each, four to six replicates per group for each experiment). (B) Mitochondrial superoxide level was quantified by MitoSOX™ in siCon or siAhR transfected AML12 cells. (C) Mitoplate S-1 assay to measure substrate-specific mitochondrial function. AML12 cells were transfected with siCon or siAhR for 48h. The change in metabolic rate for each substrate/imtermediate of mitochondrial/glycolytic pathways is shown as a heatmap (upper) and significantly changed substrates for the TCA cycle were shown as a bar graph (lower). Data represented the mean ± SEM, ∗p < 0.05, ∗∗p < 0.01. PPP; pentose phosphate pathway.
Figure 3
Figure 3
Attenuated autophagy gene expressions by AhR inhibition. (A) Gene set enrichment analysis of autophagosome and regulation of autophagy gene sets in AhR KO livers. (B) The mRNA level of Ahr and autophagy marker Map1lc3a in the GEO dataset (GSE108299) and our real-time PCR (n = 6 or 7). Data represented the mean ± SEM, ∗p < 0.05, ∗∗p < 0.01. (C) The mRNA levels of Map1lc3a in WT and AhR KO livers during feeding and fasting (left, n = 3 or 4). Immunohistochemical analysis of LC3a (middle) in the fasted liver and quantification of LC3a expression (right) by Image J. Representative liver sections were shown (n = 3 each). Scale bar, 100 μm. (D) Gene expression analysis of autophagy-related genes in WT and AhR KO livers during feeding and fasting. (B)–(D), data were shown as box and whisker plots. Box, interquartile range (IQR); whiskers, min to the max; and horizontal line within box, median, ∗p < 0.05, ∗∗p < 0.01.
Figure 4
Figure 4
Inhibition of mitophagy by AhR inhibition. (A) Reduced autophagy marker LC3A in the mitochondrial fraction. AML12 cells were transfected with siCon or siAhR for 48 h. Then, the cytosolic and mitochondrial fraction was separately isolated for LC3A immunoblotting. Tom20 was used as a mitochondrial marker. (B) Direct assessment of mitophagy using mt-Keima plasmid. AML12 cells were transfected with siCon or siAhR along with mt-Keima for 48h. Green fluorescence represented normal mitochondria (pH 8.0), whereas red fluorescence displayed mitochondria in an acidic condition (pH 4.5) in the lysosome compartment. Representative images are presented. Scale bar, 50 μm. (C) Co-staining of mitochondria (Mitotracker) and lysosome (Lysotracker) markers in AML12 cells transfected with siCon or siAhR. Representative images are presented. Scale bar, 50 μm. (B) and (C), fluorescence intensities were quantified by ImageJ.
Figure 5
Figure 5
Direct regulation of Bnip3 transcription by AhR. (A) The mRNA level of Bnip3 and Ahr in the GEO dataset (GSE46495) during fed and fasted conditions. (n = 5, each). (B) Expression levels of Bnip3, Ahr, and Cyp1a1 in fed and fasted livers of WT or AhR KO mice (n = 3 or 4). Data were shown as box and whisker plots. Box, interquartile range (IQR); whiskers, min to the max; and horizontal line within box, median, ∗p < 0.05, ∗∗p < 0.01. (C) Pearson's correlation between Ahr and Bnip3 mRNA levels. (D) BNIP3 protein levels in fed and fasted livers of WT and AhR KO mice (upper) and IHC for BNIP3 in fasted livers (lower, left). Representative images were shown (n = 3 each). Scale bar, 100 μm. The quantification of BNIP3 expression (lower, right) was measured by Image J. (E) Increased BNIP3 expression by endogenous AhR ligand, kynurenine (Kyn) treatment (100 μM, 24 h) in mouse primary hepatocyte (left) and AML12 cells (middle and right). (F) AhR recruitment to the Bnip3 genomic locus in TCDD-treated liver (GSE97634). (G) ChIP-PCR analysis of AhR binding to Bnip3 genomic locus. (H) Reporter assays using the pGL3-basic vector containing WT ARE or Mutated ARE. HEK293 cells transfected with mock or AhR overexpression vector together with the reporter vector and treated Kyn for 24h. Results was normalized to WT control. (D), (E), (G) and (H), Data represented the mean ± SEM, ∗p < 0.05, ∗∗p < 0.01. (H), ## was compared to AhR overexpressed group.
Figure 6
Figure 6
Restored mitophagy by BNIP3 overexpression. (A) Changes of LC3A protein levels by Bnip3 overexpression in AhR knockdown cells. AML12 cells were co-transfected with siCon, siAhR, or siAhR with Bnip3-overexpressing plasmids. Band intensities represent values relative to siCon. (B) Changes of mitochondria-associated LC3A levels. Cytosolic and mitochondrial fractions were subjected to Western blotting. Cox IV was used for the control of mitochondrial fraction. (C) and (D) Visualization of mitophagy using mt-Keima assay and quantification. (E) Dual staining of mitochondria (Mitotracker) and autophagy marker (LC3A). Representative images are presented. Scale bar, 50 μm. (F) Quantification of colocalization of LC3A with mitotracker. (G) Mitochondrial superoxide levels measured by MitoSOX™ in AML12 cells transfected with siCon, siAhR, or siAhR with Bnip3 overexpression plasmids. (H) Mitoplate S-1 assay to measure mitochondrial substrate utilization. AML12 cells were transfected with siCon, siAhR, or siAhR with Bnip3-overexpressing plasmids for 48 h. The change in metabolic rate for each substrate/intermediate of mitochondrial/glycolytic pathways was shown in a heatmap (left) and change of substrate utilization in TCA cycle were shown as a bar graph (right). (A),(B), (D–H), Data represented the mean ± SEM, ∗p < 0.05, ∗∗p < 0.01. PPP; pentose phosphate pathway.

References

    1. Ma K., Chen G., Li W., Kepp O., Zhu Y., Chen Q. Mitophagy, mitochondrial homeostasis, and cell fate. Front Cell Dev Biol. 2020;8:467. - PMC - PubMed
    1. Gao A.W., Canto C., Houtkooper R.H. Mitochondrial response to nutrient availability and its role in metabolic disease. EMBO Mol Med. 2014;6:580–589. - PMC - PubMed
    1. Mehrabani S., Bagherniya M., Askari G., Read M.I., Sahebkar A. The effect of fasting or calorie restriction on mitophagy induction: a literature review. J Cachexia Sarcopenia Muscle. 2020;11:1447–1458. - PMC - PubMed
    1. Ding W.X., Yin X.M. Mitophagy: mechanisms, pathophysiological roles, and analysis. Biol Chem. 2012;393:547–564. - PMC - PubMed
    1. Onishi M., Yamano K., Sato M., Matsuda N., Okamoto K. Molecular mechanisms and physiological functions of mitophagy. EMBO J. 2021;40 - PMC - PubMed

Publication types