. 2023 Apr 1;14(1):1829.
doi: 10.1038/s41467-023-37459-z.

Parabacteroides distasonis ameliorates hepatic fibrosis potentially via modulating intestinal bile acid metabolism and hepatocyte pyroptosis in male mice

Affiliations

Parabacteroides distasonis ameliorates hepatic fibrosis potentially via modulating intestinal bile acid metabolism and hepatocyte pyroptosis in male mice

Qi Zhao et al. Nat Commun. .

Abstract

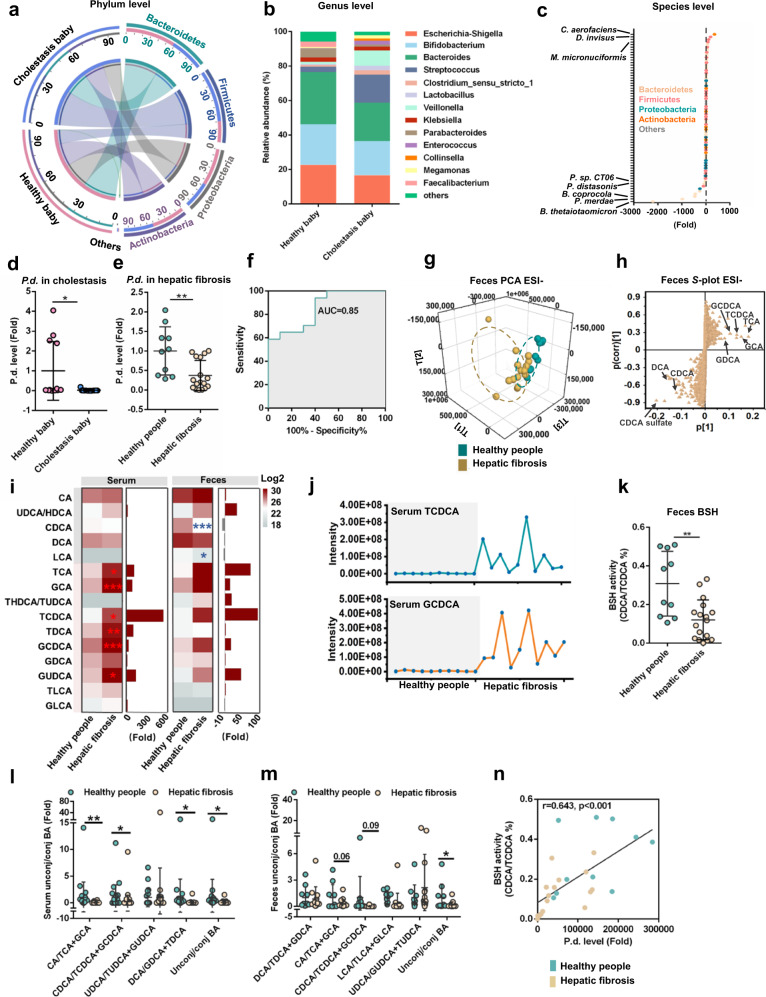
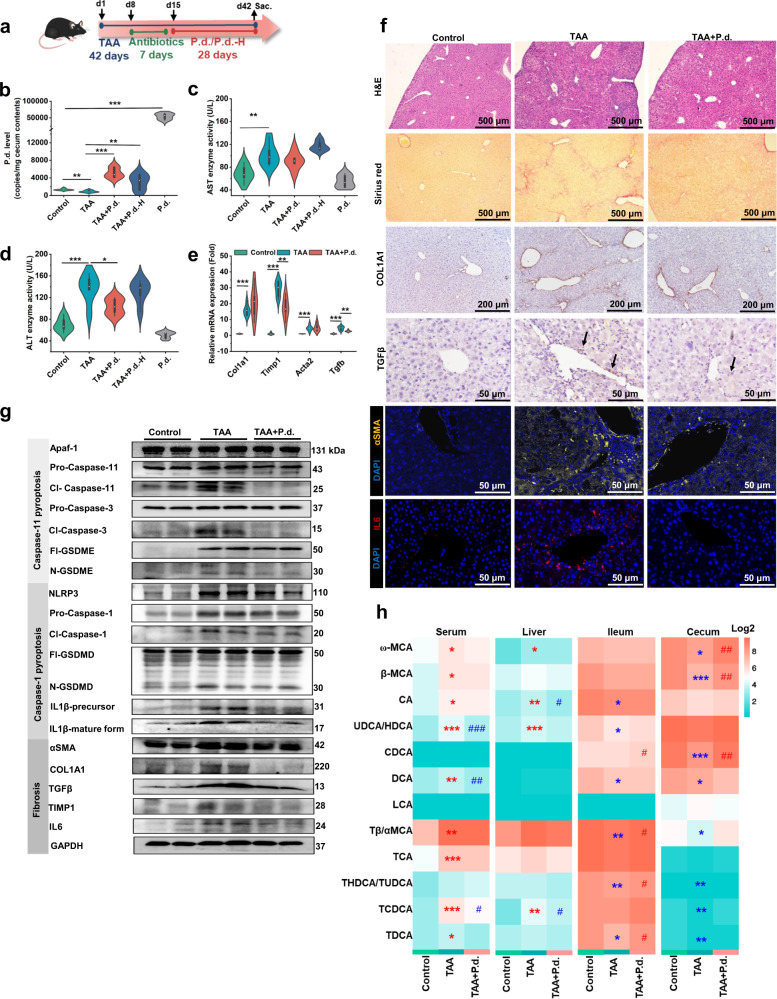
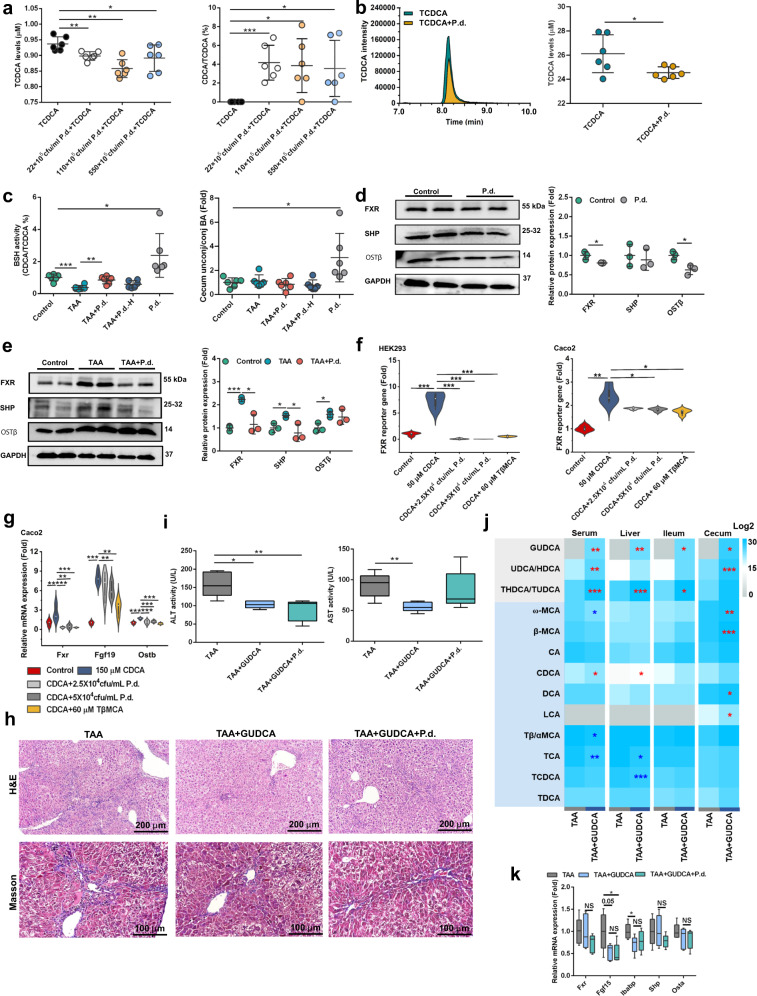
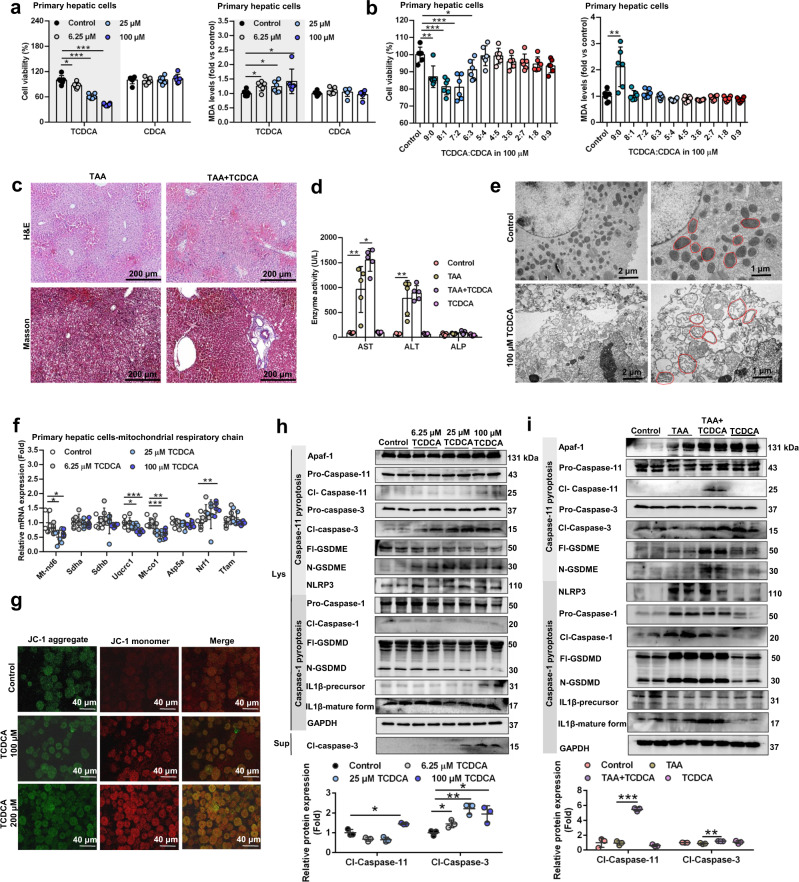
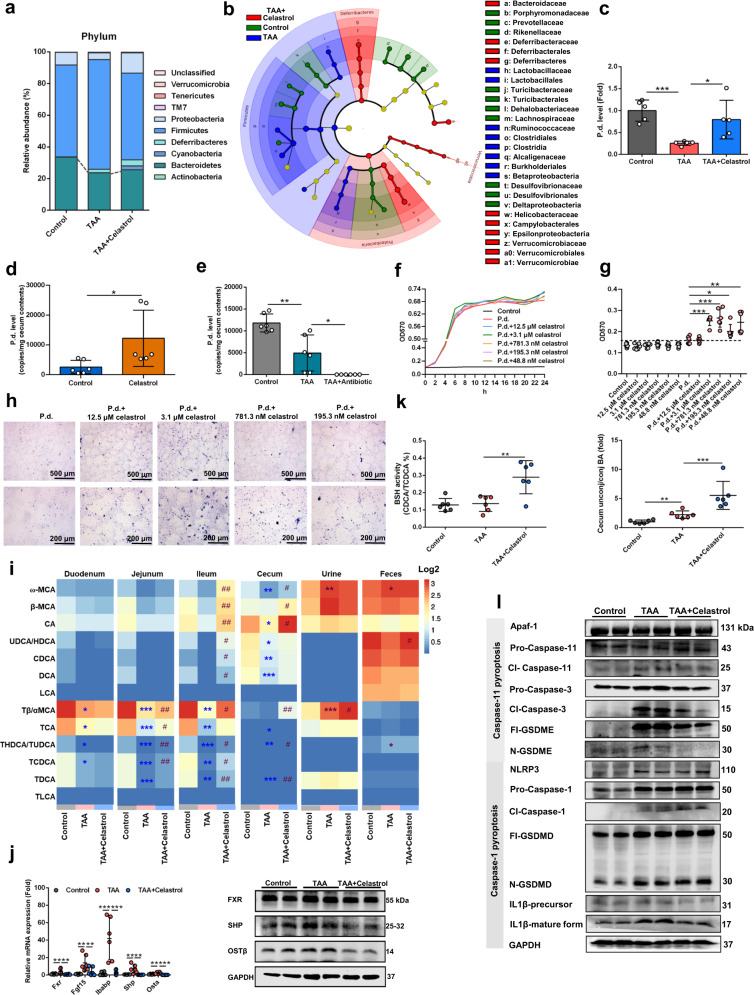
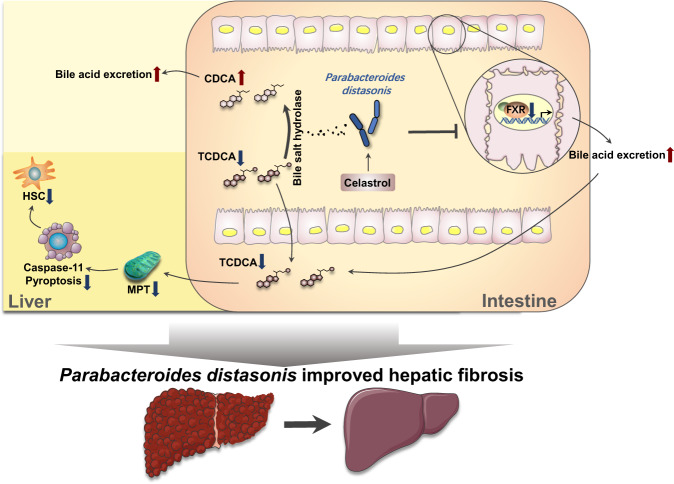
Parabacteroides distasonis (P. distasonis) plays an important role in human health, including diabetes, colorectal cancer and inflammatory bowel disease. Here, we show that P. distasonis is decreased in patients with hepatic fibrosis, and that administration of P. distasonis to male mice improves thioacetamide (TAA)- and methionine and choline-deficient (MCD) diet-induced hepatic fibrosis. Administration of P. distasonis also leads to increased bile salt hydrolase (BSH) activity, inhibition of intestinal farnesoid X receptor (FXR) signaling and decreased taurochenodeoxycholic acid (TCDCA) levels in liver. TCDCA produces toxicity in mouse primary hepatic cells (HSCs) and induces mitochondrial permeability transition (MPT) and Caspase-11 pyroptosis in mice. The decrease of TCDCA by P. distasonis improves activation of HSCs through decreasing MPT-Caspase-11 pyroptosis in hepatocytes. Celastrol, a compound reported to increase P. distasonis abundance in mice, promotes the growth of P. distasonis with concomitant enhancement of bile acid excretion and improvement of hepatic fibrosis in male mice. These data suggest that supplementation of P. distasonis may be a promising means to ameliorate hepatic fibrosis.


Conflict of interest statement

The authors declared no conflict of interest.

Figures

Fig. 1
Fig. 1. Cholestasis and hepatic fibrosis patients decrease P. distasonis levels and BSH activity.
ad Relative abundance of phylum (a), genus (b), species (c) and P. distasonis (d) in the feces of healthy babies (n = 12) and cholestatic babies (n = 13). c Different phylum was showed with different color, and negative number showed a decreased fold in cholestatic babies and a positive number showed the increased fold. P.d., P. distasonis. e P. distasonis levels in the feces of healthy subjects (n = 10) and hepatic fibrosis patients (n = 17). f ROC curve analysis of P. distasonis levels in healthy people (n = 10) and hepatic fibrosis patients (n = 17). ROC curves are used to determine diagnostic efficiency using the area under curve (AUC). The range of AUC is between 0.5 and 1. An AUC of 1.0 would indicate perfect prediction and 0.5 would indicate poor prediction. g Principal component analysis (PCA) score plot for the feces metabolome of healthy people (n = 10) and hepatic fibrosis patients (n = 17) detected in ESI-. Each point represented a sample. h Bile acids were labeled in the loading plot for feces metabolome in hepatic fibrosis patients. Conjugated bile acids (e.g., taurochenodeoxycholic acid (TCDCA) and glycochendeoxycholic acid (GCDCA)) were increased, and the unconjugated bile acid chenodeoxycholic acid (CDCA) was decreased in feces of hepatic fibrosis patients. i Serum and feces bile acid target analysis was shown by heatmap in hepatic fibrosis patients. Red color shows higher bile acid levels and gray color shows lower bile acid levels. Heatmap plots were generated by log2 transformation of data. The fold changes are also shown with bar graphs. For serum samples, healthy people n = 25, hepatic fibrosis n = 62; for feces samples, healthy people n = 10, hepatic fibrosis n = 17. j Trending plot of TCDCA and GCDCA in serum of healthy people (n = 10) and hepatic fibrosis patients (n = 10). k Bile salt hydrolase (BSH) activity in healthy people (n = 10) and hepatic fibrosis patients (n = 17). l Unconjugated/(glycine conjugated+taurine conjugated) bile acid ratio in the serum of healthy people (n = 25) and hepatic fibrosis patients (n = 62). BA, bile acid. m Unconjugated/(glycine conjugated+taurine conjugated) bile acid ratios in the feces of healthy people (n = 10) and hepatic fibrosis patients (n = 17). BA, bile acid. n Correlation analysis between P. distasonis levels and BSH activity in healthy people (n = 10) and hepatic fibrosis patients (n = 17). Correlation analysis was performed using Spearman’s rank tests. Data are presented as the mean ± SD. *P < 0.05, **P < 0.01, ***P < 0.001. Source data are provided as a Source Data file.
Fig. 2
Fig. 2. P. distasonis improves thioacetamde (TAA)-induced hepatic fibrosis in mice.
a Experimental scheme: mice were treated with 200 mg/kg TAA for 6 weeks. After TAA treatment for 1 week, the mice were treated with antibiotics (ampicillin, neomycin, metronidazole, and vancomycin) for 1 week. After antibiotics treatment, 2 × 108 CFU P. distasonis (P.d.) and heat-killed P. distasonis (P.d.-H) were given by oral transplantation once a day for 4 weeks. n = 6 per group. b Copies of P. distasonis in mouse cecum content. c, d Serum AST (c) and ALT (d) enzyme activities. e Hepatic fibrosis gene expression in mouse liver. *P < 0.05, **P < 0.01, ***P < 0.001. f Hepatic H&E, Sirius red, immunohistochemistry (COL1A1 and TGFβ) and immunofluorescence (αSMA and IL6) stainings. H&E staining showed inflammatory infiltration, Sirius red showed increased hepatic fibrosis, immunohistochemistry, and immunofluorescence showed increased COL1A1, TGFβ, αSMA, and IL6 protein expressions in TAA-induced hepatic fibrosis. g Caspase-11 pyroptosis pathway (Apaf-1-Caspase-11-Caspase-3-GSDME), Caspase-1 pyroptosis pathway (NLRP3-Caspase-1-GSDMD/IL1β) and hepatic fibrosis (αSMA, COL1A1, TGFβ and TIMP1) protein expression in mouse liver. Cl-Caspase-1/3/11, N-GSDME/GSDMD, and IL1β-mature form were the active forms of the proteins. h P. distasonis improved bile acid levels in the enterohepatic circulation (serum, liver, ileum, and cecum content) in the Control, TAA, and TAA + P.d. groups. Red color shows higher bile acid levels and green color shows lower bile acid levels. Heatmap plots were generated by log2 transformation of data. *P < 0.05, **P < 0.01, ***P < 0.001 verse Control group; #P < 0.05, ##P < 0.01, ###P < 0.001 verse TAA group. For the violin plot (be), boxplots represent median with the interquartile range, whiskers indicate adjacent values, violin represents kernel density estimation. Source data are provided as a Source Data file.
Fig. 3
Fig. 3. P. distasonis increases BSH activity and inhibits ileal FXR signaling.
a LC-MS analysis revealed that P. distasonis promoted the conversion of from taurochenodeoxycholic acid (TCDCA) to chenodeoxycholic acid (CDCA) in culture medium. 22–550 × 105 CFU/mL P. distasonis was co-cultured with 25 μM TCDCA in brain-heart infusion fluid medium under anaerobic conditions for 24 h (n = 6 biologically independent samples). b BSH activity in P. distasonis protein (P. distasonis protein was extracted from living P. distasonis culture medium using sonication. TCDCA was co-incubated with the protein in 3 mM sodium acetate buffer and then CDCA was generated from TCDCA through the BSH activity. TCDCA and CDCA levels were measured by LC-MS (n = 6 biologically independent samples)). c P. distasonis transplantation increased BSH activity and increased cecum content unconjugated/conjugated bile acids in mice. Mice were treated as in Fig. 2a. BA, bile acid; P.d., P. distasonis; P.d.-H, heat-killed P. distasonis. n = 6 per group. d, e P. distasonis decreased ileal farnesoid X receptor (FXR) and its downstream (SHP and OSTβ) protein expression in healthy mice (d) and in TAA-induced hepatic fibrosis mice (e). Mice were treated as in Fig. 2a (n = 3 for dot plot). f Luciferase assays of the inhibition of FXR in HEK293 and Caco-2 cells using P. distasonis and the FXR inhibitor TβMCA with FXR agonist CDCA co-treatments. HEK293 and Caco-2 cells were treated with 50 μM CDCA, 2.5–5 × 104 CFU/mL P. distasonis, and 60 μM TβMCA for 24 h (n = 4 biologically independent cells). g P. distasonis decreased Fxr and its target gene (Fgf19 and Ostβ) mRNAs in Caco-2 cells. Caco-2 cells were treated with 150 μM CDCA, 2.5–5 × 104 CFU/mL P. distasonis, and 60 μM TβMCA for 24 h (n = 6 biologically independent cells). For violin plots f, g, boxplots represent median with the interquartile range, whiskers indicate adjacent values, violin represents kernel density estimation. h Hepatic H&E staining (top) and Masson trichrome staining (bottom) after GUDCA treatment in mice. Mice were treated with TAA (200 mg/kg) for 6 weeks, GUDCA (50 mg/kg), and P. distasonis (2 × 108 CFU) for 5 weeks (n = 5). H&E staining showed increased inflammatory infiltration, and Masson trichrome staining showed increased hepatic fibrosis in TAA-induced hepatic fibrosis. i Serum AST and ALT enzyme activities after GUDCA treatment. Mice were treated as in h (n = 5). j Serum, liver, ileum, and cecum content bile acid levels after GUDCA treatment. Blue color showed higher bile acid levels and gray color showed lower bile acid levels. Heatmap plots were generated by log2 transformation of data. Mice were treated as in h. k Ileal FXR target gene expression. Mice were treated as in h (n = 5). In box plot (i, k), the center line indicates the median, the edges of the box represent the first and third quartiles, and the whiskers extend to span a 1.5 interquartile range from the edges. Data are presented as the mean ± SD. *P < 0.05, **P < 0.01, ***P < 0.001. Source data are provided as a Source Data file.
Fig. 4
Fig. 4. TCDCA potentiates hepatic fibrosis through MPT-Caspase-11 pyroptosis.
a Cell viability and MDA levels after 6.25–100 μM TCDCA and 6.25–100 μM CDCA treatments in mouse primary hepatic cell for 24 h (n = 6 biologically independent cells). BSH activity transformes TCDCA to CDCA, and therefore the toxicity of TCDCA and CDCA was evaluated. TCDCA taurochenodeoxycholic acid, CDCA chenodeoxycholic acid. b TCDCA had higher toxicity than CDCA in primary hepatic cells. 100 μM TCDCA and 100 μM CDCA were mixed in the proportion of 9:0, 8:1, 7:2, 6:3, 5:4, 4:5, 3:6, 2:7, 1:8, 0:9 to simulate the gradually increased BSH activity. Then primary hepatic cells were treated with the mixture for 24 h (n = 6 biologically independent cells). c Hepatic H&E staining (top) and Masson trichrome staining (bottom) after TCDCA (200 mg/kg) treatment for 5 days and TAA (300 mg/kg) treatment for 1 day (n = 5). H&E staining showed increased inflammatory infitration, and Masson trichrome staining showed increased hepatic fibrosis in the TAA + TCDCA group. d Serum AST, ALT, and ALP enzyme activities after TAA and TCDCA co-treatments. Mice were treated as in c (n = 5). e Representative images of electron microscopy analysis of pyroptosis morphology changes in primary hepatic cells. Cells were stimulated with 100 μM TCDCA for 24 h. Mitochondrial morphologies were marked with red lines. f Mitochondrial respiratory chain gene expression in primary hepatic cell. Cells were stimulated with 6.25–100 μM TCDCA for 24 h (n = 6 biologically independent cells). g JC-1 staining of primary hepatic cells after 100–200 μM TCDCA treatment for 24 h. Confocal microscopy was used, and green fluorescence represented JC-1 aggregates in healthy mitochondria, while red fluorescence represented mitochondrial membrane potential collapse. TCDCA increased red fluorescence and induced mitochondrial damage. h Caspase-11 apoptosis pathway (Apaf-1-Caspase-11-Caspase-3-GSDME) and Caspase-1 pyroptosis pathway (NLRP3-Caspase-1-GSDMD/IL1β) protein expression after 6.25–100 μM TCDCA treatment for 24 h in lysates (Lys) and supernatants (Sup) of mouse primary hepatic cells. Cl-Caspase-1/3/11, N-GSDME/GSDMD, and IL1β-mature form were the active forms of the proteins (n = 3 for dot plot). i Hepatic Caspase-11 and Caspase-1 pyroptosis pathway protein expression in mice. Mice were treated as in c (n = 3 for dot plot). Data are presented as the mean ± SD. *P < 0.05, **P < 0.01, ***P < 0.001. Source data are provided as a Source Data file.
Fig. 5
Fig. 5. TCDCA activates HSC through increasing the MPT-Caspase-11 pyroptosis pathway in hepatocytes and HSCs.
a Experimental scheme: MPT-Caspase-11 pyroptosis pathway (Apaf-1-Caspase-11 in mice (Caspase-4 in human)-Caspase-3-GSDME) was activated by TCDCA in hepatocytes and HSC; The increased Caspase-4 protein activated human HSC, released hepatic fibrosis protein αSMA and TGFβ, and finally induced hepatic fibrosis. HSC, hepatic stellate cells. b Images of microscope analysis of pyroptotic morphology changes in mouse hepatocyte and human HSC (LX2). Mouse hepatocytes were treated with 100 μM TCDCA for 6 h, and human LX2 were treated with 100 μM TCDCA for 15 min. c, d Caspase-11 pyroptosis was induced after 6 h (c) and 24 h (d) TCDCA (6.25–100 μM) treatment in primary hepatocytes (n = 6 biologically independent cells). e, f Caspase-11 pyroptosis was induced by 48 h TCDCA (6.25–100 μM) treatment in mice (e) and human (f) HSCs (n = 6 biologically independent cells). In the box plot (cf), the center line indicates the median, the edges of the box represent the first and third quartiles, and the whiskers extend to span a 1.5 interquartile range from the edges. g, h Cell viability (g) and Caspase-11 pyroptosis gene expression (h) after MPT agonist lonidamine (10 μM, 100 μM and 1 mM) and TCDCA (100 μM) co-treatments for 24 h in mouse primary hepatocytes (n = 6 biologically independent cells). i, j Cell viability (i) and Caspase-11 pyroptosis gene expression (j) after MPT antagonist BKA (200 nM) and TCDCA (100 μM) co-treatments for 24 h in mouse primary hepatocytes (n = 6 biologically independent cells). km Cell viability (k), MDA level (l), and Caspase-11 pyroptosis gene mRNA expression (m) after wedelolactone (Caspase-11 inhibitor, 1, 10, and 100 μM) and TCDCA (100 μM) treatments for 24 h in mouse primary hepatocytes (n = 6 biologically independent cells). For violin plot (gm), boxplots represent median with the interquartile range, whiskers indicate adjacent values, violin represents kernel density estimation. n, o Hepatic fibrosis and Caspase-4 pyroptosis mRNA (n n = 6 biologically independent cells) and protein (o n = 3 for bar graph) expression after 1–2 U/mL Caspase-4 protein treatment for 24 h. p αSMA immunofluorescence showed that 0.5 U/mL Caspase-4 protein treatment for 24 h induced the expression of αSMA in LX2 cells. Data are presented as the mean ± SD. *P < 0.05, **P < 0.01, ***P < 0.001. Source data are provided as a Source Data file.
Fig. 6
Fig. 6. Celastrol protects against TAA-induced hepatic fibrosis through increasing P. distasonis level.
ac Celastrol increased Bacteroidetes (a phylum), Bacteroidaceae (b family), and P. distasonis (c species) in cecum content of mice (n = 5 biologically independent animals). Mice were treated with 200 mg/kg TAA for 6 weeks and 10 mg/kg celastrol for 5 weeks. b Red, green, blue showed the increased bacteria in the TAA + Celastrol group, control group, and TAA group, respectively. d P. distasonis was increased in cecum content after 10 mg/kg celastrol treatment for 2 weeks in healthy mice (n = 6 biologically independent animals). e Antibiotics decreased P. distasonis levels in TAA-induced hepatic fibrosis. Mice were treated with 200 mg/kg TAA for 6 weeks and antibiotics (ampicillin, neomycin, metronidazole, and vancomycin) for 5 weeks (n = 6 biologically independent animals). f Growth curve of P. distasonis after treatment with 48.8 nM–12.5 μM celastrol for 24 h in anaerobic incubator (n = 3). The original concentration of P. distasonis was 22 × 105 CFU/mL. g, h Biofilm formation of P. distasonis was shown by OD value (g) and microscopy (h) stained with crystal violet (n = 6 biologically-independent samples). Cells were treated as in f. *P < 0.05, **P < 0.01, ***P < 0.001. i Bile acid levels in enterohepatic circulation (duodenum, jejunum, ileum, cecum content, urine and feces). Red color shows higher bile acid levels and blue color shows lower bile acid levels. Heatmap plots were generated by log2 transformation of data. Mice were treated as in ac. n = 5 per group. *P < 0.05, **P < 0.01, ***P < 0.001 verse Control group; #P < 0.05, ##P < 0.01 verse TAA group. j Celastrol decreased ileal Fxr mRNA (n = 6 biologically independent animals) and FXR protein expression after 10 mg/kg celastrol treatment for 5 weeks. k 10 mg/kg celastrol (5 weeks) increased BSH activity and increased cecum content unconjugated/conjugated bile acids in mice (n = 6 biologically independent animals). l Hepatic Caspase-11 pyroptosis pathway (Apaf-1-Caspase-11-Caspase-3-GSDME) and Caspase-1 pyroptosis pathway (NLRP3-Caspase-1-GSDMD/IL1β) protein expression after TAA and celastrol treatments. Cl-Caspase-1/3/11, N-GSDME/GSDMD, and IL1β-mature form were the active form of the proteins. Data are presented as the mean ± SD. *P < 0.05, **P < 0.01, ***P < 0.001. Source data are provided as a Source Data file.
Fig. 7
Fig. 7. P. distasonis improves MCD diet-induced hepatic fibrosis through increasing BSH activity and decreasing ileal FXR.
a Experimental scheme: mice were treated with MCD diet for 6 weeks. After MCD diet treatment for 1 week, mice were treated with antibiotics (ampicillin, neomycin, metronidazole, and vancomycin) for 1 week. After antibiotics treatment, 2 × 108 CFU P. distasonis (P.d.) and heat-killed P. distasonis (P.d.-H) were given by oral transplantation once a day for 4 weeks (n = 6). b Hepatic H&E, Oil red O, Masson trichrome, immunohistochemistry (COL1A1 and TGFβ) and immunofluorescence (αSMA and IL6) stainings. H&E and IL6 immunofluorescence stainings showed increased inflammatory infiltration, Oil red O staining showed increased lipopexia, and Masson trichrome, immunohistochemistry (COL1A1 and TGFβ), and immunofluorescence (αSMA) stainings revealed increased hepatic fibrosis in MCD diet-induced hepatic fibrosis. c, d Serum AST (c) and ALT (d) enzyme activity. e Hepatic fibrosis gene expression. f, g Hepatic Caspase-11 pyroptosis pathway (Apaf-1-Caspase-11-Caspase-3-GSDME), Caspase-1 pyroptosis pathway (NLRP3-Caspase-1-GSDMD/IL1β), and hepatic fibrosis protein expression in mice. Cl-Caspase-1/3/11, N-GSDME/GSDMD, and IL1β-mature form were active form of the protein. *P < 0.05, **P < 0.01, ***P < 0.001. h Bile acid levels in enterohepatic circulation (serum, ileum, and cecum content). Red color shows higher bile acid levels and blue color shows lower bile acid levels. Heatmap plots were generated by log2 transformation of data. *P < 0.05, **P < 0.01, ***P < 0.001 verse MCS group; #P < 0.05, ##P < 0.01 verses MCD group. i Hepatic Caspase-11 pyroptosis gene expression. j BSH activity in cecum content. k, l Ileal FXR protein expression. For violin plots, dotted line represent median with the interquartile range, violin represents kernel density estimation. *P < 0.05, **P < 0.01, ***P < 0.001. Source data are provided as a Source Data file.
Fig. 8
Fig. 8. P. distasonis improves hepatic fibrosis through increasing BSH activity and inhibiting ileal FXR.
(1) Increased BSH activity by P. distasonis transformed TCDCA to CDCA. (2) Inhibition of ileal FXR by P. distasonis decreased the reabsorption of bile acids in intestine and finally decreased bile acids (e.g., TCDCA) in serum and liver. The increased BSH activity and the inhibited ileal FXR signaling by P. distasonis decreased TCDCA in serum and liver. TCDCA activated HSC through MPT-Caspase-11 pyroptosis pathway, and finally induced hepatic fibrosis.

References

    1. Paik JM, Golabi P, Younossi Y, Mishra A, Younossi ZM. Changes in the global burden of chronic liver diseases from 2012 to 2017: the growing impact of NAFLD. Hepatology. 2020;72:1605–1616. doi: 10.1002/hep.31173. - DOI - PubMed
    1. Liu Y, et al. Probiotic lactobacillus rhamnosus GG prevents liver fibrosis through inhibiting hepatic bile acid synthesis and enhancing bile acid excretion in mice. Hepatology. 2020;71:2050–2066. doi: 10.1002/hep.30975. - DOI - PMC - PubMed
    1. Liu Y, et al. Protective effects of Selenium-enriched probiotics on carbon tetrachloride-induced liver fibrosis in rats. J. Agric. Food Chem. 2015;63:242–249. doi: 10.1021/jf5039184. - DOI - PubMed
    1. Grander C, et al. Recovery of ethanol-induced Akkermansia muciniphila depletion ameliorates alcoholic liver disease. Gut. 2018;67:891–901. doi: 10.1136/gutjnl-2016-313432. - DOI - PubMed
    1. Xu RY, Wan YP, Fang QY, Lu W, Cai W. Supplementation with probiotics modifies gut flora and attenuates liver fat accumulation in rat nonalcoholic fatty liver disease model. J. Clin. Biochem. Nutr. 2012;50:72–77. doi: 10.3164/jcbn.11-38. - DOI - PMC - PubMed

Publication types

Supplementary concepts