. 2023 Apr 1;14(1):1830.
doi: 10.1038/s41467-023-37453-5.

MAIT cell inhibition promotes liver fibrosis regression via macrophage phenotype reprogramming

Affiliations

MAIT cell inhibition promotes liver fibrosis regression via macrophage phenotype reprogramming

Morgane Mabire et al. Nat Commun. .

Abstract

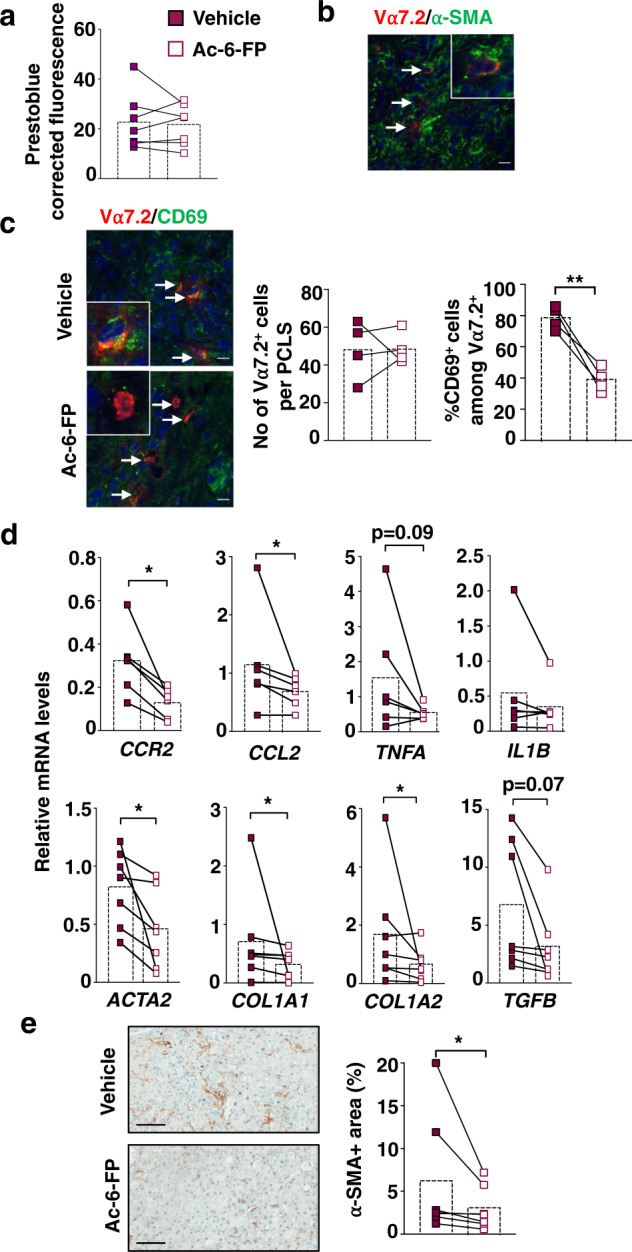
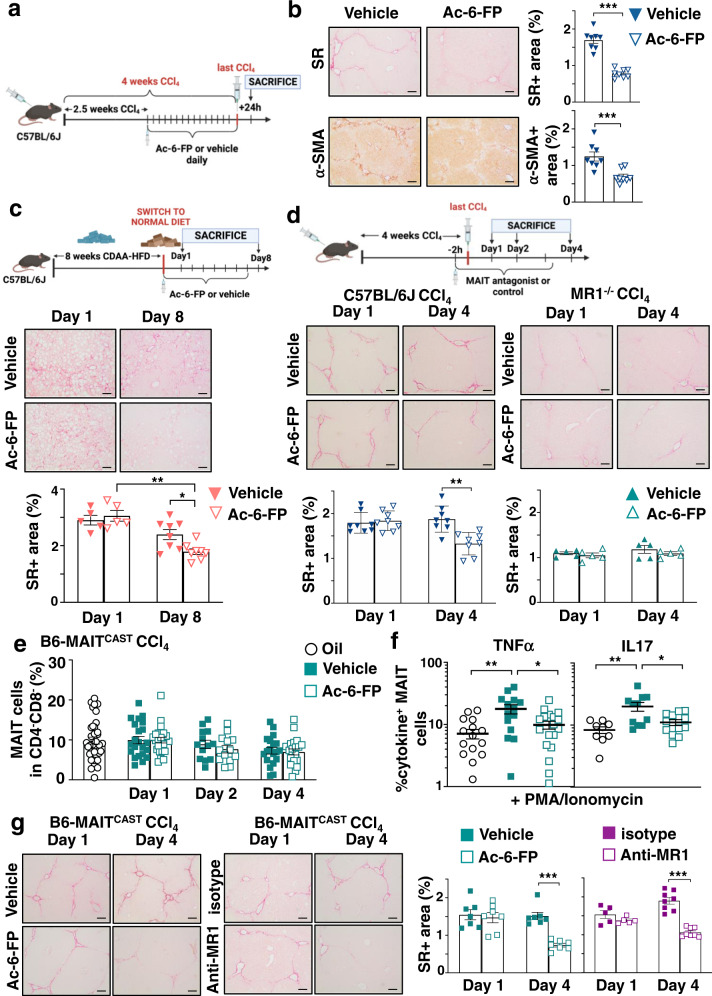
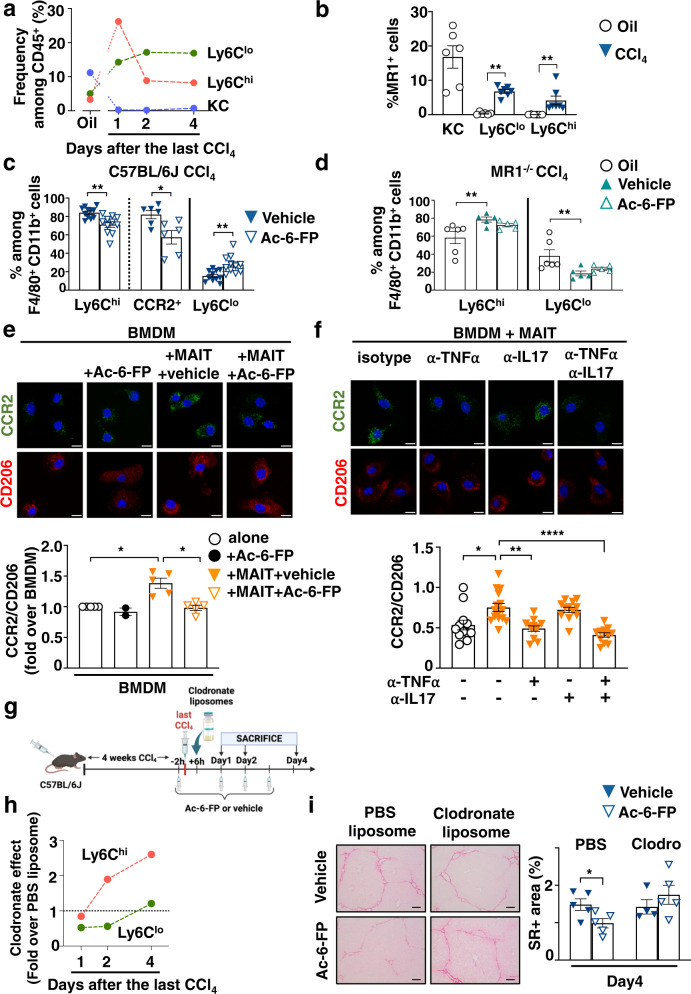
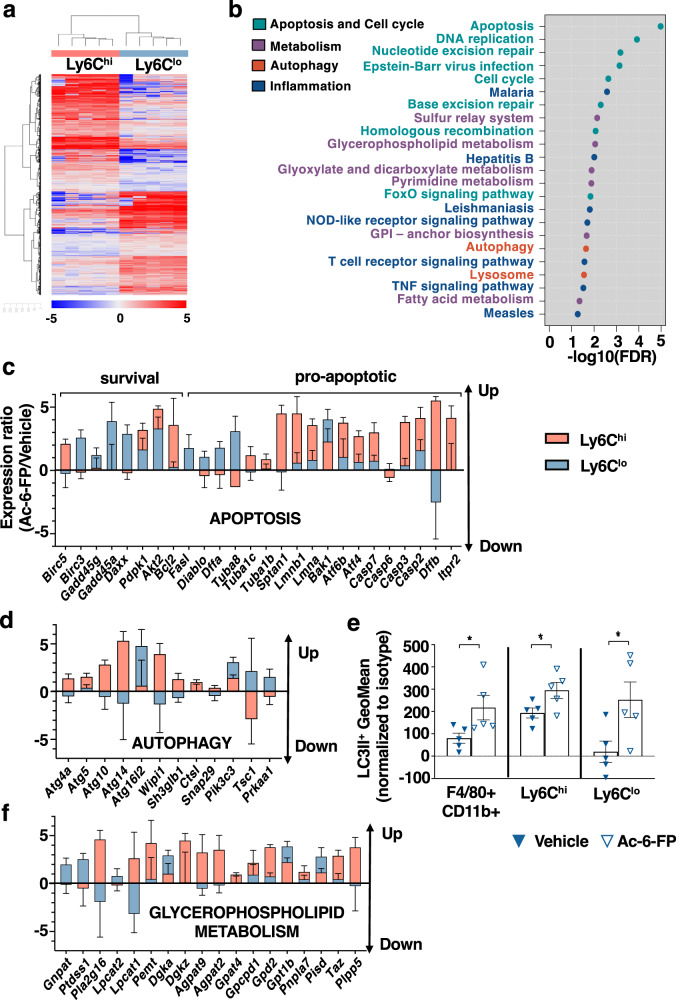
Recent data have shown that liver fibrosis can regress even at later stages of cirrhosis and shifting the immune response from pro-inflammatory towards a resolutive profile is considered as a promising option. The immune regulatory networks that govern the shift of the inflammatory phenotype and thus potential reversal of liver fibrosis are lesser known. Here we show that in precision-cut human liver slices obtained from patients with end-stage fibrosis and in mouse models, inhibiting Mucosal-Associated Invariant T (MAIT) cells using pharmacological or antibody-driven approaches, limits fibrosis progression and even regresses fibrosis, following chronic toxic- or non-alcoholic steatohepatitis (NASH)-induced liver injury. Mechanistic studies, combining RNA sequencing, in vivo functional studies (performed in male mice) and co-culture experiments indicate that disruption of the MAIT cell-monocyte/macrophage interaction results in resolution of fibrosis both by increasing the frequency of restorative Ly6Clo at the expenses of pro-fibrogenic Ly6Chi monocyte-derived macrophages and promoting an autophagic phenotype in both subsets. Thus, our data show that MAIT cell activation and the consequential phenotype shift of liver macrophages are important pathogenic features of liver fibrosis and could be targeted by anti-fibrogenic therapy.


Conflict of interest statement

All authors declare no competing interests.

Figures

Fig. 1
Fig. 1. Ex vivo exposure of PCLS from patients with chronic liver injury to the MR1-blocking ligand Ac-6-FP decreases the expression of inflammatory and fibrogenic genes.
Human PCLS were incubated with 10 µM Ac-6-FP or its vehicle for 48 h. a PCLS viability was assayed using PrestoBlue™ Cell Viability assay by fluorescence. b MAIT cell localization was evaluated by immunofluorescent co-staining of Vα7.2 and α-SMA. A representative image of two experiments is shown. c Representative images and quantification of Vα7.2+ cell number per PCLS and %CD69 + Vα7.2+ activated cells. Results are expressed as % of CD69+Vα7.2+/total Vα7.2+ cells. Each point is the mean value per PCLS. d Expression of inflammatory and fibrogenic genes in PCLS normalized to housekeeping gene PPIA. e Representative images of α-SMA immunostaining on liver tissue sections from those cirrhotic patients and respective quantifications of positive areas. a, d, e n = 7 patients (see Table 1 Group 1) except for CCR2, TNFA, and IL1B where expression was not detected for one patient. c Experiments were performed on four patients (see Table 1 Group 2) using two-tailed paired t test (**p = 0.006). d, e *p < 0.05 by two-tailed Wilcoxon matched-pairs signed rank test. Bars show the mean. Scale bar is 10 µm for b, c and 100 µm for e. Source data are provided as a Source Data file.
Fig. 2
Fig. 2. Inhibition of MAIT cell activation blocks liver fibrosis progression and promotes fibrosis regression.
a Timeline of the CCl4-induced fibrosis progression protocol in C57BL/6 J mice. b Representative images and quantification of Sirius red (SR; ***p = 0.0002) and α-SMA-positive areas (***p = 0.0006) in liver tissue sections (n = 8 mice/group). c Timeline of the CDAA-HFD-induced fibrosis regression protocol in C57BL/6 J mice. Representative images and quantification of Sirius red areas in liver tissue sections at day 1 (n = 5 mice/group) and day 8 (n = 8 mice/group). *p = 0.02; **p = 0.0016. d Timeline of the CCl4-induced fibrosis regression protocol in C57BL/6 J and MR1−/− mice. Representative images and quantification of Sirius red areas in liver tissue sections from C57BL/6 J (n = 8 mice/group) and MR1−/− mice (n = 5 mice/group) at days 1 and 4. **p = 0.002. e Flow cytometry analysis of CD4CD8GFP+ MAIT cell frequency in CCl4-exposed B6-MAITCAST mice injected with Ac-6-FP or vehicle (pooled data from three experiments n = 22 mice in vehicle group and 25 mice in Ac-6-FP group at day 1; n = 13 mice/group at day 2; n = 19 mice for vehicle and 21 mice for Ac-6-FP at day 4). Oil-injected mice served as control (pooled data from 7 experiments n = 36 mice). f Intracellular staining of CD4CD8GFP+ MAIT cells for TNFα and IL17 after 4 h intrahepatic leukocyte stimulation with PMA/ionomycin and Brefeldin A. Pooled data from 3 experiments for TNFα at day 1 (n = 16 mice for oil, n = 14 mice for vehicle and n = 18 mice for Ac-6-FP; *p = 0.04, **p = 0.003), and from 2 experiments for IL17 (n = 9 for oil, n = 11 for vehicle and n = 12 for Ac-6-FP; *p = 0.03, **p = 0.004). g Representative images and quantification of Sirius red areas in liver tissue sections from B6-MAITCAST congenic mice daily injected either with Ac-6-FP or vehicle (n = 7 mice/group; ***p = 0.0006), anti-MR1 or isotype (n = 5 mice/group at day 1, n = 8 at day 4; ***p = 0.0002). a, c, d Timelines of injections were created with BioRender® software. Representative images were taken at ×10 magnification. Scale bar is 100 µm. Data are mean ± S.D. Statistical analysis was performed by two-tailed Mann–Whitney test. SR sirius red, CDAA-HFD choline-deficient l-amino-acid defined high-fat diet, PMA phorbol 12-meristate 13-acetate. Source data are provided as a Source Data file.
Fig. 3
Fig. 3. Ac-6-FP promotes fibrosis resolution via an impact on the MAIT macrophage dialog.
ad Mice were injected CCl4 or oil for 4 weeks along the protocol described in Fig. 2d and frequencies of resident Kupffer cells (KC) and MoMac analyzed after cessation of injury. a Frequency of intrahepatic KC, Ly6Clo and Ly6Chi MoMac in C57BL/6 J. Each point is the mean of five mice except for oil where n = 13 mice. b Frequencies of MR1+ cells among KC, Ly6Clo and Ly6Chi MoMac at day 1 after CCl4 cessation (n = 7 mice/group) vs oil (n = 6 mice/group). **p = 0.001. c Frequencies of Ly6Chi, Ly6Clo (pooled data from two experiments, n = 11 mice/group), and CCR2+ (n = 6 mice/group) MoMac from C57BL/6 J mice at day 1 after the last CCl4 injection. *p = 0.01, **p = 0.002. d Frequencies of Ly6Chi and Ly6Clo from MR1−/− mice exposed to Ac-6-FP or vehicle, at day 1 after CCl4 cessation (n = 5 mice/group) compared to oil (n = 6). **p = 0.009. e, f Representative images of immunofluorescent staining of CD206 and CCR2 and quantification of the CCR2/CD206 mean intensity ratio in BMDM alone or co-cultured with MAIT cells for 48 h in the presence of e Ac-6-FP or vehicle (n = 5 experiments except for BMDM + Ac-6-FP where n = 2; each point represent the mean per experiment; *p = 0.02 for BMDM + MAIT vs BMDM alone, and *p = 0.04 for BMDM + MAIT + Ac-6-FP vs BMDM + MAIT + vehicle), or f antibodies to TNFα and/or IL17 or control isotype (typical representative of two experiments; each point is one field; n = 12 fields/group except for BMDM + MAIT + isotype where n = 15 fields). *p = 0.02; **p = 0.002; ****p < 0.0001. Scale bar is 10 µm. g Timeline of CCl4, Ac-6-FP and clodronate or PBS liposome administration in C57BL/6 J mice created with BioRender® software. h Clodronate vs PBS liposome fold change of Ly6Chi and Ly6Clo MoMac frequencies at day 1, 2, and 4 after CCl4 cessation. Each point represents the mean value of 5 mice for day 1 and day 2, and 4 mice for day 4. i Representative images and quantification of Sirius red areas (typical representative of n = 4 experiments) of liver tissue sections from mice treated with Ac-6-FP or vehicle (n = 5 mice/group except for vehicle clodronate group where n = 4 mice). Sample were collected 4 days after the last CCl4 injection. Scale bar is 100 µm. *p = 0.05. Data are mean ± S.D. Statistical analysis was performed by (bd, i) two-tailed Mann–Whitney test or (e, f) Kruskal–Wallis followed by Dunn’s multiple comparisons post-test. KC Kupffer cells, BMDM bone marrow-derived macrophages, clodro clodronate-encapsulated liposomes, PBS phosphate-buffered saline-encapsulated liposomes. Source data are provided as a Source Data file.
Fig. 4
Fig. 4. Blocking MAIT cell activation impacts on the Ly6Chi vs Ly6Clo macrophage signature.
a Heatmap of the 2687 genes with a significant (p ≤ 0.05, paired t test) difference in the ratio of Ly6Chi Ac-6-FP/vehicle and Ly6Clo Ac-6-FP/vehicle and a fold change ≥ 1.5. Clustering used Euclidean distance and Ward.D2 agglomeration method. b Top KEGG pathways from the enrichment analysis based on the 2687 genes with a significant difference in the ratio of Ly6Chi Ac-6-FP/vehicle vs Ly6Clo Ac-6-FP/vehicle. KEGG pathways are ordered by −log10(FDR). c Ac-6-FP/mean vehicle ratios in Ly6Chi (red) and Ly6Clo (blue) for selected genes from Apoptosis (mmu04210) and d Autophagy (mmu04140) KEGG pathways. e Geometric Mean of LC3II-positive cells in total macrophages (F4/80 + CD11b + ; *p = 0.03) and Ly6Chi and Ly6Clo (*p = 0.05) macrophages sorted from C57BL/6 J mice either injected Ac-6-FP or its vehicle. Statistical analyses were performed using two-tailed Mann–Whitney test. f Ac-6-FP/mean vehicle ratios in Ly6Chi (red) and Ly6Clo (blue) for selected genes from Glycerophospholipid metabolism (mmu00564). cf Experiments were performed on n = 5 mice/group. Data are presented as mean values ± S.E.M. Up upregulated genes, Down downregulated genes. Source data are provided as a Source Data file.

References

    1. Marcellin P, et al. Regression of cirrhosis during treatment with tenofovir disoproxil fumarate for chronic hepatitis B: a 5-year open-label follow-up study. Lancet. 2013;381:468–475. doi: 10.1016/S0140-6736(12)61425-1. - DOI - PubMed
    1. Friedman SL, Pinzani M. Hepatic fibrosis 2022: Unmet needs and a blueprint for the future. Hepatology. 2022;75:473–488. doi: 10.1002/hep.32285. - DOI - PubMed
    1. Mallat A, Lotersztajn S. Cellular mechanisms of tissue fibrosis. 5. Novel insights into liver fibrosis. Am. J. Physiol. Cell Physiol. 2013;305:C789–C799. doi: 10.1152/ajpcell.00230.2013. - DOI - PubMed
    1. Kisseleva T, Brenner D. Molecular and cellular mechanisms of liver fibrosis and its regression. Nat. Rev. Gastroenterol. Hepatol. 2021;18:151–166. doi: 10.1038/s41575-020-00372-7. - DOI - PubMed
    1. Seki E, Schwabe RF. Hepatic inflammation and fibrosis: functional links and key pathways. Hepatology. 2015;61:1066–1079. doi: 10.1002/hep.27332. - DOI - PMC - PubMed

Publication types