. 2023 Apr 1;13(1):5366.
doi: 10.1038/s41598-023-32524-5.

Heat denaturation enables multicolor X10-STED microscopy

Affiliations

Heat denaturation enables multicolor X10-STED microscopy

Kim Ann Saal et al. Sci Rep. .

Abstract

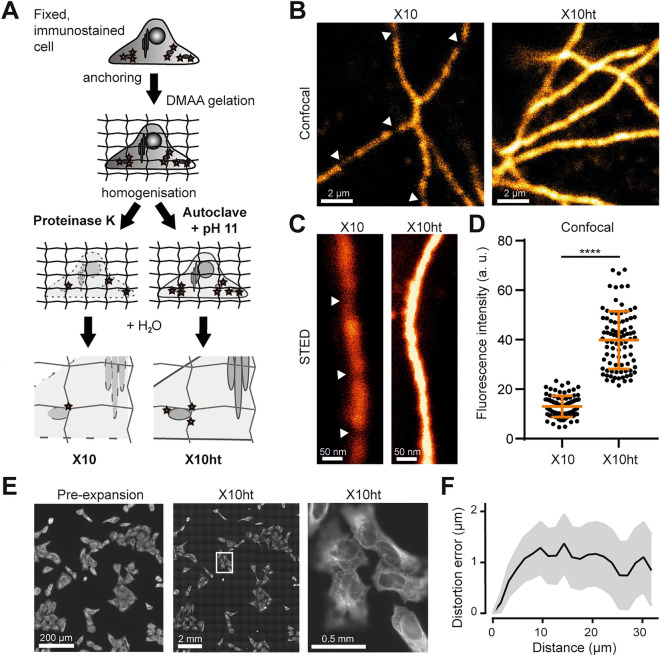
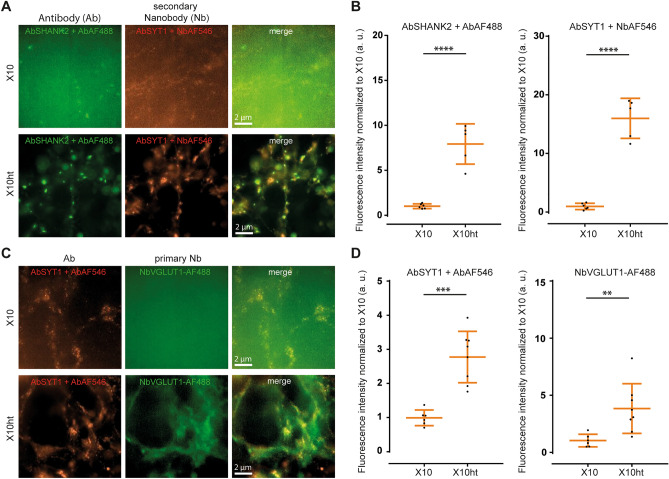
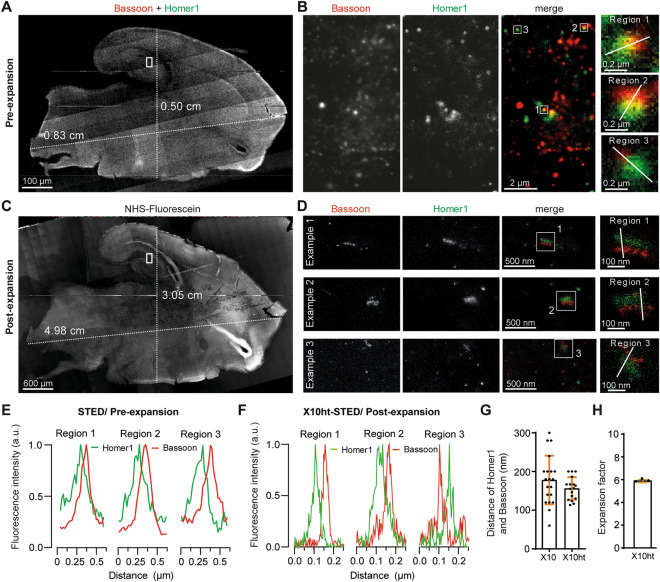
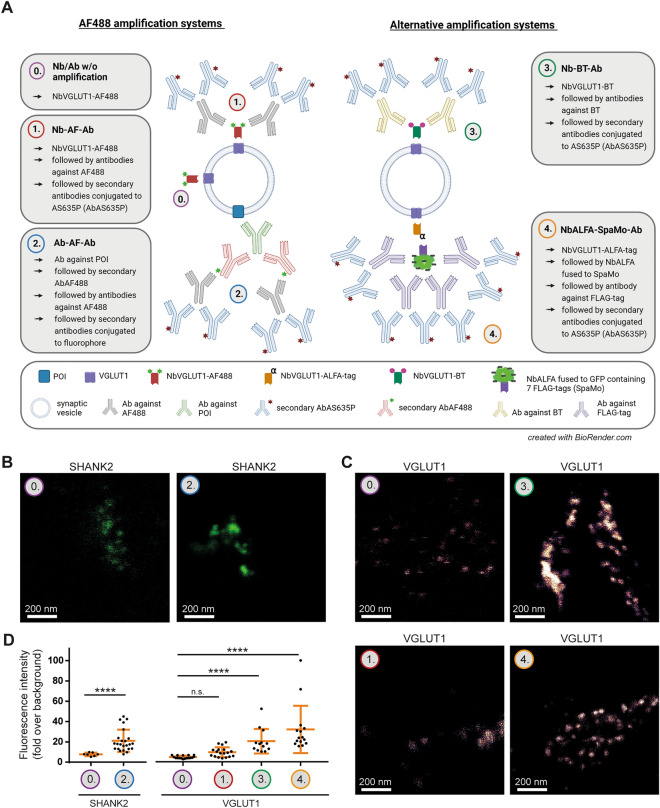
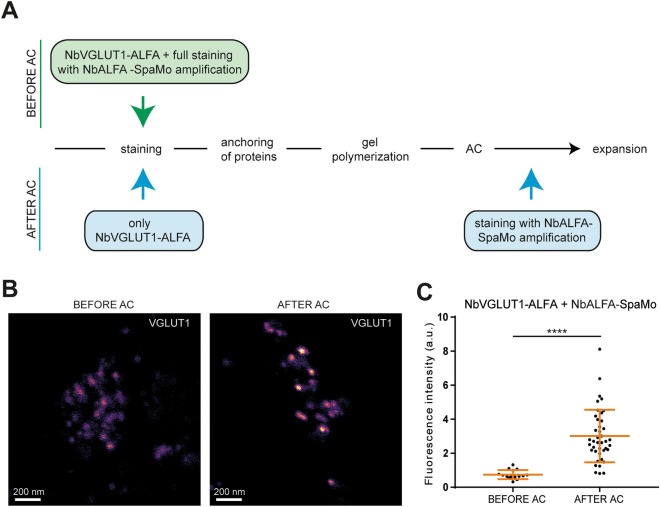
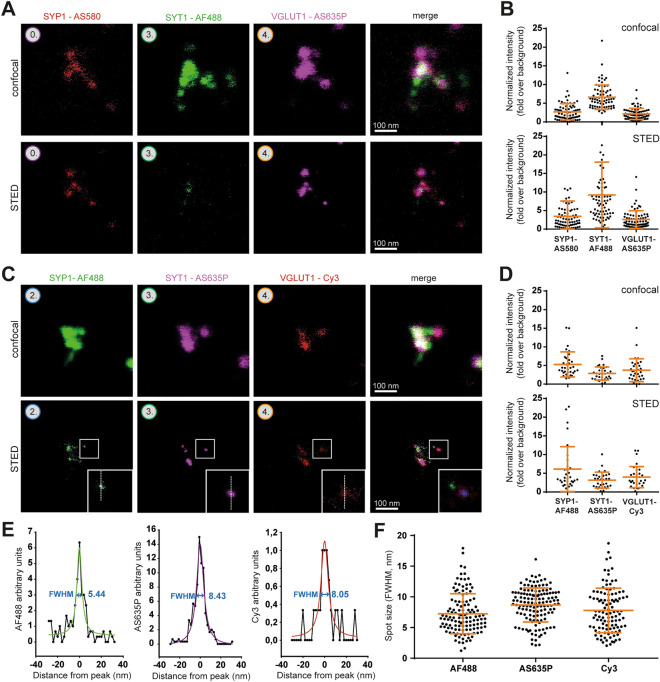
Expansion microscopy (ExM) improves imaging quality by physically enlarging the biological specimens. In principle, combining a large expansion factor with optical super-resolution should provide extremely high imaging precision. However, large expansion factors imply that the expanded specimens are dim and are therefore poorly suited for optical super-resolution. To solve this problem, we present a protocol that ensures the expansion of the samples up to 10-fold, in a single expansion step, through high-temperature homogenization (X10ht). The resulting gels exhibit a higher fluorescence intensity than gels homogenized using enzymatic digestion (based on proteinase K). This enables the sample analysis by multicolor stimulated emission depletion (STED) microscopy, for a final resolution of 6-8 nm in neuronal cell cultures or isolated vesicles. X10ht also enables the expansion of 100-200 µm thick brain samples, up to 6-fold. The better epitope preservation also enables the use of nanobodies as labeling probes and the implementation of post-expansion signal amplification. We conclude that X10ht is a promising tool for nanoscale resolution in biological samples.


Conflict of interest statement

S.O.R. and F.O. have received compensation from NanoTag Biotechnologies GmbH and own stock in the company. The remaining authors declare no competing interests.

Figures

Figure 1
Figure 1
X10ht enables confocal and STED imaging of tubulin immunostained in U2OS cells. (A) Scheme describing the differences between the X10 and X10ht protocols. (B) Representative images of tubulin under confocal or (C) STED imaging, indicating the difference in fluorescence intensity in both methods, what is quantified in (D). Using X10ht, we observed that the fluorescence signal appeared as a continuous decoration of the microtubules, while with X10 the loss of fluorophores results in “broken” microtubules (white arrows). N =  ~ 90 regions of interest (ROIs) from two gels for each condition. (E) Exemplary epifluorescence images of the same region imaged pre- and post-expansion (X10ht) using the same 10 × objective. The region of the detail image is indicated by a white rectangle, showing expanded cells with a 100 × objective. (F) Distortion analysis of aligned pre- and post-expansion images. N = 3 automated measurements. Except panel E, scale bars, here and elsewhere, are given including the correction by the expansion factor. Data are presented as single ROI data points, mean ± SD.
Figure 2
Figure 2
Applicability of nanobodies in X10ht, compared to homogenization with proteinase K (original X10 protocol). (A) Exemplary epifluorescence images of hippocampal cultured neurons immunostained with antibodies (Ab) for the postsynaptic protein SHANK2 and the presynaptic protein synaptotagmin1 (SYT1), revealed by secondary antibodies (AbSHANK2 + AbAF488) or secondary nanobodies (Nb) (AbSYT1 + NbAF546). (B) A pronounced increase in fluorescence intensity in both immunostainings is obtained when samples are autoclaved (X10ht) compared with the original X10 protocol. N = 6 images with several ROI analyzed for AbSHANK2 + AF488 X10 and AbSYT1 + NbAF546 X10, and N = 5 images with several ROI analyzed for AbSHANK2 + AF488 X10ht and AbSYT1 + NbAF546 X10ht. (C) Exemplary images of SYT1 antibody immunostainings, revealed by a secondary antibody (AbSYT1 + Ab AF546), in parallel with labeling for the vesicular glutamate transporter 1 (VGLUT1) with primary nanobodies coupled to AF488 (NbVGLUT1-AF488). (D) The quantification of the fluorescence signal revealed significantly increased intensities with X10ht. N = 6 images with several ROI analyzed for AbSYT1 + AbAF546 X10 and NbVGLUT1-AF488 X10, and 8 images with several ROI analyzed for AbSYT1 + AbAF546 X10ht and NbVGLUT1-AF488 X10ht from 2 gels. Data are presented as single data points, mean ± SD.
Figure 3
Figure 3
X10ht of 200 µm thick rat brain slices immunostained for the synaptic proteins Bassoon and Homer. (A) Epifluorescence tile image of merged channels displays a non-expanded 200 µm thick rat brain slice, containing the region of the hippocampal formation. (B) STED images of regions of the hippocampal formation (identified with white rectangles in A) show Bassoon (red) and Homer1 (green) in not expanded tissue. Zoom depict the marked regions (1–3). (E) Plots of the line scans over the zoomed areas. (C) Epifluorescence tile acquisition of the same brain slice after expansion labeled with NHS-Fluorescein, depicting the retention of tissue shape and the prolongation of the slice length from 0.83 to 4.98 cm and width from 0.5 to 3.05 cm. (D) Representative STED images of different regions from the C1 region of the hippocampus, showing highly resolved pre- (red) and postsynaptic (green) compartments. (F) The respective line scans are plotted, and the distance between the pre- and postsynaptic compartments is analyzed in (G). N = 20 ROI from two stained rat brain slices for not expanded STED; N = 17 ROI from 2 independent STED-X10ht experiments. (H) The graph shows an expansion factor of 6 with N = 3 independent experiments.
Figure 4
Figure 4
Pre-expansion labeling of presynaptic markers with different signal amplification systems in X10ht. (A) Schematic visualization of the different amplification systems. See the main text for more details. Final used fluorophores are Alexa Fluor488 (AF488) or Abberior Star635P (AS635P). (B) Representative confocal images of expanded neurons immunostained with either the antibody-AF488-based amplification system for SHANK2, or (C) with the different nanobody-based amplification systems detecting VGLUT1. (D) Quantitative analysis of SHANK2 with N = 7 images for 0. Ab w/o amplification, and N = 22 images for 2. Ab-AF-Ab from 3 experiments; N = 18 images for 0. Nb w/o amplification (VGLUT1) and 1. Nb-AF-Ab, N = 13 images for 3. Nb-BT-Ab, and N = 14 images for 4. NbALFA-SpaMo-Ab all to detect VGLUT1, with several ROIs analyzed per image generated from 2 experiments. Data are presented as single data points, mean ± SD.
Figure 5
Figure 5
Application of the NbALFA-SpaMo system before and after sample denaturation via autoclave (AC). (A) Scheme of two possible workflows for the NbALFA-SpaMo application. (B) Representative confocal images for both NbALFA-SpaMo applications before or after AC. (C) A quantification of the signal intensities in the different protocols. N = 15 images for before AC and 41 images for after AC with several ROI analyzed, obtained from two experiments. Data are presented as individual data points, mean ± SD.
Figure 6
Figure 6
X10ht-STED imaging of isolated synaptic vesicles. (A) Representative confocal and STED images of one possible combination of amplification systems for SYP1, SYT1 and VGLUT1, revealed by AS580, AF488 and AS635P, respectively. (C) The protein targets and their amplification systems are combined with another selection of fluorophores. (B, D) The fluorescence intensities of all channels were analyzed, and indicated a sufficient signal-to-noise ratio for vesicle identification. N = 74 ROIs from 27 images in B, and N = 33 ROIs from 20 images in (D). (E) Line scans were drawn over the spots indicated in zoom panels in (C). The respective full widths at half maximum (FWHM) are indicated. (F) An analysis of spot sizes of different fluorophores with N = 72 analyzed AF488 spots from 20 images, N = 78 AS635P spots from 18 images, and N = 34 Cy3 spots from 14 images from two different experiments. Data for B, D and F are presented as individual data points, mean ± SD.

References

    1. Schermelleh L, Ferrand A, Huser T, Eggeling C, Sauer M, Biehlmaier O, Drummen GPC. Super-resolution microscopy demystified. Nat. Cell Biol. 2019;21:72–84. doi: 10.1038/s41556-018-0251-8. - DOI - PubMed
    1. Sigal YM, Zhou R, Zhuang X. Visualizing and discovering cellular structures with super-resolution microscopy. Science. 2018;361:880–887. doi: 10.1126/science.aau1044. - DOI - PMC - PubMed
    1. Balzarotti F, Eilers Y, Gwosch KC, Gynnå AH, Westphal V, Stefani FD, Elf J, Hell SW. Nanometer resolution imaging and tracking of fluorescent molecules with minimal photon fluxes. Science. 2017;355:606–612. doi: 10.1126/science.aak9913. - DOI - PubMed
    1. Eilers Y, Ta H, Gwosch KC, Balzarotti F, Hell SW. MINFLUX monitors rapid molecular jumps with superior spatiotemporal resolution. Proc. Natl. Acad. Sci. U. S. A. 2018;115:6117–6122. doi: 10.1073/pnas.1801672115. - DOI - PMC - PubMed
    1. Weber, M., von der Emde, H., Leutenegger, M., Gunkel, P., Cordes, V. C., Sambandan, S., Khan, T. A., Keller-Findeisen, J., Hell, S. W. MINSTED nanoscopy enters the ångström localization range. bioRxiv. 10.1101/2022.03.18.484906 (2022). - PMC - PubMed

Publication types