

Morphologies and composition changes in nonculprit subclinical atherosclerosis in diabetic versus nondiabetic patients with acute coronary syndrome who underwent long-term statin therapy
- PMID: 37005448
- PMCID: PMC10067820
- DOI: 10.1038/s41598-023-32638-w
Morphologies and composition changes in nonculprit subclinical atherosclerosis in diabetic versus nondiabetic patients with acute coronary syndrome who underwent long-term statin therapy
Abstract
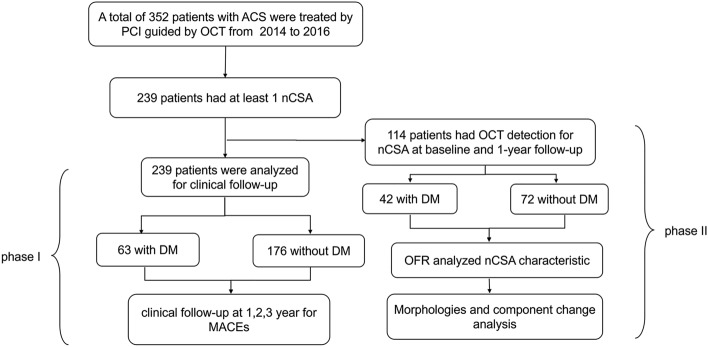
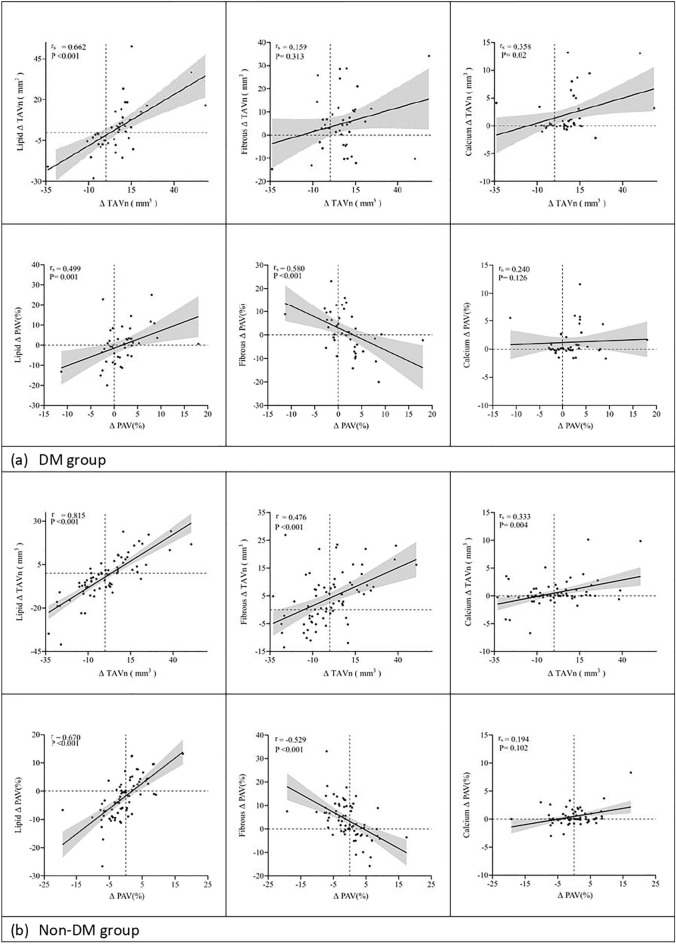
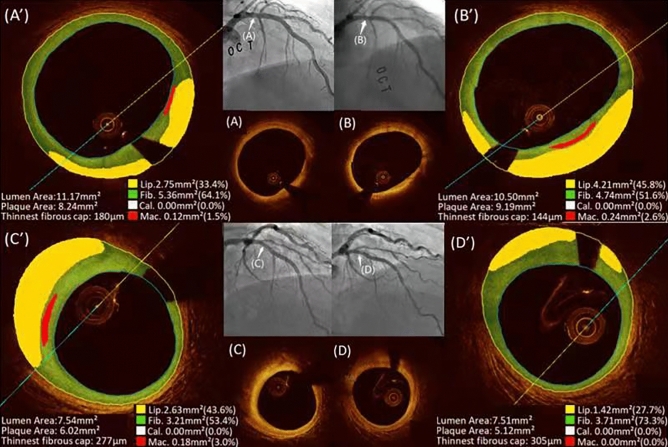
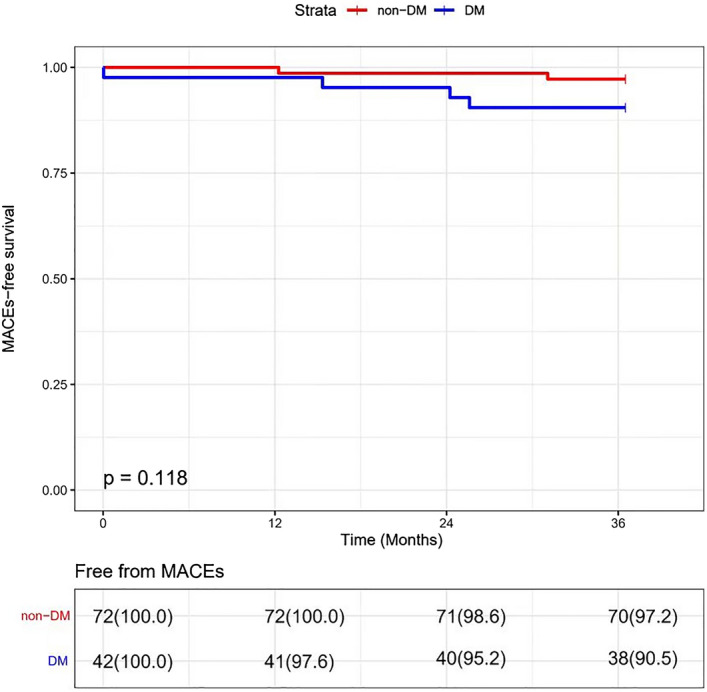
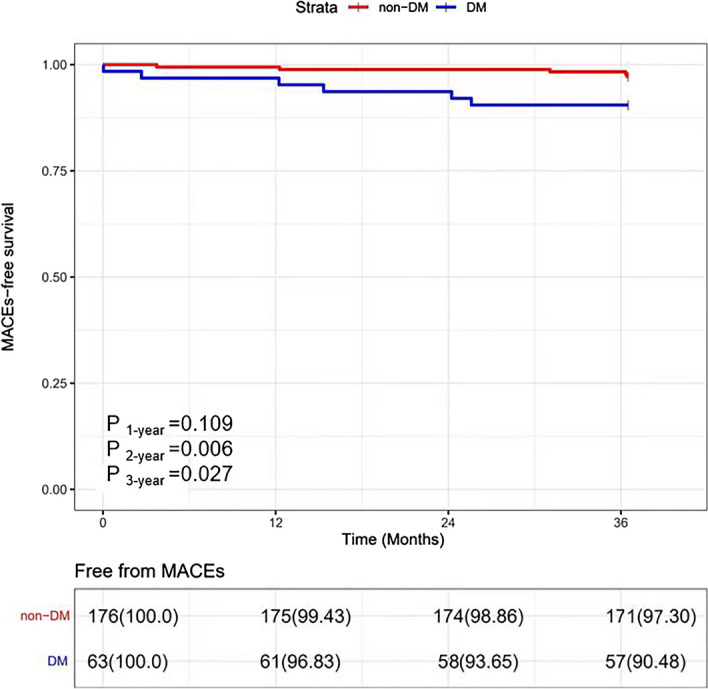
Although patients are undergoing similar lipid-lowering therapy (LLT) with statins, the outcomes of coronary plaque in diabetic mellitus (DM) and non-DM patients are different. Clinical data of 239 patients in this observational study with acute coronary syndrome was from our previous randomized trial were analyzed at 3 years, and 114 of them underwent OCT detection at baseline and the 1-year follow-up were re-anlayzed by a novel artificial intelligence imaging software for nonculprit subclinical atherosclerosis (nCSA). Normalized total atheroma volume changes (ΔTAVn) of nCSA were the primary endpoint. Plaque progression (PP) was defined as any increase in ΔTAVn. DM patients showed more PP in nCSA (ΔTAVn; 7.41 (- 2.82, 11.85) mm3 vs. - 1.12 (- 10.67, 9.15) mm3, p = 0.009) with similar reduction of low-density lipoprotein cholesterol (LDL-C) from baseline to 1-year. The main reason is that the lipid component in nCSA increases in DM patients and non-significantly decreases in non-DM patients, which leads to a significantly higher lipid TAVn (24.26 (15.05, 40.12) mm3 vs. 16.03 (6.98, 26.54) mm3, p = 0.004) in the DM group than in the non-DM group at the 1-year follow-up. DM was an independent predictor of PP in multivariate logistic regression analysis (OR = 2.731, 95% CI 1.160-6.428, p = 0.021). Major adverse cardiac events (MACEs) related to nCSA at 3 years were higher in the DM group than in the non-DM group (9.5% vs. 1.7%, p = 0.027). Despite a comparable reduction in LDL-C levels after LLT, more PP with an increase in the lipid component of nCSA and a higher incidence of MACEs at the 3-year follow-up was observed in DM patients.Trial registration: ClinicalTrials.gov. identifier: NCT02140801.
© 2023. The Author(s).
Conflict of interest statement
The authors declare no competing interests.
Figures
References
-
- Ference BA, Ginsberg HN, Graham I, et al. Low-density lipoproteins cause atherosclerotic cardiovascular disease. 1. Evidence from genetic, epidemiologic, and clinical studies. A consensus statement from the European atherosclerosis society consensus panel. Eur. Heart J. 2017;38:2459–2472. doi: 10.1093/eurheartj/ehx144. - DOI - PMC - PubMed
Publication types
MeSH terms
Substances
Associated data
LinkOut - more resources
Full Text Sources
Medical
Miscellaneous
