. 2023 Apr 1;6(1):359.
doi: 10.1038/s42003-023-04734-0.

Multi-tissue DNA methylation aging clocks for sea lions, walruses and seals

Affiliations

Multi-tissue DNA methylation aging clocks for sea lions, walruses and seals

Todd R Robeck et al. Commun Biol. .

Abstract

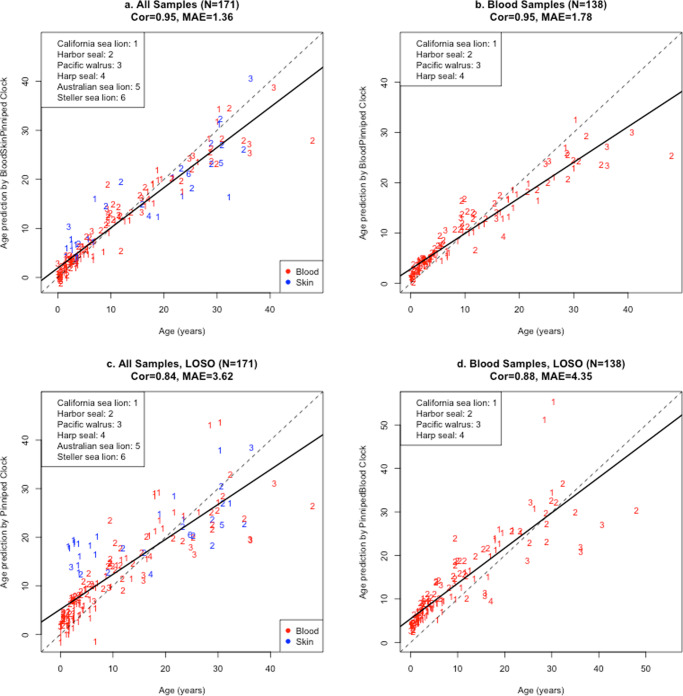
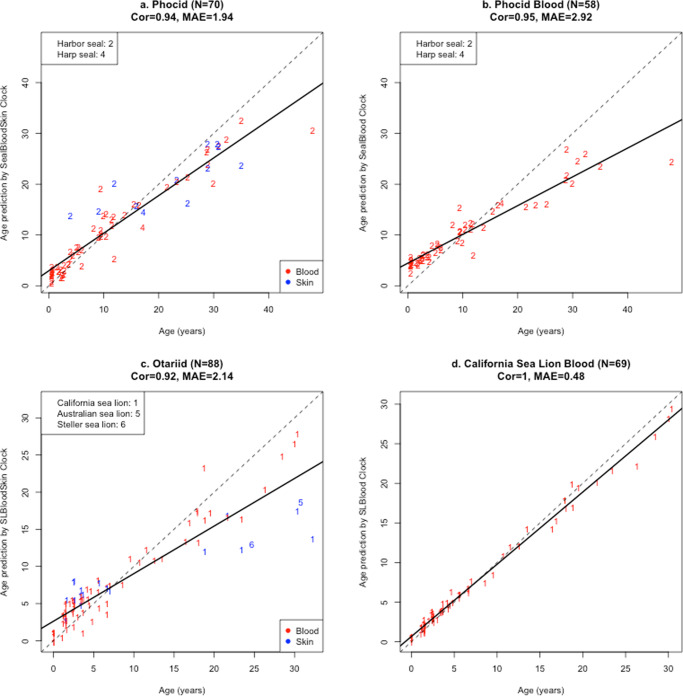
Age determination of wild animals, including pinnipeds, is critical for accurate population assessment and management. For most pinnipeds, current age estimation methodologies utilize tooth or bone sectioning which makes antemortem estimations problematic. We leveraged recent advances in the development of epigenetic age estimators (epigenetic clocks) to develop highly accurate pinniped epigenetic clocks. For clock development, we applied the mammalian methylation array to profile 37,492 cytosine-guanine sites (CpGs) across highly conserved stretches of DNA in blood and skin samples (n = 171) from primarily three pinniped species representing the three phylogenetic families: Otariidae, Phocidae and Odobenidae. We built an elastic net model with Leave-One-Out-Cross Validation (LOOCV) and one with a Leave-One-Species-Out-Cross-Validation (LOSOCV). After identifying the top 30 CpGs, the LOOCV produced a highly correlated (r = 0.95) and accurate (median absolute error = 1.7 years) age estimation clock. The LOSOCV elastic net results indicated that blood and skin clock (r = 0.84) and blood (r = 0.88) pinniped clocks could predict age of animals from pinniped species not used for clock development to within 3.6 and 4.4 years, respectively. These epigenetic clocks provide an improved and relatively non-invasive tool to determine age in skin or blood samples from all pinniped species.


Conflict of interest statement

S.H. is a founder of the non-profit Epigenetic Clock Development Foundation, which plans to license several of his patents from his employer UC Regents. The other authors declare no conflicts of interest.

Figures

Fig. 1
Fig. 1. Cross-validation study of the epigenetic clock for pinnipeds.
a, b report the Leave-One-Out-Cross-Validation (LOOCV) regression estimates for the pinniped clocks when applied to blood and skin (a) and blood only (b). This cross-validation method is used to estimate the clocks overall performance at predicting age from novel samples (skin or blood) collected from the animals used in clock development. c, d report Leave-One-Species-Out (LOSO) regression estimates for the pinniped clocks when applied to blood and skin (c) and blood only (d). These cross-validated analyses provide estimates for the clocks ability to predict age in species of pinnipeds that were not used for clock development. Species are presented with different integer numbers and identified in the legend; tissue types are indicated by two colors with red = blood, blue = skin. Each panel depicts a linear regression line (black dashed line), a diagonal reference line (y = x), the sample size (N), Pearson correlation (Cor) across all samples, and the median absolute error (MAE) across samples from all species.
Fig. 2
Fig. 2. Cross-validation study of the epigenetic clock for seals (Phocidae) and sea lions (Otariidae).
ad report Leave-One-Out-Cross-Validation (LOOCV) regression estimates of the Phocid blood + skin clock (a), the Phocid blood clock (b), Otariid blood + skin clock (c) and California Sea Lion Blood clock (d). This cross-validation method was used to estimate the clocks overall performance at predicting age from novel samples (skin or blood) collected from the species used in clock development. Species are presented with different integer numbers and identified in the legend; tissue types are indicated by two colors (red = blood, blue = skin). Each panel depicts a linear regression line (black dashed line), a diagonal reference line (y = x), the sample size (N), Pearson correlation (Cor) across all samples, and the median absolute error (MAE) across samples from all species.
Fig. 3
Fig. 3. Epigenome-wide association study (EWAS) of chronological age in skin or blood of three pinniped species.
a Manhattan plots of the EWAS of chronological age. The coordinates are based on the alignment of the probes to the corresponding genome for each species (oros_1.0, gsc_hseal_1.0, and zalcal2.2). The direction of the associations as determined by a Pearson correlation test p value (unadjusted p < 0.005, red dotted line) are colored in red (age-related increase) and blue (age-related decrease), respectively. The top 15 CpGs were labeled by the neighboring genes. b, c Venn diagrams representing the overlap of top 500 positively and top 500 negatively age-associated CpGs in each pinniped tissue. Results for all CpHs are provide in Supplementary Table 1.
Fig. 4
Fig. 4. Age-related methylation changes in gene regions, CpG islands and chromatin states of pinniped species.
a Location of top CpGs in each tissue relative to the closest transcriptional start site. The odds ratio of the observed proportional changes occurring when compared to the background are reported in each bar. Fisher exact p values: *p < 0.05, **p < 0.01, ***p < 0.001, ****p < 0.0001. b Box plot represents 25th and 75th percent quartiles, the line represents the median, and whiskers are 90% of aging association stratified by CpG island status in pinniped species. The x axis is the Fisher transformed z score of the Pearson correlation of each CpG with age. Student’s t test p values are labeled above the box plots. c Enrichment of the chromatic states for age-related CpGs in pinnipeds. The chromatin states are based on the StackHMM, which reports the universal chromatin states in humans. The p values were calculated with the hypergeometric test of the EWAS results with CpGs that are in each chromatin state. The background was limited to the CpGs that could be aligned to all three pinniped genomes. The PRC2 state was defined based on the binding motif for any polycomb repressor complex 2 transcription factor (EED, SUZ12, EZH2) in human tissues.
Fig. 5
Fig. 5. Gene set enrichment analysis of age-related CpGs in pinniped tissues.
The gene level enrichment was done using GREAT analysis and human Hg19 background limited to CpGs that could be aligned to three pinniped species. The CpGs were annotated with adjacent genes in a 50 kb flanking region. We extracted up to 500 of the top CpGs based on p < 0.005 of association per direction of change as input for the enrichment analysis. The p values were calculated by hypergeometric test of the epigenome-wide association study (EWAS) results with the genes in each background dataset. Datasets: gene ontology; mouse phenotypes; promoter motifs; and MsigDB Perturbation, which includes the expression signatures of genetic perturbations curated in GSEA database. The results were filtered for significance at p < 10−5, minimum overlap of 3 genes, and only the top terms for each EWAS result.

Similar articles

Cited by

References

    1. Garlich-Miller J, Stewart R, Stewart B, Hiltz E. Comparison of mandibular with cemental growth-layer counts for ageing Atlantic walrus (Odobenus rosmarus rosmarus) Can. J. Zool. 1993;71:163–167. doi: 10.1139/z93-022. - DOI
    1. Monson DH, Udevitz MS, Jay CV. Estimating age ratios and size of Pacific walrus herds on coastal haulouts using video imaging. PLoS ONE. 2013;8:e69806. doi: 10.1371/journal.pone.0069806. - DOI - PMC - PubMed
    1. Richard P, Campbell R. Status of the Atlantic walrus, Odobenus rosmarus rosmarus, in Canada. Can. Field Naturalist. 1988;102:337–350.
    1. Previdi M, Smith KL, Polvani LM. Arctic amplification of climate change: a review of underlying mechanisms. Environ. Res. Lett. 2021;16:093003. doi: 10.1088/1748-9326/ac1c29. - DOI
    1. Gulland, F. M. et al. A review of climate change effects on marine mammals in United States waters: past predictions, observed impacts, current research and conservation imperatives. Clim. Chang. Ecol.3, 100054 (2022).

Publication types