. 2023 Apr 1;13(1):5360.
doi: 10.1038/s41598-023-32428-4.

Patients with ACPA-positive and ACPA-negative rheumatoid arthritis show different serological autoantibody repertoires and autoantibody associations with disease activity

Affiliations

Patients with ACPA-positive and ACPA-negative rheumatoid arthritis show different serological autoantibody repertoires and autoantibody associations with disease activity

Kevin Y Cunningham et al. Sci Rep. .

Abstract

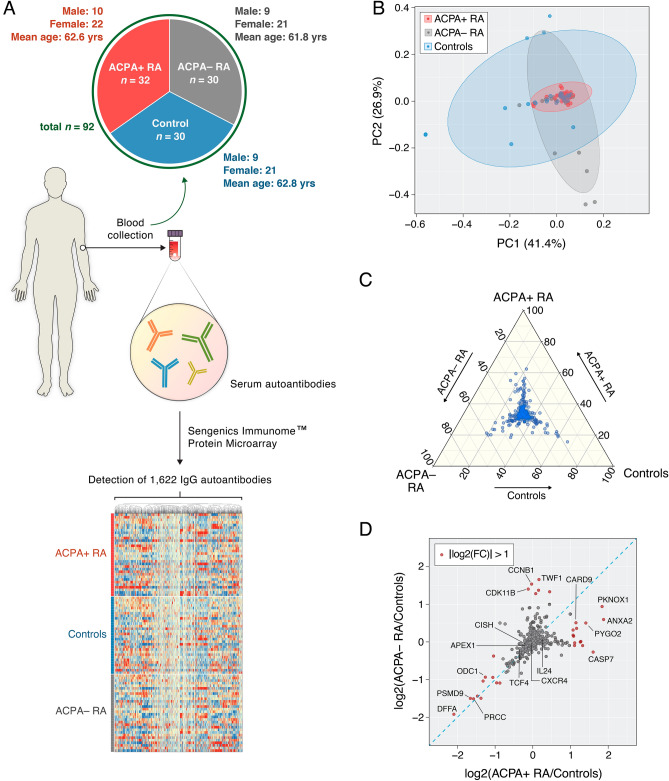
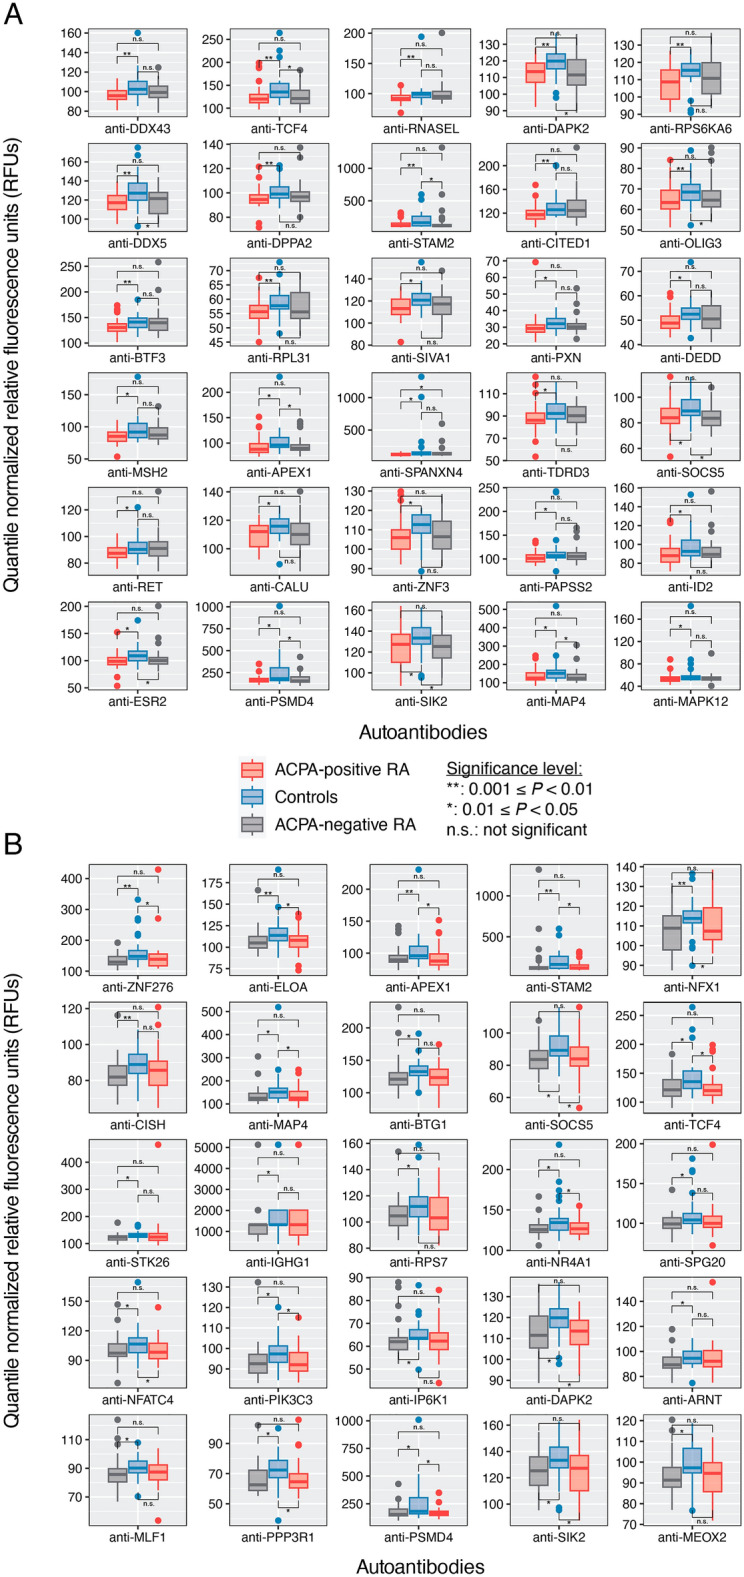
Patients with rheumatoid arthritis (RA) can test either positive or negative for circulating anti-citrullinated protein antibodies (ACPA) and are thereby categorized as ACPA-positive (ACPA+) or ACPA-negative (ACPA-), respectively. In this study, we aimed to elucidate a broader range of serological autoantibodies that could further explain immunological differences between patients with ACPA+ RA and ACPA- RA. On serum collected from adult patients with ACPA+ RA (n = 32), ACPA- RA (n = 30), and matched healthy controls (n = 30), we used a highly multiplex autoantibody profiling assay to screen for over 1600 IgG autoantibodies that target full-length, correctly folded, native human proteins. We identified differences in serum autoantibodies between patients with ACPA+ RA and ACPA- RA compared with healthy controls. Specifically, we found 22 and 19 autoantibodies with significantly higher abundances in ACPA+ RA patients and ACPA- RA patients, respectively. Among these two sets of autoantibodies, only one autoantibody (anti-GTF2A2) was common in both comparisons; this provides further evidence of immunological differences between these two RA subgroups despite sharing similar symptoms. On the other hand, we identified 30 and 25 autoantibodies with lower abundances in ACPA+ RA and ACPA- RA, respectively, of which 8 autoantibodies were common in both comparisons; we report for the first time that the depletion of certain autoantibodies may be linked to this autoimmune disease. Functional enrichment analysis of the protein antigens targeted by these autoantibodies showed an over-representation of a range of essential biological processes, including programmed cell death, metabolism, and signal transduction. Lastly, we found that autoantibodies correlate with Clinical Disease Activity Index, but associate differently depending on patients' ACPA status. In all, we present candidate autoantibody biomarker signatures associated with ACPA status and disease activity in RA, providing a promising avenue for patient stratification and diagnostics.


Conflict of interest statement

Dr. Davis has a research grant from Pfizer and has rights to royalties for technology licensed to Girihlet. Neither Pfizer nor Girihlet had any role in the design or conduct of this study. All other authors do not possess any conflict of interest.

Figures

Figure 1
Figure 1
Group-wise comparisons of serum autoantibody composition profiles. (A) Blood (serum) samples were collected to examine autoantibody compositions in ACPA+ RA (n = 32), ACPA− RA (n = 30), and healthy controls (n = 30). By using the Sengenics Immunome Protein Microarray, each serum sample was screened for 1622 IgG isotype autoantibodies that target human proteins in their full-length, correctly folded, native conformations. The heatmap illustrates autoantibodies clustered according to abundance similarities across samples. (B) Ordination plot (PCA) of the autoantibody profiles. (C) Ternary plot showing normalized mean abundances of 1622 autoantibodies across ACPA+ RA, ACPA− RA, and controls. The coordinates of each point correspond to normalized mean abundances (in percentages) and sum to 100. (D) Fold-changes in mean autoantibody abundances between an RA subgroup and the control group. X-axis and y-axis correspond to the fold-changes between ACPA+ RA and controls and between ACPA− RA and controls, respectively. Points shown in red represent autoantibodies that have a fold-change of 2 (or greater) between an RA subgroup and controls. The blue diagonal dashed line represents the line y = x. For brevity, the points in the scatterplot are labeled by the names of the autoantigen targets.
Figure 2
Figure 2
Serum autoantibodies with higher abundances in ACPA+ RA and ACPA− RA compared with healthy controls. Patients with (A) ACPA+ RA (n = 32) and (B) ACPA− RA (n = 30) show higher abundances in 22 and 19 autoantibodies, respectively, compared with healthy controls (n = 30). In (A) and (B), the other RA subgroup is shown for comparison (far right). Two-sided Mann–Whitney U test (P < 0.05) and the Cliff’s delta effect size (|d|> 0.33) were used to find autoantibodies with significantly higher abundances. Standard box-and-whisker plots (e.g., center line, median; box limits, upper and lower quartiles; whiskers, 1.5 × interquartile range; points, outliers) are used to show autoantibody abundances. Anti-GTF2A2 was found to have a significantly higher abundance in both ACPA+ RA and ACPA− RA subgroups.
Figure 3
Figure 3
Serum autoantibodies with lower abundances in ACPA+ RA and ACPA− RA than healthy controls. Patients with (A) ACPA+ RA (n = 32) and (B) ACPA− RA (n = 30) show lower abundances in 30 and 25 autoantibodies, respectively, compared with healthy controls (n = 30). In (A) and (B), the other RA subgroup is shown for comparison (far right). Two-sided Mann–Whitney U test (P < 0.05) and Cliff’s delta effect size (|d|> 0.33) were used to find autoantibodies of significantly lower abundances. Standard box-and-whisker plots (e.g., center line, median; box limits, upper and lower quartiles; whiskers, 1.5 × interquartile range; points, outliers) are used to show autoantibody abundances. Eight autoantibodies (anti-APEX1, anti-DAPK2, anti-MAP4, anti-PSMD4, anti-SIK2, anti-SOCS5, anti-STAM2, and anti-TCF4) were found in common to both ACPA + RA and ACPA − RA subgroups.
Figure 4
Figure 4
Human protein antigens (potential autoantigens) targeted by the differentially abundant serum autoantibodies are enriched in fundamental cellular functions. The top 5 statistically enriched biological processes of the antigen targets of the autoantibodies found to be significantly (A) higher and (B) lower in RA subgroups (ACPA+ , ACPA− ) compared with healthy controls. Enriched (i.e., over-represented) biological processes were rank-ordered in descending order based on the modified one-tailed Fisher’s exact test P-values provided in DAVID.
Figure 5
Figure 5
Serum autoantibodies in RA patients display significant correlations with CDAI. The strength of the relationships between autoantibody abundances and CDAI was measured in three groups: ACPA+ RA (n = 32), ACPA− RA (n = 30), and all RA (n = 62) patients. 27 different autoantibodies were significantly correlated with CDAI (|Spearman’s ρ|> 0.4 and P < 0.01).

References

    1. Rönnelid J, et al. Longitudinal analysis of citrullinated protein/peptide antibodies (anti-CP) during 5 year follow up in early rheumatoid arthritis: Anti-CP status predicts worse disease activity and greater radiological progression. Ann. Rheum. Dis. 2005;64:1744–1749. doi: 10.1136/ard.2004.033571. - DOI - PMC - PubMed
    1. Burgers LE, van Steenbergen HW, Ten Brinck RM, Huizinga TW, van der Helm-van Mil AH. Differences in the symptomatic phase preceding ACPA-positive and ACPA-negative RA: A longitudinal study in arthralgia during progression to clinical arthritis. Ann. Rheum. Dis. 2017;76:1751–1754. doi: 10.1136/annrheumdis-2017-211325. - DOI - PubMed
    1. Grosse J, et al. ACPA-positive versus ACPA-negative rheumatoid arthritis: Two distinct erosive disease entities on radiography and ultrasonography. Rheumatol. Int. 2020;40:615–624. doi: 10.1007/s00296-019-04492-5. - DOI - PubMed
    1. Seegobin SD, et al. ACPA-positive and ACPA-negative rheumatoid arthritis differ in their requirements for combination DMARDs and corticosteroids: Secondary analysis of a randomized controlled trial. Arthritis Res. Ther. 2014;16:R13. doi: 10.1186/ar4439. - DOI - PMC - PubMed
    1. Daha NA, Toes REM. Rheumatoid arthritis: Are ACPA-positive and ACPA-negative RA the same disease? Nat. Rev. Rheumatol. 2011;7:202–203. doi: 10.1038/nrrheum.2011.28. - DOI - PubMed

Publication types

Substances