. 2023 May;43(5):582-612.
doi: 10.1002/cac2.12417. Epub 2023 Apr 2.

Cytoplasmic YAP1-mediated ESCRT-III assembly promotes autophagic cell death and is ubiquitinated by NEDD4L in breast cancer

Affiliations

Cytoplasmic YAP1-mediated ESCRT-III assembly promotes autophagic cell death and is ubiquitinated by NEDD4L in breast cancer

Yan Guo et al. Cancer Commun (Lond). 2023 May.

Abstract

Background: Nuclear Yes1-associated transcriptional regulator (YAP1) promotes tumor progression. However, the function of cytoplasmic YAP1 in breast cancer cells and its impact on the survival of breast cancer patients remain unclear. Our research aimed to explore the biological function of cytoplasmic YAP1 in breast cancer cells and the possibility of cytoplasmic YAP1 as a predictive marker of breast cancer survival.

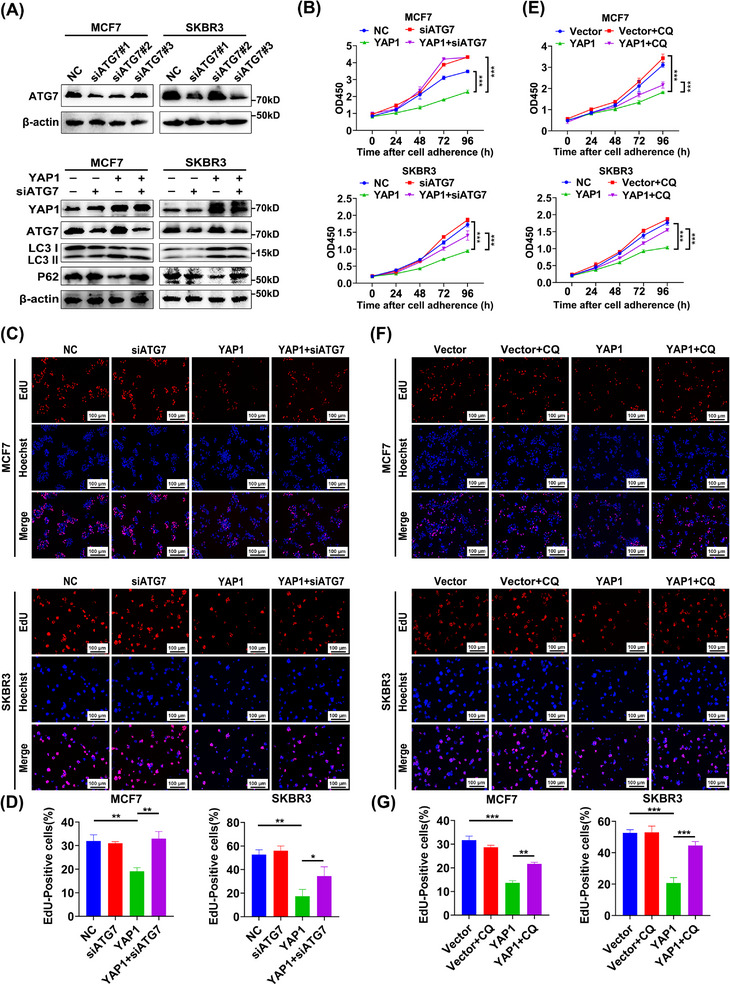
Methods: We constructed cell mutant models, including NLS-YAP15SA (nuclear localized), YAP1S94A (incapable of binding to the TEA domain transcription factor family) and YAP1S127D (cytoplasmic localized), and used Cell Counting Kit-8 (CCK-8) assays, 5-ethynyl-2'-deoxyuridine (EdU) incorporation assays, and Western blotting (WB) analysis to detect cell proliferation and apoptosis. The specific mechanism of cytoplasmic YAP1-mediated endosomal sorting complexes required for transport III (ESCRT-III) assembly was studied by co-immunoprecipitation, immunofluorescence staining, and WB analysis. Epigallocatechin gallate (EGCG) was used to simulate YAP1 retention in the cytoplasm in in vitro and in vivo experiments to study the function of cytoplasmic YAP1. YAP1 binding to NEDD4-like E3 ubiquitin protein ligase (NEDD4L) was identified using mass spectrometry and was verified in vitro. Breast tissue microarrays were used to analyze the relationship between cytoplasmic YAP1 expression and the survival of breast cancer patients.

Results: YAP1 was mainly expressed in the cytoplasm in breast cancer cells. Cytoplasmic YAP1 promoted autophagic death of breast cancer cells. Cytoplasmic YAP1 bound to the ESCRT-III complex subunits charged multivesicular body protein 2B (CHMP2B) and vacuolar protein sorting 4 homolog B (VPS4B), promoting assembly of CHMP2B-VPS4B and activating autophagosome formation. EGCG retained YAP1 in the cytoplasm, promoting the assembly of CHMP2B-VPS4B to promote autophagic death of breast cancer cells. YAP1 bound to NEDD4L, and NEDD4L mediated ubiquitination and degradation of YAP1. Breast tissue microarrays revealed that high levels of cytoplasmic YAP1 were beneficial to the survival of breast cancer patients.

Conclusions: Cytoplasmic YAP1 mediated autophagic death of breast cancer cells by promoting assembly of the ESCRT-III complex; furthermore, we established a new breast cancer survival prediction model based on cytoplasmic YAP1 expression.

Keywords: Autophagosome closure; Autophagy; Breast cancer; CHMP2B; Cytoplasmic YAP1; EGCG; ESCRT-III; Hippo pathway; NEDD4L; Ubiquitin; VPS4B.


Conflict of interest statement

The authors declare no conflict of interest.

Figures

FIGURE 1
FIGURE 1
Cytoplasmic YAP1 inhibited breast cancer cell proliferation. (A) Representative IHC staining images of YAP1 in normal tissues (n= 16) and in breast cancer tissues (n= 119). (B) Comparisons of total YAP1 IHC staining scores between normal tissues (n= 16) and breast cancer tissues (n = 119) (left panel) and between the cytoplasm and nucleus of breast cancer tissues (n = 119) (right panel). Each circle represents one patient sample. (C) Data from the TCGA database showed that YAP1 expression was lower in breast cancer tissues (n = 1085) than in normal breast tissues (n = 112). (D) YAP1 protein expression was measured in six pairs of primary breast cancer tissues (T) and the matched adjacent normal tissues (N) by WB analysis. β‐actin was used as a loading control. (E) YAP1 expression was determined in a normal breast epithelial cell line (MCF‐10A) and eight breast cancer cell lines with qRT‐PCR. (F) YAP1 protein expression levels were determined in a normal breast epithelial cell line (MCF‐10A) and eight breast cancer cell lines by WB. (G) CCK‐8 assays were used to determine the effect of stable YAP1 overexpression (LV‐YAP1) by lentiviral transduction on the viability of MCF7 and SKBR3 cells. (H) DNA synthesis was detected in MCF7 and SKBR3 cells after stable YAP1 overexpression with an EdU incorporation assay. Hoechst labelled with blue fluorescent signal was used to mark the nucleus, while red fluorescent signal was used to label EdU. (I) WB analysis of the expression of apoptosis markers (PARP and Caspase‐3) in MCF7 and SKBR3 cells with stable overexpression of YAP1. (J) CCK‐8 assays were used to determine the effect of different YAP1 mutants (NLS‐YAP15SA , YAP1S94A , YAP1S127D ) on the viability of breast cancer MCF7 and SKBR3 cells. (K) DNA synthesis was detected in MCF7 and SKBR3 cells after YAP1WT and YAP1S127D transient overexpression with EdU incorporation assays. Hoechst labelled with blue fluorescent signal was used to mark the nucleus, while red fluorescent signal was used to label EdU. (L) WB analysis of the expression of apoptosis markers (PARP and Caspase‐3) after YAP1WT and YAP1S127D transient overexpression in MCF7 and SKBR3 cells. Data were collected from three independent experiments and are expressed as the mean ± standard deviation. **P < 0.01, ***P < 0.001 (Student's t‐test and one‐way ANOVA). Abbreviations: YAP1, yes1‐associated transcriptional regulator; IHC, immunohistochemistry; TCGA, the Cancer Genome Atlas; WB, Western blotting; qRT‐PCR, quantitative real‐time PCR; CCK‐8, Cell Counting Kit‐8; OD450, optical density at 450nm; EdU, 5‐Ethynyl‐2’‐ deoxyuridine; PARP, poly (ADP‐ribose) polymerase 1; LV‐Con: lentivirus‐control; LV‐YAP1, YAP1 overexpression lentivirus; YAP1WT, YAP1wild type; NLS‐YAP15SA, nuclear localization sequence‐YAP15SA, ANOVA, analysis of variance.
FIGURE 2
FIGURE 2
YAP1 overexpression promoted the formation of autophagosomes and autophagy flow was smooth in breast cancer cells. (A) WB analysis was used to examine expression of the autophagy markers LC3 and p62 after YAP1 overexpression for 48 h in MCF7 and SKBR3 cells. (B) Representative IF staining images and quantitative analysis of LC3 fluorescence puncta representing the formation of autophagosomes after YAP1 overexpression for 48 h in MCF7 and SKBR3 cells. DAPI labelled with blue fluorescent signal was used to mark the nucleus, while green fluorescent signal was used to label LC3. (C) WB analysis of LC3 and p62 expression in MCF7 and SKBR3 cells after YAP1 transient overexpression for 48 h with or without EBSS (6 h) starvation or CQ (20 µmol/L, 6 h) treatment. (D) Representative confocal laser microscopy images and quantitative analysis of red and green fluorescent puncta in MCF7 and SKBR3 cells. Cells were transfected with mRFP‐GFP‐LC3 adenovirus for 24 h after YAP1 overexpression to visualize autophagic flux. Yellow puncta indicate the presence of GFP and mRFP. Red puncta indicate the fusion of the autophagosome with the lysosome and quenching of GFP. DAPI labelled with blue fluorescent signal was used to mark the nucleus. (E) Autophagic structures (indicated with red arrows) were visualized with TEM in MCF7 cells after YAP1 overexpression for 48 h. (F) WB of LC3 and p62 expression in breast cancer MCF7 and SKBR3 cells transiently transfected with different YAP1 mutants (NLS‐YAP15SA , YAP1S94A , YAP1S127D ). Data were collected from three independent experiments and are shown as the mean ± standard deviation. *P < 0.05, **P < 0.01, ***P < 0.001 (Student's t‐test). Abbreviations: YAP1, Yes1‐associated transcriptional regulator; WB, Western blotting; LC3, microtubule‐associated protein 1 light chain 3; SQSTM1/p62, sequestosome 1; IF, immunofluorescence staining; DAPI, 4',6‐diamidino‐2‐phenylindole; EBSS, Earle's Balanced Salt Solution; CQ, chloroquine; GFP, green fluorescent protein; mRFP: monomer red fluorescent protein; TEM, transmission electron microscopy; EGFP, enhanced green fluorescent protein; YAP1WT, YAP1wild type; NLS‐YAP15SA, nuclear localization sequence‐YAP15SA.
FIGURE 3
FIGURE 3
Inhibition of autophagy weakened the anti‐proliferation effect of YAP1 on breast cancer cells. (A) MCF7 and SKBR3 cells were transfected with ATG7‐siRNAs (siATG7#1, siATG7#2, siATG7#3), and the knockdown efficiency of ATG7 was determined via WB analysis. siATG7#1 was selected for additional experimentation (upper panel). WB analysis was also used to examine expression of the autophagy markers LC3 and p62 after YAP1 overexpression with and without siATG7 in MCF7 and SKBR3 cells (lower panel). (B) CCK‐8 assays were performed to determine the effect of YAP1 overexpression on cell viability with and without ATG7 knockdown in MCF7 and SKBR3 cells. (C‐D) DNA synthesis in MCF7 and SKBR3 cells overexpressing YAP1 with and without ATG7 knockdown was determined using an EdU incorporation assay (upper panel). Hoechst labelled with blue fluorescent signal was used to mark the nucleus, while red fluorescent signal was used to label EdU. Statistical analysis is shown in the lower panel. (E) CCK‐8 assays were used to determine the effect of YAP1 overexpression on viability of MCF7 and SKBR3 cells with or without the autophagy inhibitor CQ (20 µmol/L). (F‐G) DNA synthesis was examined in MCF7 and SKBR3 cells transiently overexpressing YAP1 with or without CQ (20 µmol/L) using an EdU incorporation assay (upper panel). Hoechst labelled with blue fluorescent signal was used to mark the nucleus, while red fluorescent signal was used to label EdU. Statistical analysis is shown in the lower panel. Experiments were conducted in triplicate, and data are shown as the mean ± standard deviation. *P < 0.05, **P < 0.01, ***P < 0.001 (Student's t‐test and one‐way ANOVA). Abbreviations: YAP1, Yes1‐associated transcriptional regulator; WB, Western blotting; ATG7, autophagy related 7; LC3, microtubule‐associated protein 1 light chain 3; SQSTM1/P62, sequestosome 1; CCK‐8, Cell Counting Kit‐8; OD450, optical density at 450nm; EdU, 5‐Ethynyl‐2’‐ deoxyuridine; CQ, chloroquine; ANOVA, analysis of variance.
FIGURE 4
FIGURE 4
YAP1 bound to VPS4B and CHMP2B and promoted CHMP2B‐VPS4B assembly. (A) PPI network of autophagy‐related genes that interact with YAP1. The three genes labeled in pink (VPS25, VPS4B, and CHMP3) belong to the ESCRT‐III complex. (B) SKBR3 cells were transfected with YAP1 overexpression plasmid, MDA‐MB‐231 cells were transfected with siYAP1, and mRNA expression levels of ESCRT‐III subunits were determined by qRT‐PCR. (C) VPS4B and CHMP2B expression levels were detected via WB in MDA‐MB‐231 and SKBR3 cells after YAP1 overexpression. (D) Left panel: magnified view of CHMP2B‐YAP1‐VPS4B binding. The R87–P99 residues of YAP1 were embedded in the binding region of CHMP2B and VPS4B; YAP1 serves as an anchor protein, stabilizing CHMP2B‐VPS4B binding. Right panel: the side chain phenyl ring of YAP1 (F95) interacts through π stacking with the imidazole ring of VPS4B (H36) and the phenyl ring of VPS4B (Y40). The amino group of the YAP1 side chain (R87) forms a hydrogen bond with the hydroxyl group of CHMP2B (D129). (E) MDA‐MB‐231 and SKBRS parent cell lysates were immunoprecipitated with anti‐YAP1, anti‐VPS4B, or anti‐CHMP2B antibodies, and YAP1 binding to VPS4B and CHMP2B was examined with WB analysis. (F) Upper panel: IF staining shows the co‐localization and subcellular localization of YAP1 (red) and VPS4B (green) in MDA‐MB‐231 and SKBR3 cells. DAPI labelled with blue fluorescent signal was used to mark the nucleus, while red fluorescent signal was used to label YAP1 and green fluorescent signal was used to label VPS4B. Lower panel: IF staining shows the co‐localization and subcellular localization of YAP1 (green) and CHMP2B (red) in MDA‐MB‐231 and SKBR3 cells. DAPI labelled with blue fluorescent signal was used to mark the nucleus, while red fluorescent signal was used to label CHMP2B and green fluorescent signal was used to label YAP1. (G) MDA‐MB‐231 and SKBR3 cells transfected with vector control or YAP1 overexpression plasmid were immunoprecipitated with anti‐VPS4B or anti‐CHMP2B antibody, and WB analysis was used to detect CHMP2B and VPS4B. Overexpression of YAP1 increased the interactions of VPS4B and CHMP2B. (H) MDA‐MB‐231 cells transfected with negative control or siYAP1 were immunoprecipitated with anti‐VPS4B or anti‐CHMP2B antibody, and WB analysis was used to detect CHMP2B and VPS4B. Downregulation of YAP1 weakened the interaction of VPS4B and CHMP2B. (I) MCF7 cells transfected with vector control or 3 truncated mutants of YAP1 were immunoprecipitated with anti‐Flag antibody, YAP1(1‐159aa) binds to VPS4B and CHMP2B. Blue arrows represent Flag‐specific bands. (J) MCF7 cells transfected with vector control or mutants of YAP1 were immunoprecipitated with anti‐Flag antibody; YAP1(F95) binds to VPS4B, and YAP1 (R87) binds to CHMP2B. Each experiment was repeated three times, and data are shown as the mean ± standard deviation. Abbreviations: PPI, protein‐protein interaction; ESCRT, endosomal sorting complexes required for transport; YAP1, Yes1‐associated transcriptional regulator; qRT‐PCR, quantitative real‐time PCR; WB, Western blotting; IP, immunoprecipitation; VPS4B, vacuolar protein sorting 4 homolog B; CHMP2B, charged multivesicular body protein 2B; IgG, immunoglobulin G; IF, immunofluorescence staining; DAPI, 4',6‐diamidino‐2‐phenylindole.
FIGURE 5
FIGURE 5
EGCG promoted retention of YAP1 in the cytoplasm by activating the Hippo pathway and promoting autophagy in breast cancer cells. (A) Natural small‐molecule compounds predicted to activate the Hippo pathway in breast cancer cell lines. (B) Bioinformatics analysis of pathways related to EGCG. (C) WB analysis was performed to examine expression of Hippo pathway components and YAP1 target genes (CTGF and CYR61) in MCF7 and MDA‐MB‐231 cells treated with EGCG of various concentrations for 6 h. (D) Expression levels of YAP1 and p‐YAP1 were determined in the nucleus and cytoplasm of MCF7 and MDA‐MB‐231 cells via WB analysis. LaminB1 and β‐actin were used as extraction controls for the nucleus and cytoplasm, respectively. (E‐F) Expression levels of the autophagy markers LC3 and p62 were detected by WB in MCF7 and MDA‐MB‐231 cells after treatment with EGCG of various concentrations or for different lengths of time. (G) IF staining images showing LC3 fluorescence puncta and quantitative analysis of MCF7 and MDA‐MB‐231 cells treated with EGCG (50 µg/mL, 6 h). DAPI labelled with blue fluorescent signal was used to mark the nucleus, while green fluorescent signal was used to label LC3. (H) Autophagic structures (indicated with red arrows) were detected with TEM in MCF7 and MDA‐MB‐231 cells treated with EGCG (50 µg/ml, 6 h). Data are from three independent experiments and are shown as the mean ± standard deviation. **P < 0.01 (Student's t‐test). Abbreviations: YAP1, Yes1‐associated transcriptional regulator; EGCG, epigallocatechin gallate; WB, Western blotting; MST1, macrophage stimulating 1; p‐MST1, phosphorylated‐macrophage stimulating 1; MOB1A: MOB kinase activator 1A; p‐MOB1A: phosphorylated‐MOB1A; CTGF, connective tissue growth factor; CYR61, cysteine rich angiogenic inducer 61; LC3, microtubule‐associated protein 1 light chain 3; SQSTM1/p62, sequestosome 1; IF, immunofluorescence staining; DAPI, 4',6‐diamidino‐2‐phenylindole; TEM, transmission electron microscopy.
FIGURE 6
FIGURE 6
Cytoplasmic retention of YAP1 promoted CHMP2B‐VPS4B assembly and autophagic death of breast cancer cells after EGCG treatment. (A) CCK‐8 assays were used to detect the viability of MCF7 and MDA‐MB‐231 cells treated with EGCG (50 µg/mL) with or without the autophagy inhibitor CQ (20 µmol/L). (B) DNA synthesis was detected in MCF7 and MDA‐MB‐231 cells treated with EGCG (50 µg/ mL, 6 h) with or without CQ (20 µmol/L) using an EdU incorporation assay (left panel). Hoechst labelled with blue fluorescent signal was used to mark the nucleus, while red fluorescent signal was used to label EdU. Statistical analysis is shown in the right panel. (C) Upper panel: WB analysis showing the effects of EGCG (50 µg/mL, 6 h) on expression of the autophagy markers LC3 and p62 in MCF7 and MDA‐MB‐231 cells with or without the MST1 kinase inhibitor XMU‐MP‐1 (8 µmol/L, 6 h). Lower panel: WB analysis showing the effects of EGCG (50 µg/mL, 6 h) on expression of the LC3 and p62 in MCF7 and MDA‐MB‐231 cells after YAP1 knockdown. (D) CCK‐8 assays showing the effects of EGCG (50 µg/mL) on the viability of MCF7 and MDA‐MB‐231 cells after YAP1 knockdown. (E) EdU incorporation assay showing the effects of EGCG (50 µg/mL) on DNA synthesis in MCF7 and MDA‐MB‐231 cells after YAP1 knockdown (upper panel). Hoechst labelled with blue fluorescent signal was used to mark the nucleus, while red fluorescent signal was used to label EdU. Statistical analysis is shown in the lower panel. (F) MDA‐MB‐231 cells treated with EGCG (50 µg/mL, 48 h) or a control were immunoprecipitated with anti‐VPS4B or anti‐CHMP2B antibody, then WB analysis was used to detect CHMP2B and VPS4B. Treatment with EGCG increased interactions between VPS4B and CHMP2B. Data are from three independent experiments and are shown as the mean ± standard deviation. *P < 0.05, **P < 0.01, ***P < 0.001 (Student's t‐test and one‐way ANOVA). Abbreviations: CCK‐8, Cell Counting Kit‐8; OD450, optical density at 450nm; EGCG, epigallocatechin gallate; CQ, chloroquine; EdU, 5‐Ethynyl‐2’‐ deoxyuridine; WB, Western blotting; MST1, macrophage stimulating 1; p‐MST1, phosphorylated‐macrophage stimulating 1; LC3, microtubule‐associated protein 1 light chain 3; SQSTM1/p62, sequestosome 1; YAP1, Yes1‐associated transcriptional regulator; IP, immunoprecipitation; VPS4B, vacuolar protein sorting 4 homolog B; CHMP2B: charged multivesicular body protein 2B; IgG, immunoglobulin G; ANOVA, analysis of variance.
FIGURE 7
FIGURE 7
Cytoplasmic YAP1 promoted autophagic cell death in vivo. (A) Tumor‐bearing nude mice from different treatment groups (n = 6 per group). (B) Tumors taken from mice in different treatment groups. (C) The weight of tumors from mice in each treatment group. (D) The tumor volume from mice in each treatment group over time. (E) WB analysis was performed to detect the expression of YAP1, p‐YAP1, the autophagy markers LC3 and p62, and YAP1 target genes CTGF and CYR61 in tumor tissues. (F) IHC staining of LC3, p62, YAP1, CTGF, and CYR61 in tumor tissues from mice in different treatment groups. (G) Autophagic structures (indicated with red arrows) in tumor tissues from the control and EGCG treatment groups were detected with TEM. Data are shown as the mean ± standard deviation. ***P < 0.001 (Student's t‐test and one‐way ANOVA). Abbreviations: EGCG, epigallocatechin gallate; LC3, microtubule‐associated protein 1 light chain 3; SQSTM1/p62, sequestosome 1; WB, Western blotting; YAP1, Yes1‐associated transcriptional regulator; CTGF, connective tissue growth factor; CYR61, cysteine rich angiogenic inducer 61; IHC, immunohistochemistry; TEM, transmission electron microscopy; ANOVA, analysis of variance.
FIGURE 8
FIGURE 8
NEDD4L mediated ubiquitylation and degradation of YAP1 through binding to YAP1. (A) MDA‐MB‐231 parent cell lysates were immunoprecipitated with anti‐YAP1 antibody. The red arrow indicates the YAP1‐interacting protein identified by mass spectrometry. (B) The E3 ubiquitin ligases acting on YAP1 were predicted with the online database UbiBrowser, an integrated bioinformatics platform. The eight dots in red refer to those verified as E3 ubiquitin ligases of YAP1 in the literatures, and the 10 dots in blue are predicted as E3 ubiquitin ligases of YAP1. The capital letters in dots indicate the initial letters of E3 ubiquitin ligases‐domains: F refers to F‐box domain, R refers to RING domain, H refers to HECT domain, U refers to UBOX domain. The predicted interactions are arranged in descending order clockwise based on the confidence score. (C) NEDD4L and YAP1 were immunoprecipitated from MCF7 and SKBR3 parent cell lysates with anti‐YAP1 and anti‐NEDD4L antibodies, then detected via WB. This confirmed the interaction between YAP1 and NEDD4L. (D) Representative IHC staining images of NEDD4L and YAP1 in breast cancer tissues (n = 51) (left panel). Expression levels of NEDD4L and YAP1 were negatively correlated with one another (right panel). (E) WB analysis of NEDD4L expression in six matched pairs of primary breast cancer tissues (T) and adjacent normal tissues (N). (F) MCF7 and SKBR3 cells were transfected with NEDD4LsiRNAs (siNEDD4L#1, siNEDD4L#2, siNEDD4L#3), and NEDD4L expression was detected with WB analysis. siNEDD4L#3 was selected for subsequent experiments. (G) Stability analysis of YAP1. MCF7 and SKBR3 cells were transfected with NEDD4L overexpression plasmid or siNEDD4L for 48 h, then exposed to CHX (100 µg/mL) for 0, 8, 10, or 12 h. WB analysis of YAP1 expression was then performed. (H‐I) YAP1 ubiquitination degradation assay. MCF7 and SKBR3 cells were transfected with NEDD4L overexpression plasmid or siNEDD4L and treated with MG132 (20 µmol/L, 6 h). YAP1 expression was detected with WB analysis. (J) Ubiquitination assays showing the effects of NEDD4L on YAP1 ubiquitination. MCF7 and SKBR3 cells overexpressing Flag‐ub were transfected with NEDD4L overexpression plasmid or siNEDD4L then treated with MG132 (20 µmol/L, 6 h). WB analysis was used to detect the ubiquitination of YAP1. Each experiment was repeated three times. Abbreviations: NEDD4L, NEDD4 like E3 ubiquitin protein ligase; IP, immunoprecipitation; IgG, immunoglobulin G; WB, Western blotting; YAP1, Yes1‐associated transcriptional regulator; IHC, immunohistochemistry; CHX, cycloheximide; Ub, ubiquitin.
FIGURE 9
FIGURE 9
Cytoplasmic YAP1 was beneficial for breast cancer survival and could be used to establish survival prediction models. (A) Kaplan‐Meier survival plots of total YAP1 expression, cytoplasmic YAP1 expression, and nuclear YAP1 expression in breast cancer tissues. (B‐C) A constructed nomogram for survival prediction of a patient with breast cancer (left panel). C‐index = 0.76 for DFS; C‐index = 0.80 for OS. The ROC curves show the prediction efficiency of the nomogram prediction models (AUC = 0.78 for DFS; AUC = 0.84 for OS). Abbreviations: YAP1, Yes1‐associated transcriptional regulator; DFS, disease‐free survival; OS, overall survival; HR, hazard ratio; CI, confidence interval; ROC, receiver operating characteristic; AUC: area under the curve.
FIGURE 10
FIGURE 10
The mechanism of cytoplasmic YAP1‐mediated ESCRT‐III assembly promoting autophagic cell death. Abbreviations: YAP1, Yes1‐associated transcriptional regulator; ESCRT, endosomal sorting complexes required for transport; EGCG, epigallocatechin gallate; NEDD4L, NEDD4 like E3 ubiquitin protein ligase; CHMP2B, charged multivesicular body protein 2B; VPS4B, vacuolar protein sorting 4 homolog B; LC3, microtubule associated protein 1 light chain 3; Ub, ubiquitin.

Similar articles

Cited by

References

    1. Siegel RL, Miller KD, Fuchs HE, Jemal A. Cancer statistics, 2022. CA Cancer J Clin. 2022;72(1):7–33. - PubMed
    1. Lei S, Zheng R, Zhang S, Wang S, Chen R, Sun K, et al. Global patterns of breast cancer incidence and mortality: A population‐based cancer registry data analysis from 2000 to 2020. Cancer Commun (Lond). 2021;41(11):1183–94. - PMC - PubMed
    1. Dey A, Varelas X, Guan KL. Targeting the Hippo pathway in cancer, fibrosis, wound healing and regenerative medicine. Nat Rev Drug Discov. 2020;19(7):480–94. - PMC - PubMed
    1. Eder N, Roncaroli F, Domart MC, Horswell S, Andreiuolo F, Flynn HR, et al. YAP1/TAZ drives ependymoma‐like tumour formation in mice. Nat Commun. 2020;11(1):2380. - PMC - PubMed
    1. Barry ER, Morikawa T, Butler BL, Shrestha K, de la Rosa R, Yan KS, et al. Restriction of intestinal stem cell expansion and the regenerative response by YAP. Nature. 2013;493(7430):106–10. - PMC - PubMed

MeSH terms

Substances