. 2023 Apr 1;6(1):358.
doi: 10.1038/s42003-023-04706-4.

PIEZO1 and PECAM1 interact at cell-cell junctions and partner in endothelial force sensing

Affiliations

PIEZO1 and PECAM1 interact at cell-cell junctions and partner in endothelial force sensing

Eulashini Chuntharpursat-Bon et al. Commun Biol. .

Abstract

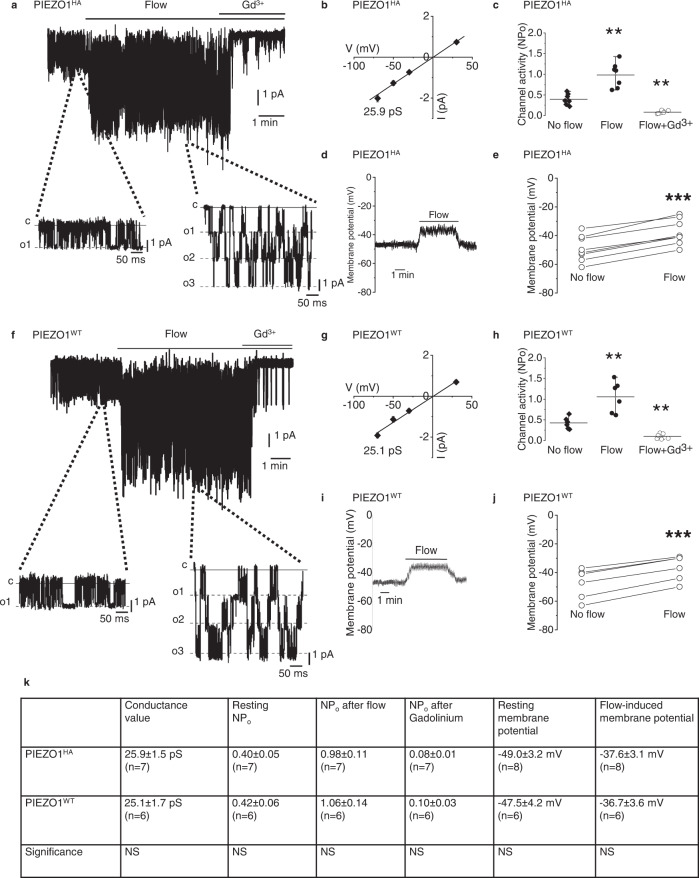
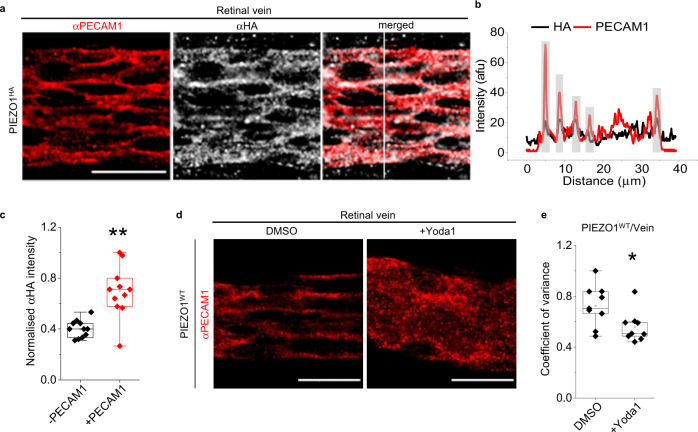
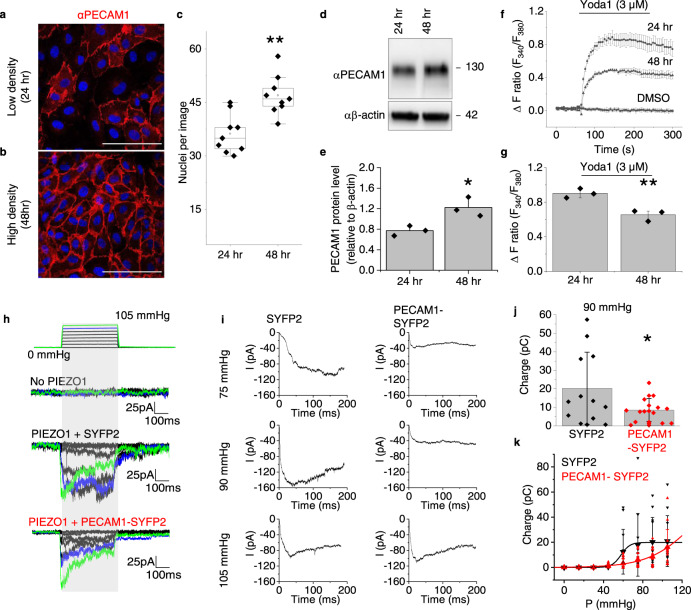
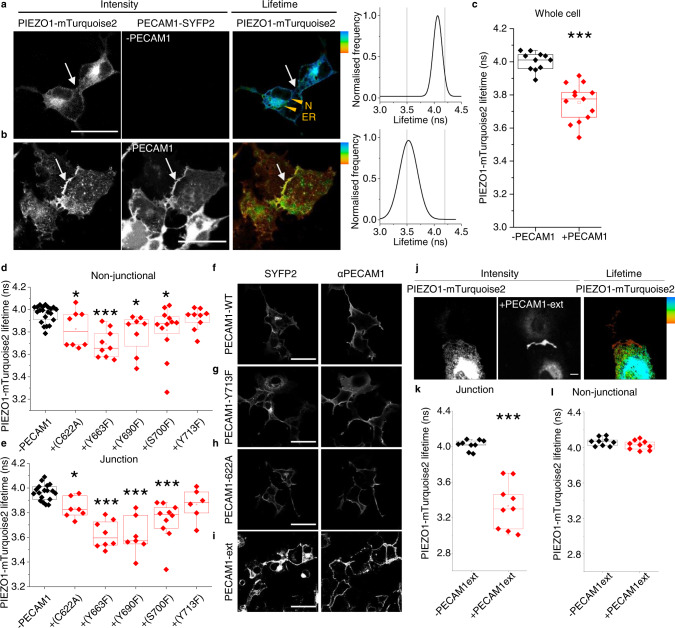
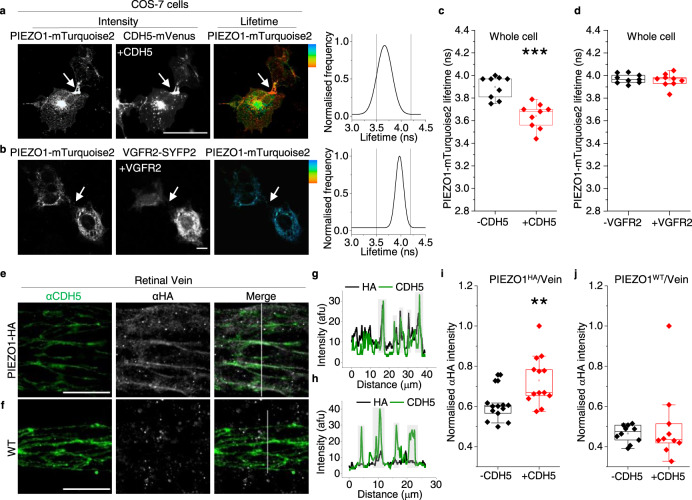
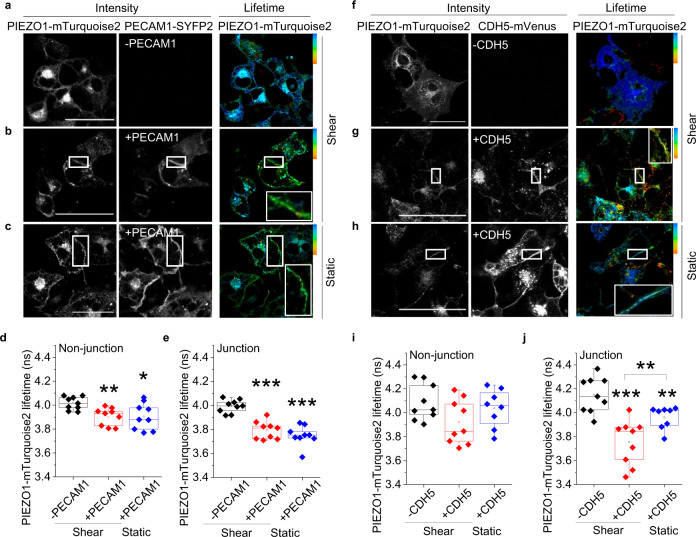
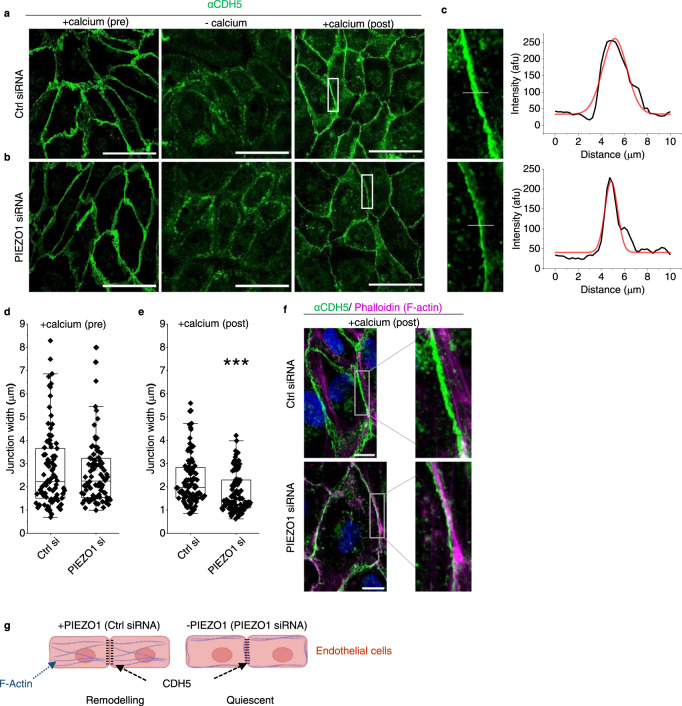
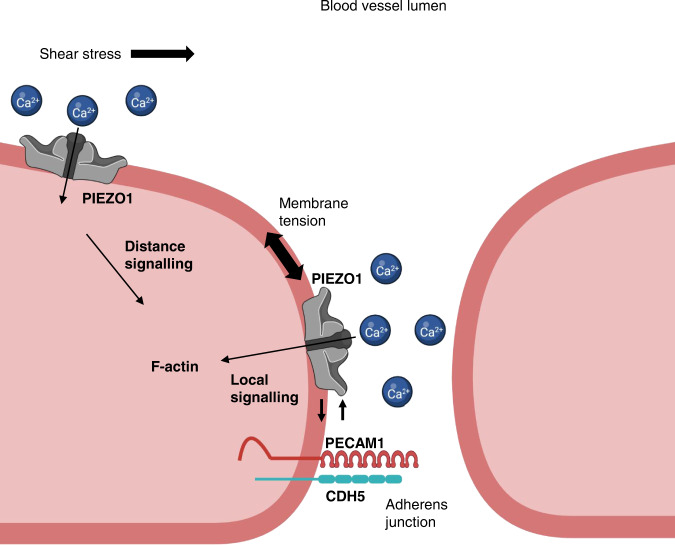
Two prominent concepts for the sensing of shear stress by endothelium are the PIEZO1 channel as a mediator of mechanically activated calcium ion entry and the PECAM1 cell adhesion molecule as the apex of a triad with CDH5 and VGFR2. Here, we investigated if there is a relationship. By inserting a non-disruptive tag in native PIEZO1 of mice, we reveal in situ overlap of PIEZO1 with PECAM1. Through reconstitution and high resolution microscopy studies we show that PECAM1 interacts with PIEZO1 and directs it to cell-cell junctions. PECAM1 extracellular N-terminus is critical in this, but a C-terminal intracellular domain linked to shear stress also contributes. CDH5 similarly drives PIEZO1 to junctions but unlike PECAM1 its interaction with PIEZO1 is dynamic, increasing with shear stress. PIEZO1 does not interact with VGFR2. PIEZO1 is required in Ca2+-dependent formation of adherens junctions and associated cytoskeleton, consistent with it conferring force-dependent Ca2+ entry for junctional remodelling. The data suggest a pool of PIEZO1 at cell junctions, the coming together of PIEZO1 and PECAM1 mechanisms and intimate cooperation of PIEZO1 and adhesion molecules in tailoring junctional structure to mechanical requirement.


Conflict of interest statement

The authors declare no competing interests.

Figures

Fig. 1
Fig. 1. Genetically engineered PIEZO1HA has comparable activity to wild-type PIEZO1 (PIEZO1WT) in mice.
a Example current recording from an outside-out patch from freshly isolated endothelium of second-order mesenteric artery of PIEZO1HA mouse. Holding potential, −70 mV. Fluid flow, 20 μl.s−1. Gadolinium (III) ion (Gd3+), 10 μM. Currents on expanded time-base are shown below in which c indicates the closed channel current level and o1, o2 and o3 the open channel current levels for simultaneous openings of up to 3 channels. b Mean ± s.e.mean unitary current amplitudes for flow-induced ion channel activity as in a plotted against holding voltage (n = 7 independent recordings). The fitted line indicates unitary conductance of 25.9 pS. c Channel activity indicated by NPo (number of channels per patch × probability of channel opening) for experiments of the type exemplified in a for no flow and flow conditions with or without Gd3+. Individual data points for each experiment are represented by symbols, superimposed on which are the mean ± s.e.mean values (**PFlow = 0.0001703, **PFlow+Gd3+ = 0.000165, n = 7 for each group). d Example trace of membrane potential measured from freshly isolated endothelium of second-order mouse mesenteric artery of PIEZO1HA mouse. Fluid flow, 20 μl.s−1. e Individual data points representing membrane potentials before and after flow as exemplified in d (***P = 0.00000343) (n = 7). Data points connected by a line were from the same recording. f Example current recording from an outside-out patch from freshly isolated endothelium of second-order mesenteric artery of PIEZO1WT mouse. Holding potential, −70 mV. Fluid flow, 20 μl.s−1. Gadolinium (III) ion (Gd3+), 10 μM. g Mean ± s.e.mean unitary current amplitudes for flow-induced ion channel activity as in b plotted against holding voltage (n = 6 independent recordings). The fitted line indicates unitary conductance of 25.9 pS. h Channel activity indicated by NPo (number of channels per patch × probability of channel opening) for experiments of the type exemplified in f for no flow and flow conditions with or without Gd3+. Individual data points for each experiment are represented by symbols, superimposed on which are the mean ± s.e.mean values (**PFlow = 0.000141, **PFlow+Gd3+ = 0.000241, n  =  6 for each group). i Example trace of membrane potential measured from freshly isolated endothelium of second-order mouse mesenteric artery of PIEZO1WT mouse. Fluid flow, 20 μl.s−1. j Individual data points representing membrane potentials before and after flow as exemplified in i (P = 0.0000375, n = 6). Data points connected by a line were from the same recording. k Table of data comparing values from PIEZO1HA mouse and PIEZO1WT mouse, (mean ± s.e.m.). NS indicates no statistically significant difference between PIEZO1HA and PIEZO1WT. For the outside-out patch and membrane potential recordings, the external solution consisted of: 135 mM NaCl, 4 mM KCl, 2 mM CaCl2, 1 mM MgCl2, 10 mM glucose and 10 mM HEPES (titrated to pH 7.4 with NaOH). The patch pipette contained: 145 mM KCl, 1 mM MgCl2, 0.5 mM EGTA and 10 mM HEPES (titrated to pH 7.2 with KOH).
Fig. 2
Fig. 2. Endogenous PIEZO1 is close to and can disrupt PECAM1 at cell-cell junctions.
a Images for retinal vein of PIEZO1HA mouse after immuno-staining with αPECAM1 (red) and αHA (grey). The image on the right side is a merged αPECAM1 and αHA image. Scale bar, 20 µm. b Line-intensity plot for the vertical scan line superimposed in the merged image of a. Grey highlighting indicates cell-cell junctions. c Box-plot quantification of image intensity for PIEZO1HA retinal veins stained with αHA antibody, shown in arbitrary fluorescence units (afu) normalised to the background measurements in the same afu. **P = 0.00127 for the comparison of the regions with (+) or without (−) PECAM1. Superimposed data points are average intensity of individual images (N = 11). Data are for n = 3 independent experiments. d Data obtained after WT mice were infused for 30 min with standard bath solution (SBS) containing DMSO (the solvent for Yoda1) or 3 µM Yoda1. Representative images of d retinal vein immuno-stained with αPECAM1 antibody. Scale bar, 20 µm. Box-plots e show coefficients of variance calculated from scan lines that were vertical to a blood vessel oriented from left to right (*P = 0.02728 for Yoda1 cf DMSO in vein). Lower variance indicates less organised structure. n = 3 independent experiments and 3 replicates were used in each case. Superimposed data points are the coefficient of variance for individual images (DMSO, N = 9 and +Yoda1, N = 9).
Fig. 3
Fig. 3. PECAM1 suppresses PIEZO1 function.
ag HUVEC data. Representative of 3 independent experiments, confocal images at low a and high b cell density, 24 and 48 h after plating. Cells were stained with αPECAM1 (red) and DAPI (nuclei, blue). Scale bar, 100 µm. c For experiments of the type in a and b, box plots of the number of nuclei per field of view at the 24 and 48 h time-points (n = 3, **P = 0.00264). Superimposed data points are nuclei numbers for individual images (24 h, N = 9 and 4 h, N = 9). d Representative western blot and e quantification of the PECAM1 in such blots d normalised to β-actin (mean ± s.e. mean, n = 3, *P = 0.04216, two sample t-test). Superimposed data points are quantification of independent western blots. f, g As for a and b but fura2-based Ca2+ measurement data. f Representative time-series traces showing effects of 3 μM Yoda1 at the two cell-culture time-points, compared with vehicle control DMSO (3 replicates per data point). g For data of the type in f, mean ± s.e.mean (n = 3) for peak Ca2+ signals evoked by Yoda1 (**P = 0.00705, two sample t-test). Superimposed data points are the mean intensity ratios for each independent repeat. hk Data from outside-out patch recordings on T-Rex™-293 cells. h Example original current traces for empty cells without incorporation of PIEZO1 (No PIEZO1) or T-REx-293 cells with tetracycline-induced expression of human PIEZO1 after transient transfection with SYFP2 (PIEZO1 + SYFP2) or human PECAM1-SYFP2 (PIEZO1 + PECAM1-SYFP2). The holding potential was −80 mV and 200-ms positive pressure pulses were applied from 0 to 105 mmHg in 15 mmHg increments at intervals of 12 s as illustrated above the current traces (traces for 90 and 105 mmHg are highlighted in blue and green respectively). i Average PIEZO1 currents for cells transfected with SYFP2 (n = 12) or PECAM1-SYFP2 (n = 13) for each of the indicated pressure steps. j For the same type of data as h, electric charge compared at 90 mmHg for the two groups, suggesting statistically significant difference by t-test (*P = 0.01797). Superimposed individual data points for PIEZO1 + SYFP2 (black, n = 12) and PIEZO1 + PECAM1-SYFP2 (red, n = 15). k For the same type of data as h, mean ± S.D. and superimposed individual data points for PIEZO1 + SYFP2 (black, n = 11) and PIEZO1 + PECAM1-SYFP2 (red, n = 15), showing integrated electrical charge per pressure step plotted against pressure. F-test indicated statistically significant different between the pressure curves of the two conditions (***P = 7.45 × 10⁻⁸).
Fig. 4
Fig. 4. PECAM1 drives PIEZO1 to cell-cell junctions.
Data are for non-permeabilised COS-7 cells expressing human PIEZO1-mTurquoise2 with human PECAM1-SYFP2. al FRET/FLIM studies. a PIEZO1-mTurquoise2 alone. The intensity image in which white is high intensity and lifetime image calibrated to the rainbow scale (3.5–4.2 ns). The white arrows point to a region of cell-cell contact and the orange arrowheads nucleus (N) and endoplasmic reticulum (ER). The graph on the right is the lifetime distribution with the limits of the rainbow scale indicated by vertical lines. b Similar to a except PIEZO1-mTurquoise2 with PECAM1-SYFP2 (+PECAM1). a, b Scale bars, 50 µm. c Box plot presentation of summary data of the type shown in a and b, showing peak lifetime for the entire cell (Whole cell). n = 4 independent experiment repeats for PIEZO1-mTurquoise2 alone (−PECAM1, black) and PIEZO1-mTurquoise2 plus PECAM1-SYFP2 cells (+PECAM1, red). ***P = 3.16 ×10⁻⁵. The superimposed data points are average lifetimes for different images, −PECAM1 (N = 11) and +PECAM1 (N = 13). dh Data are for COS-7 cells expressing PIEZO1-mTurquoise2 only (−PECAM1) or co-expressing PIEZO1-mTurquoise2 and PECAM1-SYFP2 in which PECAM1 was mutated at the indicated amino acid residue. Box plot presentations of FRET/FLIM peak lifetime data measured at: d Non-junctional (intracellular) regions (*PC622A = 0.0381,***PY663F = 5.98 ×10⁻⁴; *P Y690F = 0.0431, *PS700F = 0.02136, PY713F = 0.13532); e Cell-cell junction regions (*PC622A = 0.014, ***PY663F = 3.56 ×10⁻⁴, ***PY690F = 7.76 ×10⁻⁴, ***PS700F = 2.07 ×10⁻⁴, PY713F = 0.1024). Data are for n = 3 independent experiment repeats. The superimposed data points are average lifetimes for different images, −PECAM1 (Nnon junctional = 21 and Njunctional = 18), +C622A (Nnon junctional = 8 and Njunctional = 7), +Y663F (Nnon junctional = 9 and Njunctional = 8), +Y690F (Nnon junctional = 8 and Njunctional = 7), +S700F (Nnon junctional = 12 and Njunctional = 10), +Y713F (Nnon junctional = 9 and Njunctional = 6). Confocal images showing sub cellular distribution of f wild-type (WT) PECAM1, g Y713F and h C622A as SYFP2 fluorescence and after immunostaining using antibody to PECAM1 extracellular domain (αPECAM1) in non-permeabilised cells. Images are representative of n = 3 independent experiments. Scale bars, 50 µm. il Data are for COS-7 cells expressing PIN-G-tagged N-terminal PECAM1-ex-SYFP2 alone (PECAM1-ex) or with PIEZO1-mTurquoise2. i Confocal image showing sub cellular distribution of PECAM1-ex. j Intensity images and lifetime image calibrated to the rainbow scale indicated at the top right corner (3.5–4.2 ns). Scale bar, 50 µm, applies to all images. Box plot presentations of FRET/FLIM peak lifetime data measured at: k Cell-cell junctions (***P = 4.12 ×10⁻⁴); l Non-junctional regions (P = 0.18533). Data are for n = 3 independent experiment repeats. The superimposed data points are average lifetime values junctions (−PECAM1ext, N = 9 and +PECAM1ext, N = 9) and non-junctions (−PECAM1ext, N = 9 and +PECAM1ext, N = 9) from separate images.
Fig. 5
Fig. 5. CDH5 but not VGFR2 partners with PIEZO1.
ad FRET/FLIM images and analysis for COS-7 cells expressing a PIEZO1-mTurquoise2 plus CDH5-mVenus (CDH5-mVenus) or b PIEZO1-mTurquoise2 plus VGFR2-SYFP2. a, b Intensity images (white, high intensity), lifetime images calibrated to the rainbow scale indicated at the top corner (3.5–4.2 ns) and graphs of the lifetime distributions in which grey vertical lines indicate the rainbow scale limits. Scale bars, 50 µm, apply to all images. c, d Box plot summary peak whole cell lifetime data for the experiment types of a and b. 3 independent experimental repeats for PIEZO1-mTurquoise2 alone (-CDH5/VGFR2, black) and PIEZO1-mTurquoise2 plus CDH5-mVenus (***P = 7.68 ×10⁻⁴) or VGFR2-SYFP2 (P = 0.72393) (+CDH5/VGFR2, red). Superimposed data points are average lifetime values for individual images (−CDH5, N = 9; +CDH5, N = 9; −VEFGR2, N = 9; +VGFR2, N = 9). ej Images and image analysis for retinal veins of HA-PIEZO1 mice (PIEZO1HA) or wild-type (WT) mice (PIEZO1WT) immuno-stained with αCDH5 antibody (green) and αHA antibody (grey). e, f Representative images for αCDH5 and αHA staining with merger of these images to the right. Scale bars, 20 µm. g, h are the line-intensity (grey value) plots for the vertical scan lines superimposed on the Merge images of e and f. Green αCDH5, grey αHA. Light grey highlighting indicates cell-cell junctions. i, j Box-plot quantification of image intensity for e PIEZO1HA or f PIEZO1WT retinal veins stained with αHA, shown for junctional regions indicated by αCDH5 staining (+CDH5) and non-junctional regions (−CDH5) in arbitrary fluorescence units (AFU). The intensity of each image was normalised to the image background. **P = 0.00347. Data are for n = 3 independent experiments. The superimposed data points are the average intensity for individual images, PIEZO1HA (−CDH5, N = 13 and +CDH5, N = 13) PIEZO1WT (−CDH5, N = 10 and +CDH5, N = 10).
Fig. 6
Fig. 6. CDH5 partnering is shear stress dependent.
COS-7 cell data obtained by FRET/FLIM after expressing PIEZO1-mTurquoise2 with (+) or without (−): ae PECAM1-SYFP2 (PECAM1); fj CDH5-mVenus (CDH5). Prior to imaging, cells were preconditioned for 24 h with laminar shear stress (10 dyn.cm−2) followed by static condition for 30 min and then 10 min 10 dyn.cm−2 (shear) or continued static condition (static). For 3 independent experiments each, the box plots show the lifetimes for PIEZO1-mTurquoise2 at cell-cell junctions: e +PECAM1 ***P = 2.64 ×10⁻⁴ shear and ***P = 1.37 ×10⁻⁴ static, both compared with –PECAM1; j +CDH5 ***P = 2.63 ×10⁻⁴ shear and **P = 0.0079 static, both compared with –CDH5. +CDH5 shear cf + CDH5 static **P = 0.00036 and the lifetimes for PIEZO1-mTurquoise2 at non junctional regions: d +PECAM1 **P = 0.0021 shear and *P = 0.011 static, both compared with –PECAM1; i +CDH5 showed no significant differences to the –CDH5 under shear and static conditions. The superimposed data points are for individual junctions (N = 9) and non-junctions (N = 9) from separate images. P values are from Mann–Whitney tests with Bonferroni correction.
Fig. 7
Fig. 7. PIEZO1 increases junction width and radial actin.
HUVEC data. af Cells cultured in a confluent monolayer treated with a control (Ctrl) or b PIEZO1 siRNA and subjected to extracellular Ca2+ switch assay: pre-treatment (normal Ca2+); −calcium (30 min Ca2+-depletion); and recovery (+calcium (post); 30 min after restoring Ca2+). After treatments, cells were stained with anti-CDH5 antibody (αCDH5) (green). The scale bars are 100 µm. c Images are enlarged from the white boxes in a, b +calcium (post). To the right are line-intensity plots (black) with a Gaussian fit (red) used to calculate peak width at half maximum for the superimposed grey lines shown in the enlarged images. d, e As for a and b but showing box plots for +calcium pre-treatment (n = 3, P = 0.92988) and +calcium (post) (n = 3, ***P = 8.86242 ×10⁻⁵) conditions. Superimposed data points are measurements from individual cell-cell junctions for +calcium (pre) (Ctrl si = 89, PIEZO1 si = 90) and +calcium (post) (Ctrl si = 87, PIEZO1 si = 88). f Enlarged and merged images of CDH5 (green, from a, b) and F-actin (phalloidin) (magenta, from Supplementary Fig. 21a, b) staining for the calcium switch recovery (+calcium (post); 30 min after restoring Ca2+) conditions in Ctrl or PIEZO1 siRNA treated HUVECs. Scale bars are 25 µm g Schematic representation of F-actin and CDH5 with (+) and without (−) PIEZO1 or PIEZO1 activation by mechanical force, based on the data of af and Supplementary Fig. 21. In the +PIEZO1 condition, there is suggested to be junctional remodelling with more radial actin and wider (less tight and more leaky) junctions.
Fig. 8
Fig. 8. Model for PIEZO1 and PECAM1 partnership.
Sketch of part of two adjacent endothelial cells with a cell-cell junction in between. The junction is 15–30 nm in reality and so much narrower than apparent in the sketch. The junction includes adherens and tight junctions, but only the adherens junction is referred to here. Two pools of PIEZO1 channels are proposed. One pool is in the apical membrane of the endothelial cell and suggested to be particularly involved in sensing force as part of the shear stress sensing machinery. The other pool is in the adherens junction membrane of the endothelial cell and suggested to be particularly involved in sensing forces such as membrane tension as part of the adherens junction force sensing machinery. Force sensing is suggested to be mediated by PIEZO1 channels in both cases, leading to local and distance signalling to modulate endothelial cell function. Integration between the pools is envisaged to coordinate apical and junctional membrane events. PIEZO1 channels are Ca2+-permeable non-selective cation channels and so local intracellular Ca2+ elevation and extracellular Ca2+ depletion are likely when the channels open and this may contribute to regulation of nearby mechanisms, such as F-actin and the adhesion molecules PECAM1 and CDH5. We suggest also direct interaction between PIEZO1 and the adhesion molecules that is important both for localising PIEZO1 to junctions and regulating junctional structure once PIEZO1 is at the junctions. Negative feedback is suggested to occur from PECAM1 to PIEZO1 as junctional intensity increases to enable PIEZO1’s role in driving junctional remodelling to be suppressed once remodelling is complete and junctions need to return to a tighter, less leaky, state.

References

    1. Wettschureck N, Strilic B, Offermanns S. Passing the vascular barrier: endothelial signaling processes controlling extravasation. Physiol. Rev. 2019;99:1467–1525. doi: 10.1152/physrev.00037.2018. - DOI - PubMed
    1. Schmidt EP, Kuebler WM, Lee WL, Downey GP. Adhesion molecules: master controllers of the circulatory system. Compr. Physiol. 2016;6:945–973. doi: 10.1002/cphy.c150020. - DOI - PubMed
    1. Chiu JJ, Chien S. Effects of disturbed flow on vascular endothelium: pathophysiological basis and clinical perspectives. Physiol. Rev. 2011;91:327–387. doi: 10.1152/physrev.00047.2009. - DOI - PMC - PubMed
    1. Baeyens N, Bandyopadhyay C, Coon BG, Yun S, Schwartz MA. Endothelial fluid shear stress sensing in vascular health and disease. J. Clin. Investig. 2016;126:821–828. doi: 10.1172/JCI83083. - DOI - PMC - PubMed
    1. Gulino-Debrac D. Mechanotransduction at the basis of endothelial barrier function. Tissue Barriers. 2013;1:e24180. doi: 10.4161/tisb.24180. - DOI - PMC - PubMed

Publication types

MeSH terms

Substances