. 2023 Apr 1;18(1):20.
doi: 10.1186/s13024-023-00613-8.

Cerebrospinal fluid lipoproteins inhibit α-synuclein aggregation by interacting with oligomeric species in seed amplification assays

Affiliations

Cerebrospinal fluid lipoproteins inhibit α-synuclein aggregation by interacting with oligomeric species in seed amplification assays

Giovanni Bellomo et al. Mol Neurodegener. .

Abstract

Background: Aggregation of α-synuclein (α-syn) is a prominent feature of Parkinson's disease (PD) and other synucleinopathies. Currently, α-syn seed amplification assays (SAAs) using cerebrospinal fluid (CSF) represent the most promising diagnostic tools for synucleinopathies. However, CSF itself contains several compounds that can modulate the aggregation of α-syn in a patient-dependent manner, potentially undermining unoptimized α-syn SAAs and preventing seed quantification.

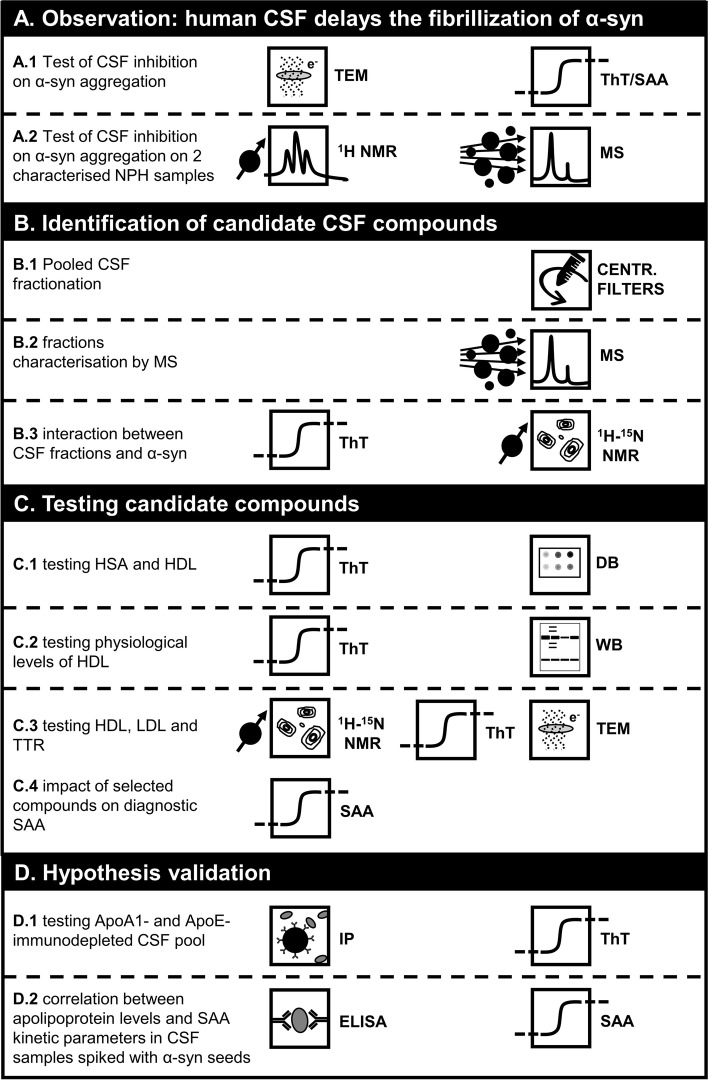
Methods: In this study, we characterized the inhibitory effect of CSF milieu on detection of α-syn aggregates by means of CSF fractionation, mass spectrometry, immunoassays, transmission electron microscopy, solution nuclear magnetic resonance spectroscopy, a highly accurate and standardized diagnostic SAA, and different in vitro aggregation conditions to evaluate spontaneous aggregation of α-syn.

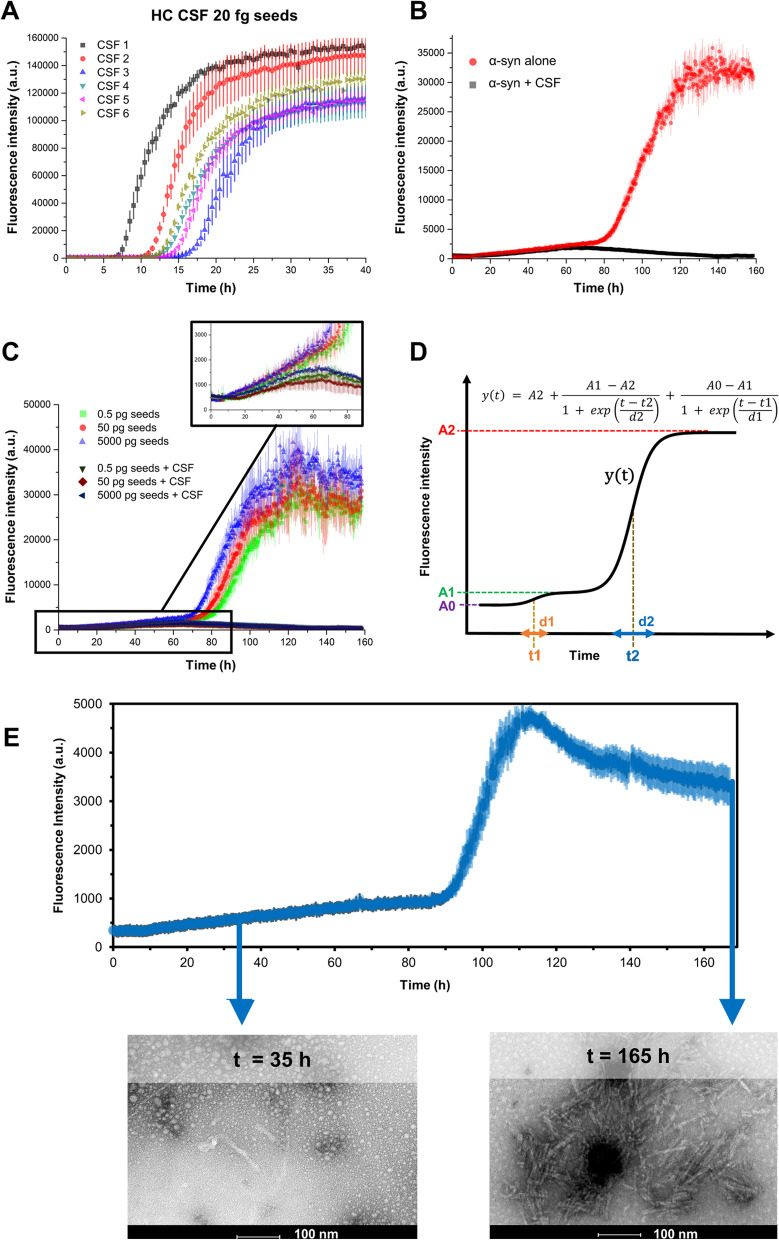
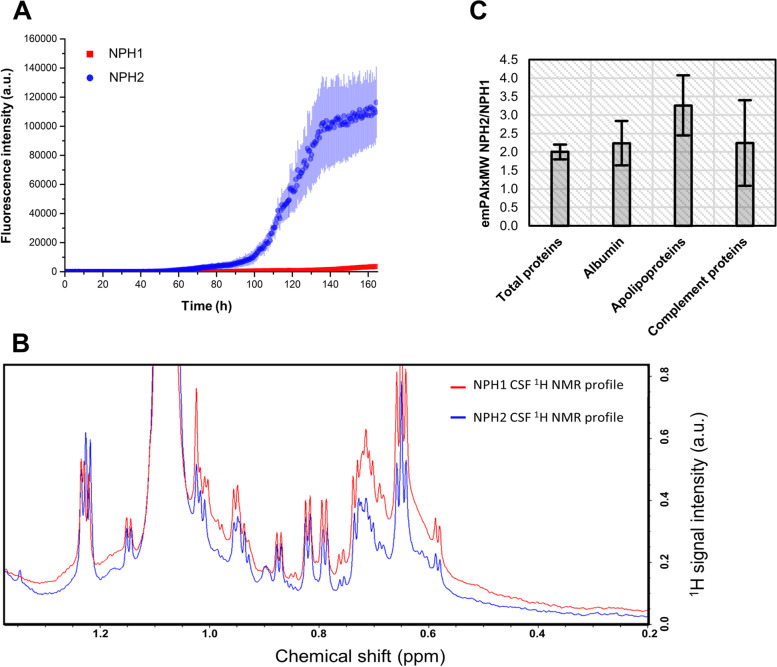
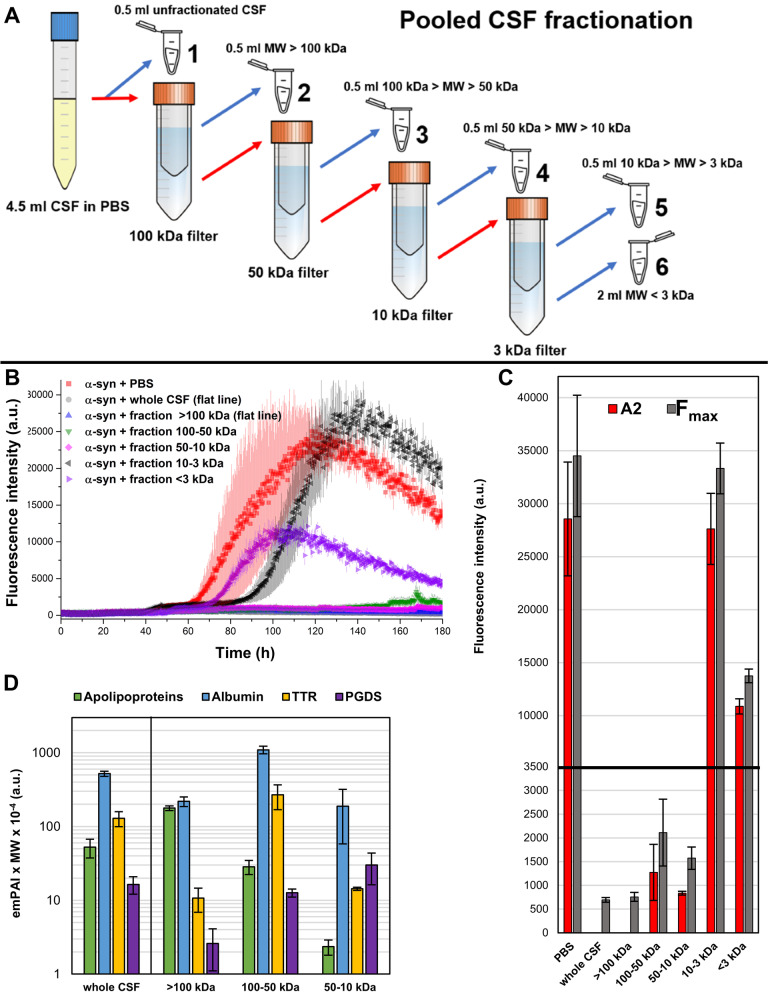
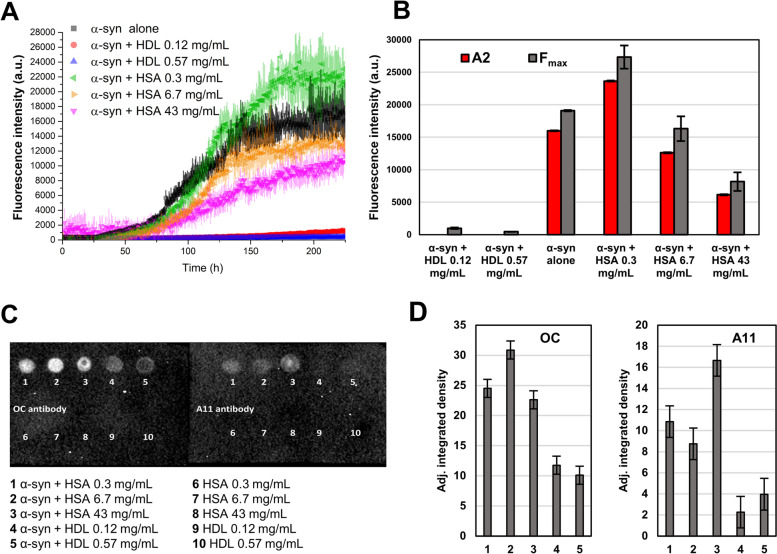
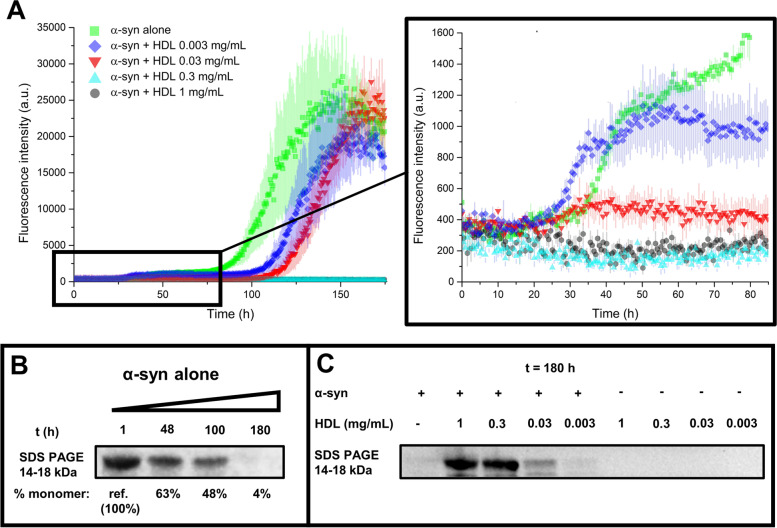
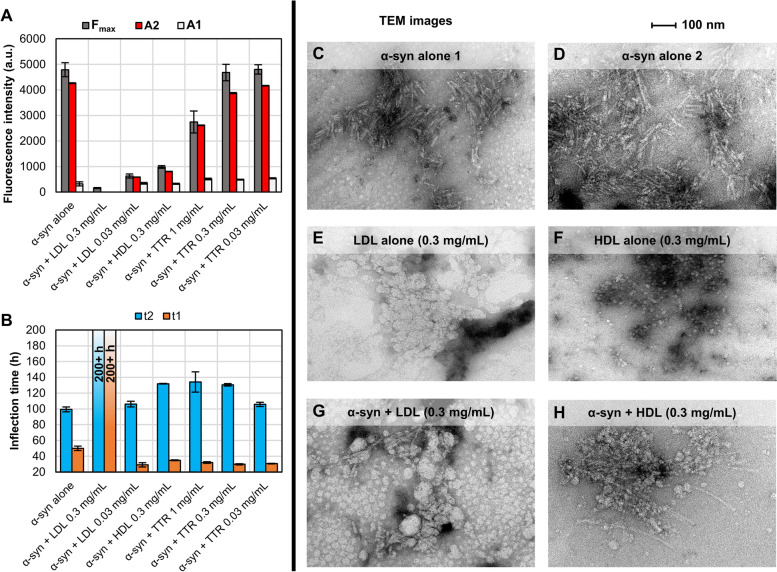
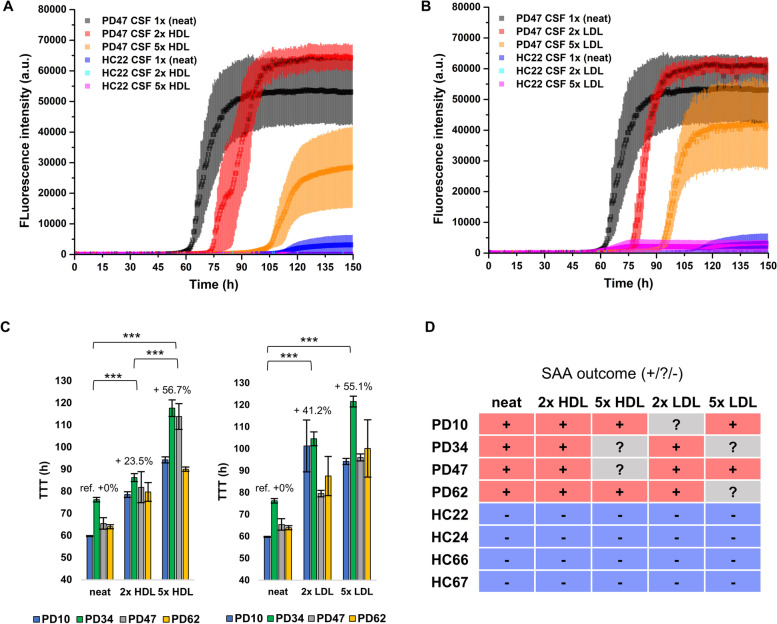
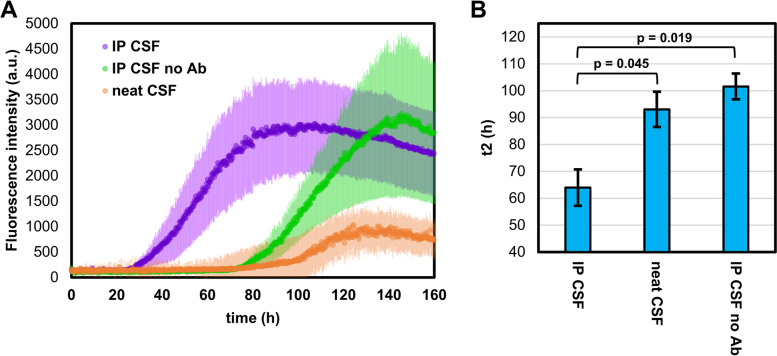
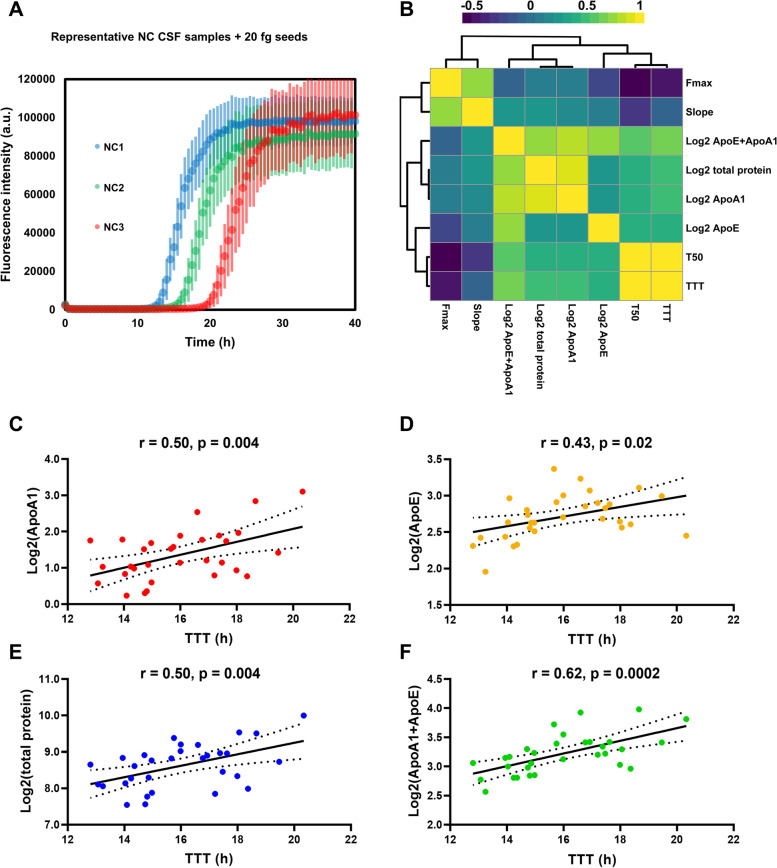
Results: We found the high-molecular weight fraction of CSF (> 100,000 Da) to be highly inhibitory on α-syn aggregation and identified lipoproteins to be the main drivers of this effect. Direct interaction between lipoproteins and monomeric α-syn was not detected by solution nuclear magnetic resonance spectroscopy, on the other hand we observed lipoprotein-α-syn complexes by transmission electron microscopy. These observations are compatible with hypothesizing an interaction between lipoproteins and oligomeric/proto-fibrillary α-syn intermediates. We observed significantly slower amplification of α-syn seeds in PD CSF when lipoproteins were added to the reaction mix of diagnostic SAA. Additionally, we observed a decreased inhibition capacity of CSF on α-syn aggregation after immunodepleting ApoA1 and ApoE. Finally, we observed that CSF ApoA1 and ApoE levels significantly correlated with SAA kinetic parameters in n = 31 SAA-negative control CSF samples spiked with preformed α-syn aggregates.

Conclusions: Our results describe a novel interaction between lipoproteins and α-syn aggregates that inhibits the formation of α-syn fibrils and could have relevant implications. Indeed, the donor-specific inhibition of CSF on α-syn aggregation explains the lack of quantitative results from analysis of SAA-derived kinetic parameters to date. Furthermore, our data show that lipoproteins are the main inhibitory components of CSF, suggesting that lipoprotein concentration measurements could be incorporated into data analysis models to eliminate the confounding effects of CSF milieu on α-syn quantification efforts.

Keywords: Cerebrospinal fluid; Lipoproteins; RT-QuIC; Seed amplification assays; α-synuclein.


Conflict of interest statement

The authors declare the following competing financial interest(s): Prof. Parnetti served as Member of Advisory Boards for Fujirebio, IBL, Roche and Merck. Dr. Concha, Ms. Farris, and Mr. Ma are inventors on several patents related to SAA technology (PMCA) and are associated to Amprion Inc., a biotech company focused on the commercial utilization of SAA for diagnosis. All the other authors declare no financial and non-financial competing interests.

Figures

Fig. 1
Fig. 1
Scheme summarizing the pipeline and techniques used in the present work. Icon legend. TEM: transmission electron microscopy; ThT: thioflavin-T protein aggregation assay; SAA: α-synuclein seed amplification assay; 1H NMR: solution proton magnetic resonance spectroscopy; MS: mass spectrometry; CENTR. FILTERS: centrifugal filters; 1H-15N NMR: 2D proton-nitrogen solution nuclear magnetic resonance spectroscopy; DB: dot blot assay; WB: Western blot assay; IP: immunoprecipitation; ELISA: enzyme-linked immunosorbent assay
Fig. 2
Fig. 2
CSF inhibits α-syn aggregation in unseeded and seeded conditions in a patient-dependent manner. A Six different human HC CSF samples (40 µL) spiked with 20 fg synthetic preformed α-syn fibrils (seeds) and analysed by diagnostic SAAs conditions: 0.3 mg/mL (19.6 µM) of recombinant α-syn in 100 mM PIPES pH 6.5 and 500 mM NaCl, 200 µL final volume. B Protein aggregation assay performed using 0.7 mg/mL of recombinant α-syn in PBS with (black) and without (red) 40 μL of NC CSF pool (final volume of 200 μL). C Seed amplification assay in PBS of different amounts of synthetic seeds (0.5, 5, 50, 500 and 5,000 pg) with and without NC pooled CSF (only 3 seed masses shown). D Graphical description of the fitting function used. A2 fits the fluorescence value of the second plateau, A1 fits the fluorescence value of the first plateau and A0 fits the baseline fluorescence. The time parameters t1 and t2 fit the first and the second inflection points, respectively, while d1 and d2 represent the slopes of the sigmoids. E Protein aggregation assay performed using 0.7 mg/mL of recombinant α-syn in PBS (final volume of 200 μl). Six glass beads with a diameter of 1 mm were added in each well. The shaking/incubation protocol consisted in 1 min shaking at 500 rpm and 14 min rest at 37 °C. The experiment was performed in quintuplicate; three replicates were used to produce the above reported average aggregation profile, the other two replicates were collected from the plate at t = 35 h and t = 165 h, and analysed by TEM to produce the representative images shown in the bottom of panel E). All ThT fluorescence traces are represented as average intensity over 3 replicates with error bars representing SEM
Fig. 3
Fig. 3
Analysis of NPH CSF samples. A Protein aggregation assay performed using 0.7 mg/mL of recombinant α-syn in PBS with 40 μl of CSF from 2 NPH subjects (40 µL). The two ThT fluorescence traces are represented as average intensity over 3 replicates with error bars representing the SEM. B Portion of 1D 1H NMR spectra relative to the two NPH CSF samples. C Relative concentration (emPAI score multiplied by protein molecular weight) ratio of total protein and the three most abundant protein constituents measured by nLC-nESI HRMS/MS in neat NPH1 and NPH2 CSF samples. Approximately 200 and 400 different proteins were detected in NPH1 and NPH2, respectively. Albumin was the most abundant protein followed by apolipoproteins and complement proteins. Apolipoproteins scores were summed together, with ApoA1 and ApoE being the most abundant (~ 85% of the total). Complement C3 and C4 were found as the most abundant complement proteins (~ 65% of the total)
Fig. 4
Fig. 4
Different CSF fractions differently affect α-syn aggregation. A Scheme of the CSF fractionation procedure. From a starting aliquot of 4.5 mL of CSF in PBS 1x, we collected 6 aliquots containing compounds of different molecular weight and froze them in liquid nitrogen. After every filtration with centrifugal filters, the flow-through of the filtered fraction was passed to a filter with smaller cut-off. B The addition of CSF fractions, whole NC-CSF pool, and PBS (40 μL) was analysed by ThT protein aggregation assay to evaluate effects on α-syn spontaneous aggregation. Background signal was corrected by subtracting the average fluorescence of three replicates containing PBS, whole CSF and CSF fractions without α-syn. All ThT fluorescence traces are represented as average intensity over 3 replicates with error bars representing the SEM. C Mean fitted A2 parameters (fitting was not possible for samples with whole CSF and the > 100 kDa fraction) and maximum fluorescence values (Fmax) estimated from individual ThT traces. Two scales of fluorescence intensity were used to better compare the results. Represented values correspond to the average of three replicates with error bars reflecting the SEM. D Relative concentration (emPAI score multiplied by protein molecular weight) of the most abundant protein constituents measured by nLC-nESI HRMS/MS. Apolipoproteins scores were summed together, with ApoA1 and ApoE being the most abundant (~ 85% of the total). Scores for fractions 10–3 and < 3 kDa are not shown since the protein content of these fractions was negligible with respect to the others
Fig. 5
Fig. 5
HDL reduces α-syn aggregation more efficiently than HSA. A ThT protein aggregation assay performed using 0.7 mg/mL of recombinant α-syn in PBS pH 7.4 in the presence of different concentrations of HSA (0, 0.3, 6.7 and 43 mg/mL) and HDL (0, 0.12 and 0.57 mg/mL). To remove the background fluorescence, the average fluorescence of three replicates containing the same amount of HSA and HDL without α-syn was subtracted prior to the analysis. The data represent the average fluorescence of three replicates with error bars representing the SEM. B Fmax and fitted A2 parameters fitted from individual traces and averaged on the three replicates are shown. C Inverted and window/level-adjusted image of the dot-blot assay performed on the final reaction products of HSA and HDL-containing samples. Dot-blots were probed with OC (detection of fibrils) and A11 (detection of amorphous oligomers) conformational antibodies. D Adjusted (background subtracted) integrated density measured in a circular region of interest (0.35 cm2) surrounding dots relative to samples 1–5 with error bars representing the standard deviation of the background noise. The average grey level is significantly lower (p < 0.001) for samples with HDL with respect to all the HSA concentrations tested by applying two-tailed Student’s t-test both for OC and A11 antibodies
Fig. 6
Fig. 6
HDL reduces α-syn aggregation even at CSF physiological (ca. 0.03 mg/mL) and sub-physiological levels by preventing the formation of transient oligomeric/protofibrillary species. A Protein aggregation assay performed using 0.7 mg/mL of recombinant α-syn in PBS with 0, 0.003, 0.03, 0.3 and 1 mg/mL of added human serum HDL. To remove the background fluorescence, the average fluorescence of three replicates containing the same amounts of HDL without α-syn was subtracted prior to the analysis. All ThT fluorescence traces are represented as average intensity over 3 replicates with error bars representing SEM. B The presence of monomeric α-syn (14–18 kDa) in samples collected at different timepoints of the spontaneous aggregation process were monitored by WB using Syn211 antibody. Monomeric α-syn decreases as t increases due to the formation of fibrils. C In a similar way, a WB with Syn211 was performed on the reaction products obtained after 180 h, at different HDL concentrations with and without α-syn
Fig. 7
Fig. 7
HDL and LDL impede α-syn aggregation more efficiently than TTR. Lipoproteins exert their anti-aggregation properties by interlacing to early protofibrillary/oligomeric species. A-B Fitted kinetic parameters of a Protein aggregation assay performed using 0.7 mg/mL of recombinant α-syn in PBS with different concentrations of LDL, HDL and TTR. The average fluorescence of three replicates containing the same amounts of LDL, HDL and TTR without α-syn was subtracted prior to the analysis. C-H TEM images relative to the final products obtained using (C-D) α-syn alone (0.7 mg/mL), (E) LDL 0.3 mg/mL alone, (F) HDL 0.3 mg/mL alone, and a combination of both α-syn 0.7 mg/mL + LDL 0.3 mg/mL (G) or HDL 0.3 mg/mL (H)
Fig. 8
Fig. 8
HDL and LDL significantly modulate α-syn aggregation in SAAs. A-B Representative SAAs traces performed on a neat PD (PD47) CSF sample and on a neat HC (HC22) CSF sample (1 × physiological concentration) and the same samples spiked with 0.006 mg/mL (2 × physiological concentration) and 0.024 mg/mL (5 × physiological concentration) HDL or LDL. The average kinetic traces with error bars representing the SEM calculated on three replicates of wells containing CSF additioned with HDL and LDL are shown in panels A and B, respectively. C-D Average time-to-threshold (TTT) values measured in all the PD samples. The average TTT and SEM were calculated by assuming a TTT of 125 h (maximum TTT observed) for replicates in which aggregation was not considered significant (Fmax < 5000 a.u.). One-way ANOVA coupled with Tukey post-hoc test was applied to assess the statistical significance of the observed relative differences of all the individual measured traces among neat, 2 × HDL/LDL and 5 × HDL/LDL. Significant differences were marked with * with *** indicating a p-value <  < 0.001. D Summary of the final SAA outcome for the analysed PD and HC samples. The outcome was categorized as: positive ( +) when 3/3 replicates were determined positive by the probabilistic algorithm, inconclusive (?) when 2/3 replicates were determined positive by the probabilistic algorithm, and negative (-) when just 1/3 or 0/3 replicates were determined positive by the probabilistic algorithm
Fig. 9
Fig. 9
Experiments on ApoA1- and ApoE-immunodepleted CSF. A Protein aggregation assay performed using 0.7 mg/mL of recombinant α-syn in PBS with 40 μL of: CSF subjected to ApoA1 and ApoE IP (IP CSF), CSF subjected to IP without antibodies (IP CSF no Ab) and neat CSF belonging to different aliquots of the same NC pool. To remove the background fluorescence, the average fluorescence of three replicates containing the same reaction mix without α-syn was subtracted prior to the analysis. All ThT fluorescence traces are represented as average intensity over 3 replicates with error bars representing the SEM. B Average t2 fitted parameters with error bars representing the SEM. P-values were calculated by applying one-way ANOVA followed by Tukey post-hoc test
Fig. 10
Fig. 10
CSF ApoA1, ApoE and total protein content significantly correlate with SAA time variables. A representative SAA ThT fluorescence traces relative to samples producing the shortest (NC1, TTT = 12.8 h), median (NC2, TTT = 15.8 h) and longest (NC3, TTT = 20.3 h) TTT averaged on three replicates. All ThT fluorescence traces are represented as average intensity over 3 replicates with error bars representing the SEM. B Heatmap summarizing correlations (Pearson’s) between SAA kinetic parameters and Log2-transformed CSF ApoA1, ApoE, ApoA1 + ApoE, and total protein. Hierarchical clustering was performed by using Ward linkage criterion. C-F scatter plots with detail of Pearson’s correlation coefficients and relative p-value for TTT vs Log2-transformed CSF concentrations (originally in μg/mL) of ApoA1 (C), ApoE (D), total protein (E), and ApoA1 + ApoE (F). Linear regression lines with their 95% confidence intervals (dotted lines) are also displayed

References

    1. Shahnawaz M, Tokuda T, Waragai M, Mendez N, Ishii R, Trenkwalder C, et al. Development of a Biochemical Diagnosis of Parkinson Disease by Detection of α-Synuclein Misfolded Aggregates in Cerebrospinal Fluid. JAMA Neurol. 2017;74:163–172. doi: 10.1001/jamaneurol.2016.4547. - DOI - PubMed
    1. Fairfoul G, McGuire LI, Pal S, Ironside JW, Neumann J, Christie S, et al. Alpha-synuclein RT-QuIC in the CSF of patients with alpha-synucleinopathies. Ann Clin Transl Neurol. 2016;3:812–818. doi: 10.1002/acn3.338. - DOI - PMC - PubMed
    1. Paciotti S, Bellomo G, Gatticchi L, Parnetti L. Are We Ready for Detecting α-Synuclein Prone to Aggregation in Patients? The Case of “Protein-Misfolding Cyclic Amplification” and “Real-Time Quaking-Induced Conversion” as Diagnostic Tools. Front Neurol. 2018;9:415. doi: 10.3389/fneur.2018.00415. - DOI - PMC - PubMed
    1. Bellomo G, Luca CMGD, Paoletti FP, Gaetani L, Moda F, Parnetti L. α-Synuclein Seed Amplification Assays for Diagnosing Synucleinopathies: The Way Forward. Neurology. 2022;99:195–205. doi: 10.1212/WNL.0000000000200878. - DOI - PubMed
    1. Iranzo A, Fairfoul G, Ayudhaya ACN, Serradell M, Gelpi E, Vilaseca I, et al. Detection of α-synuclein in CSF by RT-QuIC in patients with isolated rapid-eye-movement sleep behaviour disorder: a longitudinal observational study. Lancet Neurol. 2021;20:203–12. - PubMed

Publication types