. 2023 Apr 1;14(1):56.
doi: 10.1186/s13287-023-03285-9.

Development and validation of a glioma-associated mesenchymal stem cell-related gene prognostic index for predicting prognosis and guiding individualized therapy in glioma

Affiliations

Development and validation of a glioma-associated mesenchymal stem cell-related gene prognostic index for predicting prognosis and guiding individualized therapy in glioma

Zesheng Peng et al. Stem Cell Res Ther. .

Abstract

Background: Recent studies have demonstrated that glioma-associated mesenchymal stem cells (GA-MSCs) are implicated in the regulation of glioma malignant progression. However, the prognostic value of GA-MSCs has not been comprehensively explored in glioma.

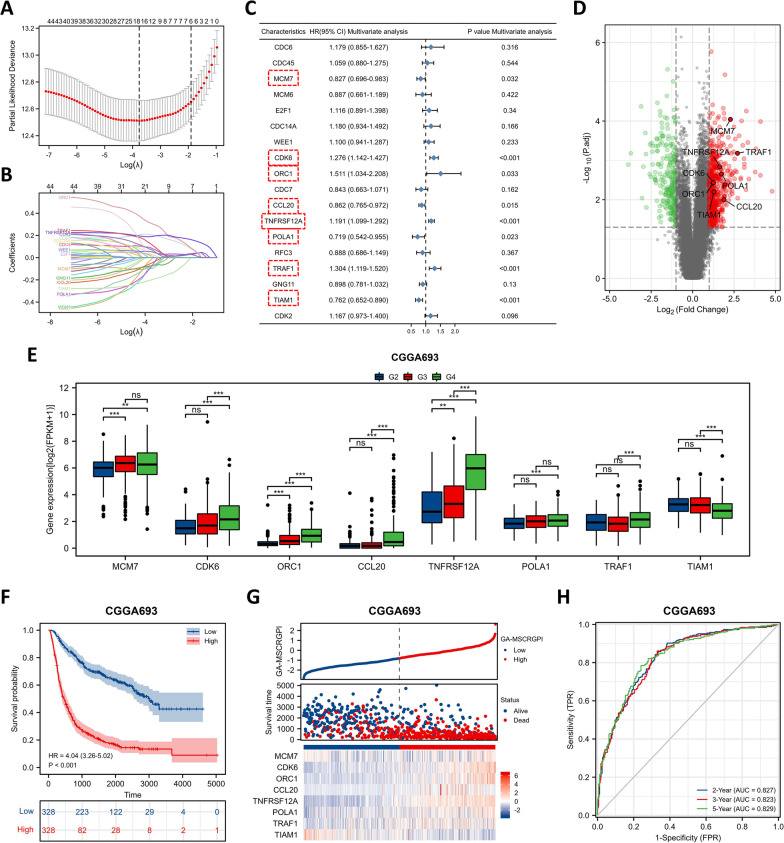
Methods: We extracted GA-MSCs from glioma tissues, established intracranial xenograft models in nude mice, and obtained GA-MSC-related genes (GA-MSCRGs) by using microarrays. The transcriptome data and clinical information of glioma patients were obtained from the CGGA and TCGA databases. We screened 8 prognostic GA-MSCRGs to construct a prognostic index by using the multivariate Cox regression method. The validity of the GA-MSCRGPI was verified in the training (CGGA693) and validation (TCGA and CGGA325) cohorts. The expression patterns of these 8 GA-MSCRGs were validated in 78 glioma tissue specimens by using a qRT‒PCR assay.

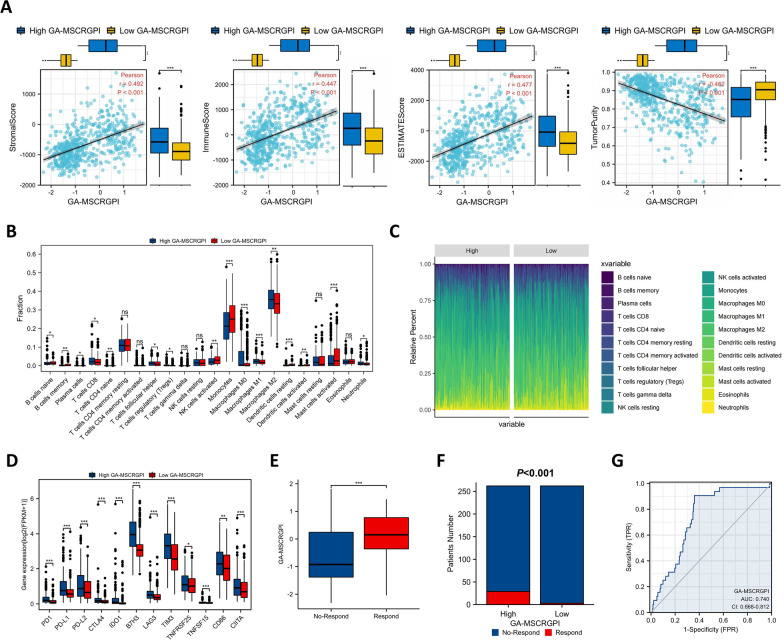
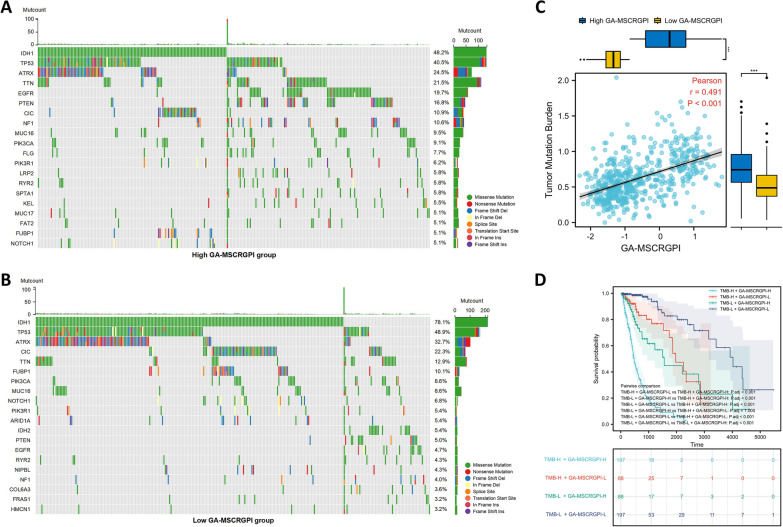
Results: GA-MSCs were successfully isolated from glioma tissues. Based on intracranial xenograft models and transcriptome microarray screening, 8 genes (MCM7, CDK6, ORC1, CCL20, TNFRSF12A, POLA1, TRAF1 and TIAM1) were selected for the construction of a GA-MSC-related gene prognostic index (GA-MSCRGPI). In both the training and validation cohorts, high GA-MSCRGPI patients showed an inferior survival outcome compared with low GA-MSCRGPI patients. A nomogram was established based on independent prognostic indicators (age, WHO grade and GA-MSCRGPI) and exhibited a strong forecasting ability for overall survival (OS). Moreover, we found that the GA-MSCRGPI could evaluate the prognosis of glioma patients undergoing chemoradiotherapy. The high GA-MSCRGPI group exhibited higher immune, stromal and ESTIMATE scores; lower tumor purity; higher infiltration of Tregs and M2-type macrophages; fewer activated NK cells; and higher expression of immune checkpoints. Tumor Immune Dysfunction and Exclusion (TIDE) showed that the high GA-MSCRGPI group had more responders to ICI therapy. The results of the genetic mutation profile and tumor mutation burden (TMB) in different GA-MSCRGPI subgroups further supplement GA-MSCRGPI-related mechanisms. Finally, the expression patterns of 8 selected GA-MSCRGs in GA-MSCRGPI were correlated with glioma WHO grades to a certain extent.

Conclusion: The constructed GA-MSCRGPI could predict prognosis and guide individualized therapy in glioma patients.

Keywords: Chemoradiotherapy; Genomic alterations; Glioma; Glioma-associated mesenchymal stem cells; Immune microenvironment; Immunotherapy; Prognosis.


Conflict of interest statement

The authors declare that they have no competing interests.

Figures

Fig. 1
Fig. 1
Identification of Prognostic GA-MSCRGs. A Morphological characteristics of GA-MSCs cultured in 10% FBS-containing DMEM (× 200, scale bars = 100 µm) and differentiation of GA-MSCs into adipocytes (× 200, scale bars = 100 µm), osteoblasts (× 400, scale bars = 50 µm) and chondrocytes (× 200, scale bars = 100 µm). B FACS analysis of typical GA-MSCs in vitro. C Construction of intracranial xenograft models with U87-MG cells and GA-MSCs (H&E staining, upper panels: × 25, scale bars = 1 mm; lower panels: × 400, scale bars = 50 µm). D Survival curves of intracranial xenograft mice. E Heatmap of 814 DEGs from xenograft tumors performed on U87-MG and U87-MG + GA-MSCs cells. “Red” indicates high relative expression, and “Blue” indicates low relative expression. F GSEA was performed in 814 DEGs (p < 0.05, FDR < 0.25). G Univariate Cox regression analysis of 54 DEGs in the CGGA693 cohort (HR, hazard ratio; CI: confidence interval)
Fig. 2
Fig. 2
Construction of the GA-MSCRGPI in the CGGA693 cohort. A, B LASSO regression was performed with the minimum criteria. C Multivariate Cox regression was used to construct a GA-MSCRGPI (8 GA-MSCRGs for modeling are shown in red squares). D The volcano map shows the distribution of 8 selected GA-MSCRGs in 814 DEGs (“red” indicates high relative expression, and “green” indicates low relative expression). E Expression comparison of 8 selected GA-MSCRGs between different grades of glioma tissues in the CGGA693 cohort (G2: WHO grade II, G3: WHO grade III, G4: WHO grade IV; **p < 0.01, ***p < 0.001, and ns: no significance). F Kaplan‒Meier curves of GA-MSCRGPI subgroups for survival. G The distribution plots of GA-MSCRGPI, survival status and expression of 8 selected GA-MSCRGs. H ROC curve analysis of GA-MSCRGPI in predicting 2-, 3- and 5-year OS
Fig. 3
Fig. 3
Correlation analysis between the GA-MSCRGPI and clinicopathological characteristics in both the training and validation cohorts. A, C, E Different levels of GA-MSCRGPI in glioma patients stratified by age, sex, grade, IDH status, 1p19q codeletion and MGMT promoter status (**p < 0.01, ***p < 0.001, ****p < 0.0001, and ns No significance). B, D F Forest maps showing the survival outcomes of subgroups stratified by these clinicopathological characteristics
Fig. 4
Fig. 4
Establishment and evaluation of a nomogram. A, B Univariate and multivariate Cox regression analyses in the CGGA693 cohort. C Nomogram based on GA-MSCRGPI, age and WHO grade. D, E, F Calibration curves showed the concordance between predicted and observed 2-, 3-, and 5-year OS in CGGA693, TCGA and CGGA325. G, H, I) ROC curve analyses of the nomogram in predicting 2-, 3-, and 5-year OS in CGGA693, TCGA, and CGGA325
Fig. 5
Fig. 5
Exploration of the association between GA-MSCRGPI and chemoradiotherapeutic efficacy. A Survival outcomes between high and low GA-MSCRGPI subgroups in patients who were treated with TMZ at any time. B, C Stratification analysis according to MGMT promoter status. Kaplan‒Meier curves showed survival differences between the high and low GA-MSCRGPI subgroups. D The OS between high and low GA-MSCRGPI subgroups in patients with radiotherapy. E, F Kaplan‒Meier curves of different GA-MSCRGPI subgroups in low- and high-grade patients with radiotherapy
Fig. 6
Fig. 6
Immune features and response to ICI therapy of different GA-MSCRGPI subgroups. A Association between immune score, stromal score, ESTIMATE score, tumor purity, and GA-MSCRGPI and their distribution in the low and high GA-MSCRGPI subgroups. B The infiltration of 22 immune cells in the high and low GA-MSCRGPI subgroups. C The proportions of 22 immune cells in different GA-MSCRGPI subgroups. D The expression of 12 immune checkpoints between different GA-MSCRGPI subgroups. E The comparison of GA-MSCRGPI between responders and nonresponders. F The distribution of ICI therapy responders in different GA-MSCRGPI subgroups. G ROC curve analysis of GA-MSCRGPI in predicting the response to ICI therapy. *p < 0.05, **p < 0.01, ***p < 0.001, and ns No significance
Fig. 7
Fig. 7
The mutation profile and TMB of different GA-MSCRGPI subgroups. A, B Mutation profile in high and low GA-MSCRGPI subgroups. C Association between TMB and GA-MSCRGPI and its distribution in the low and high GA-MSCRGPI subgroups. D Kaplan‒Meier curves of different TMB and GA-MSCRGPI subgroups for survival. ***p < 0.001
Fig. 8
Fig. 8
Validation of the expression levels of 8 selected GA-MSCRGs. Expression of MCM7 (A), CDK6 (B), ORC1 (C), CCL20 (D), TNFRSF12A (E), POLA1 (F), TRAF1 (G) and TIAM1 (H) in our glioma specimen cohorts (G2: WHO grade II, G3: WHO grade III, G4: WHO grade IV, *p < 0.05, **p < 0.01, ***p < 0.001, and ns: no significance)

Similar articles

Cited by

References

    1. Louis DN, Perry A, Wesseling P, Brat DJ, Cree IA, Figarella-Branger D, et al. The 2021 WHO classification of tumors of the central nervous system: a summary. Neuro Oncol. 2021;23:1231–1251. doi: 10.1093/neuonc/noab106. - DOI - PMC - PubMed
    1. Nicholson JG, Fine HA. Diffuse glioma heterogeneity and its therapeutic implications. Cancer Discov. 2021;11:575–590. doi: 10.1158/2159-8290.CD-20-1474. - DOI - PubMed
    1. Reifenberger G, Wirsching HG, Knobbe-Thomsen CB, Weller M. Advances in the molecular genetics of gliomas - implications for classification and therapy. Nat Rev Clin Oncol. 2017;14:434–452. doi: 10.1038/nrclinonc.2016.204. - DOI - PubMed
    1. Aldape K, Zadeh G, Mansouri S, Reifenberger G, von Deimling A. Glioblastoma: pathology, molecular mechanisms and markers. Acta Neuropathol. 2015;129:829–848. doi: 10.1007/s00401-015-1432-1. - DOI - PubMed
    1. Lapointe S, Perry A, Butowski NA. Primary brain tumours in adults. Lancet. 2018;392:432–446. doi: 10.1016/S0140-6736(18)30990-5. - DOI - PubMed

Publication types

LinkOut - more resources