Review
. 2023 Dec;61(12):628-653.
doi: 10.1002/mrc.5350. Epub 2023 Apr 17.

Multiplatform untargeted metabolomics

Affiliations
Review

Multiplatform untargeted metabolomics

Micah J Jeppesen et al. Magn Reson Chem. 2023 Dec.

Abstract

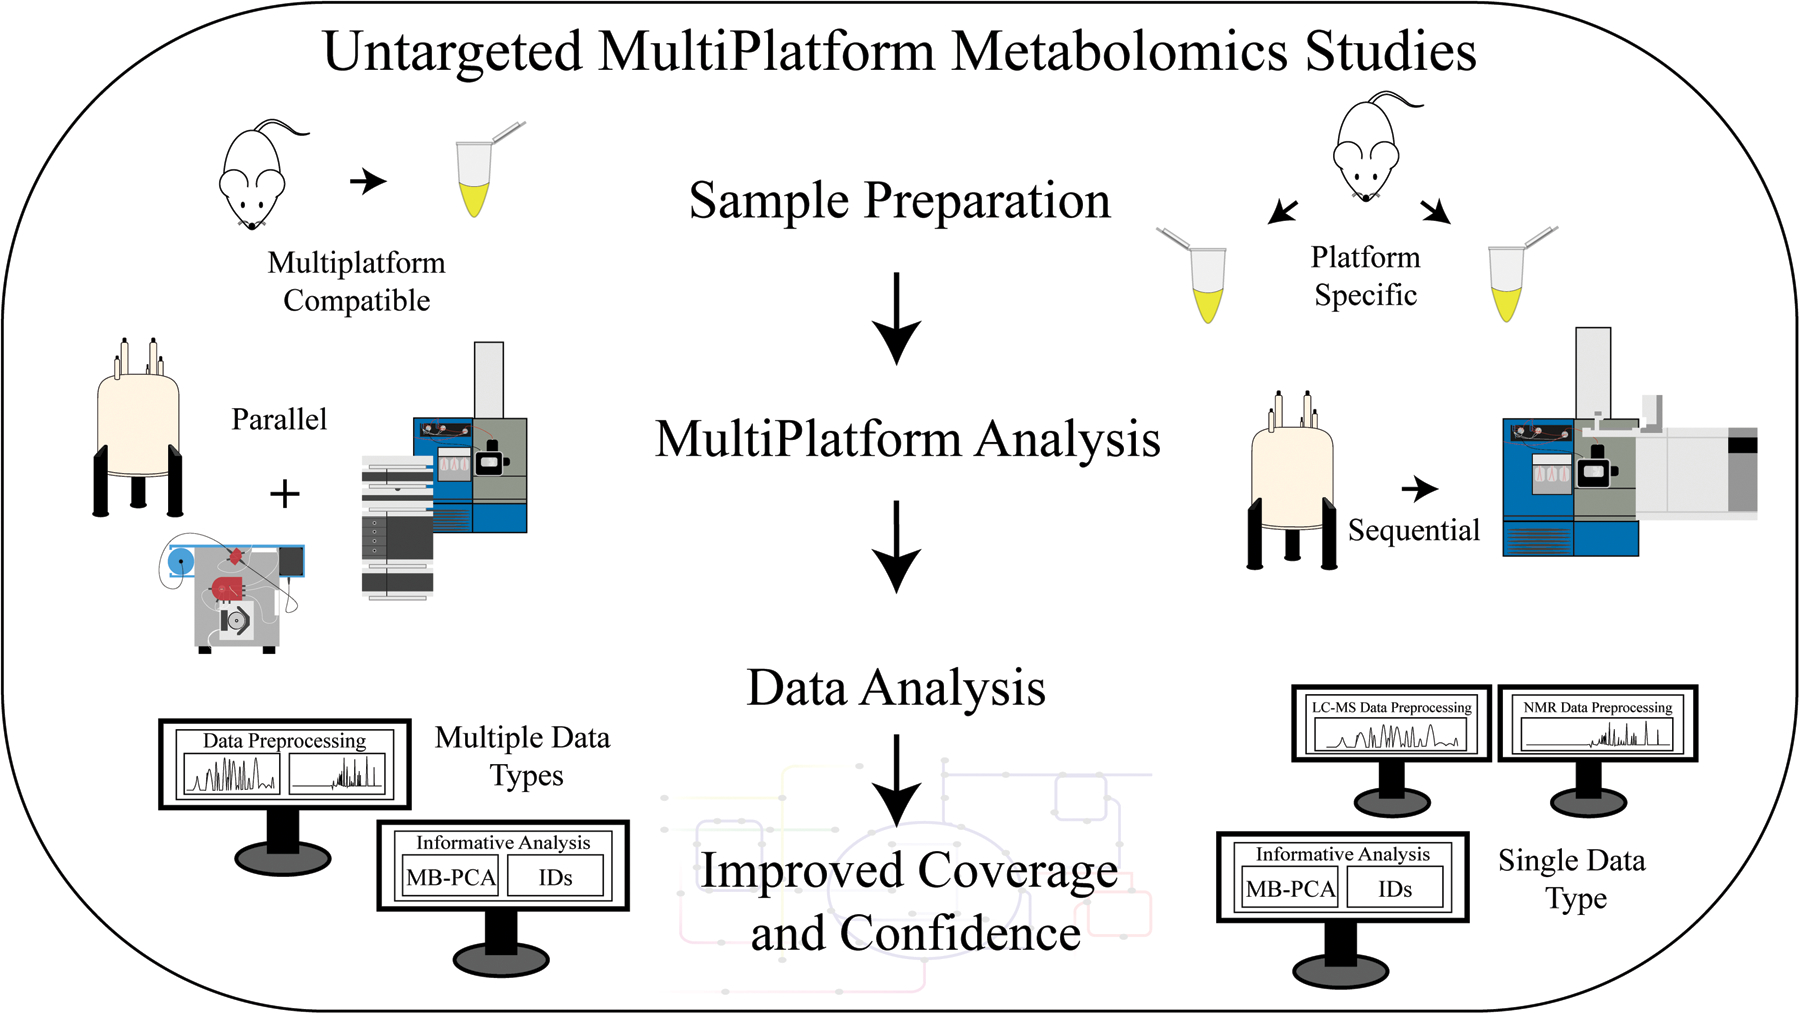
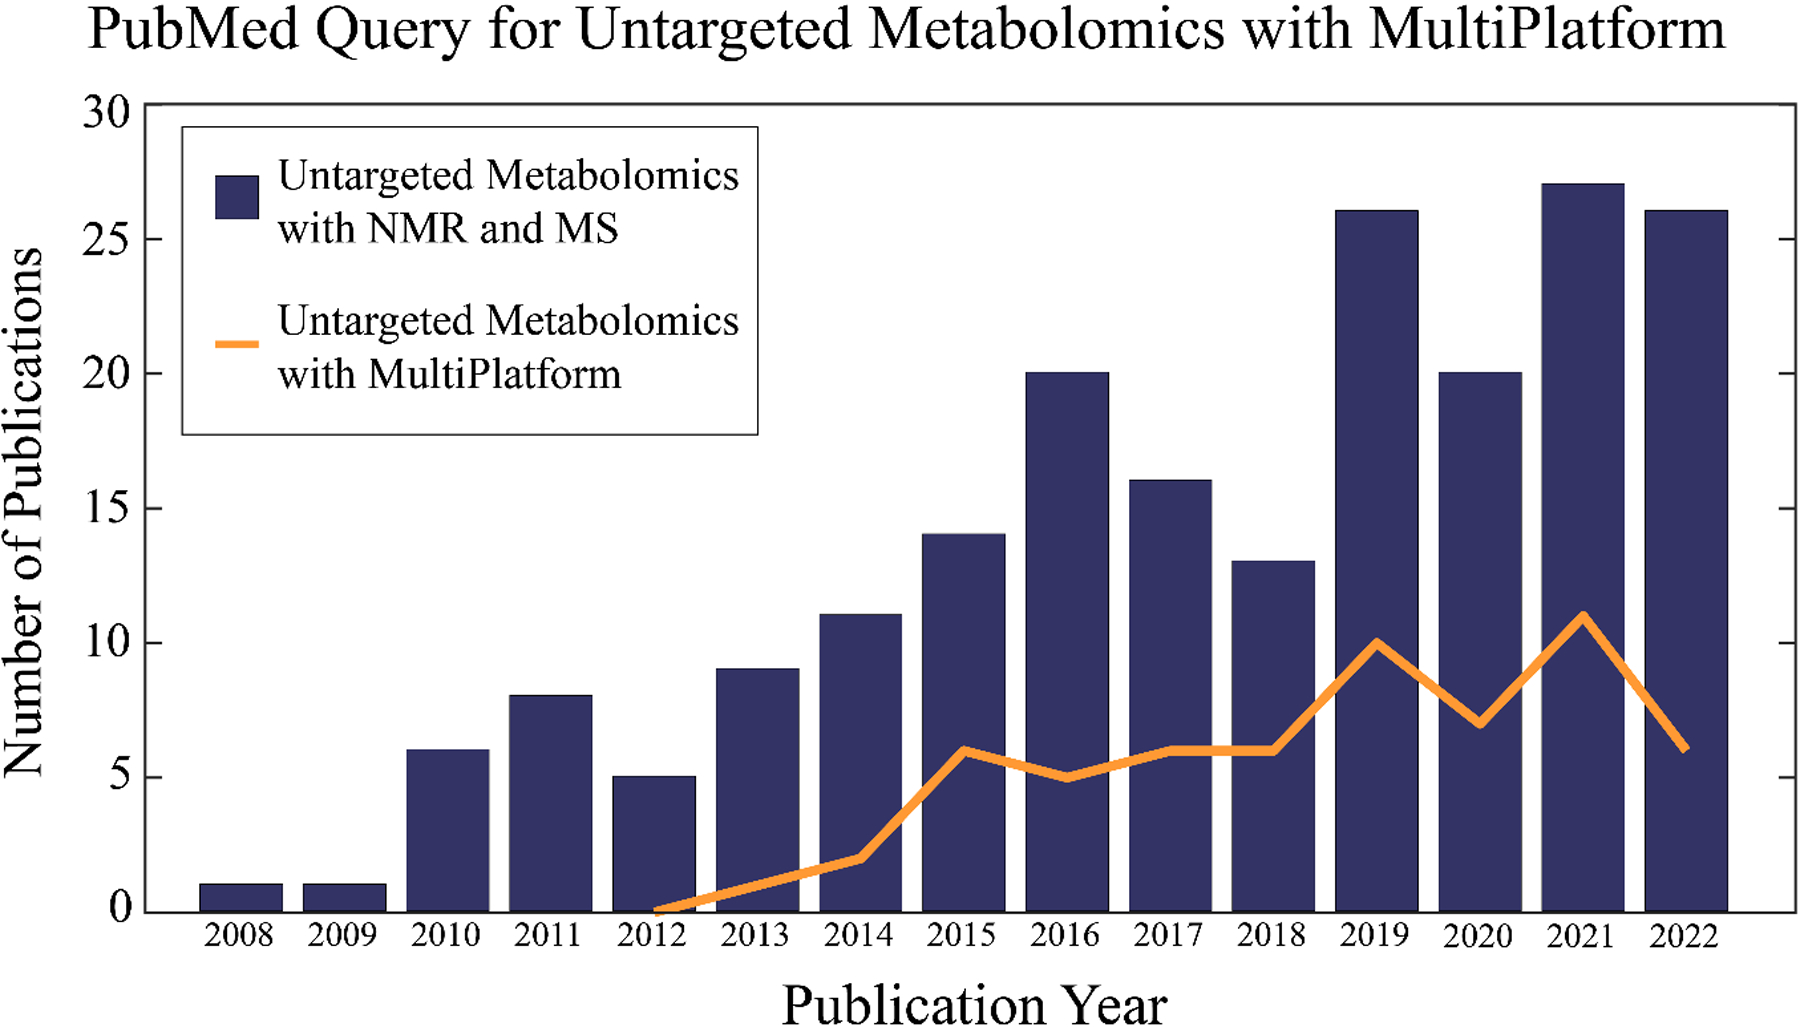
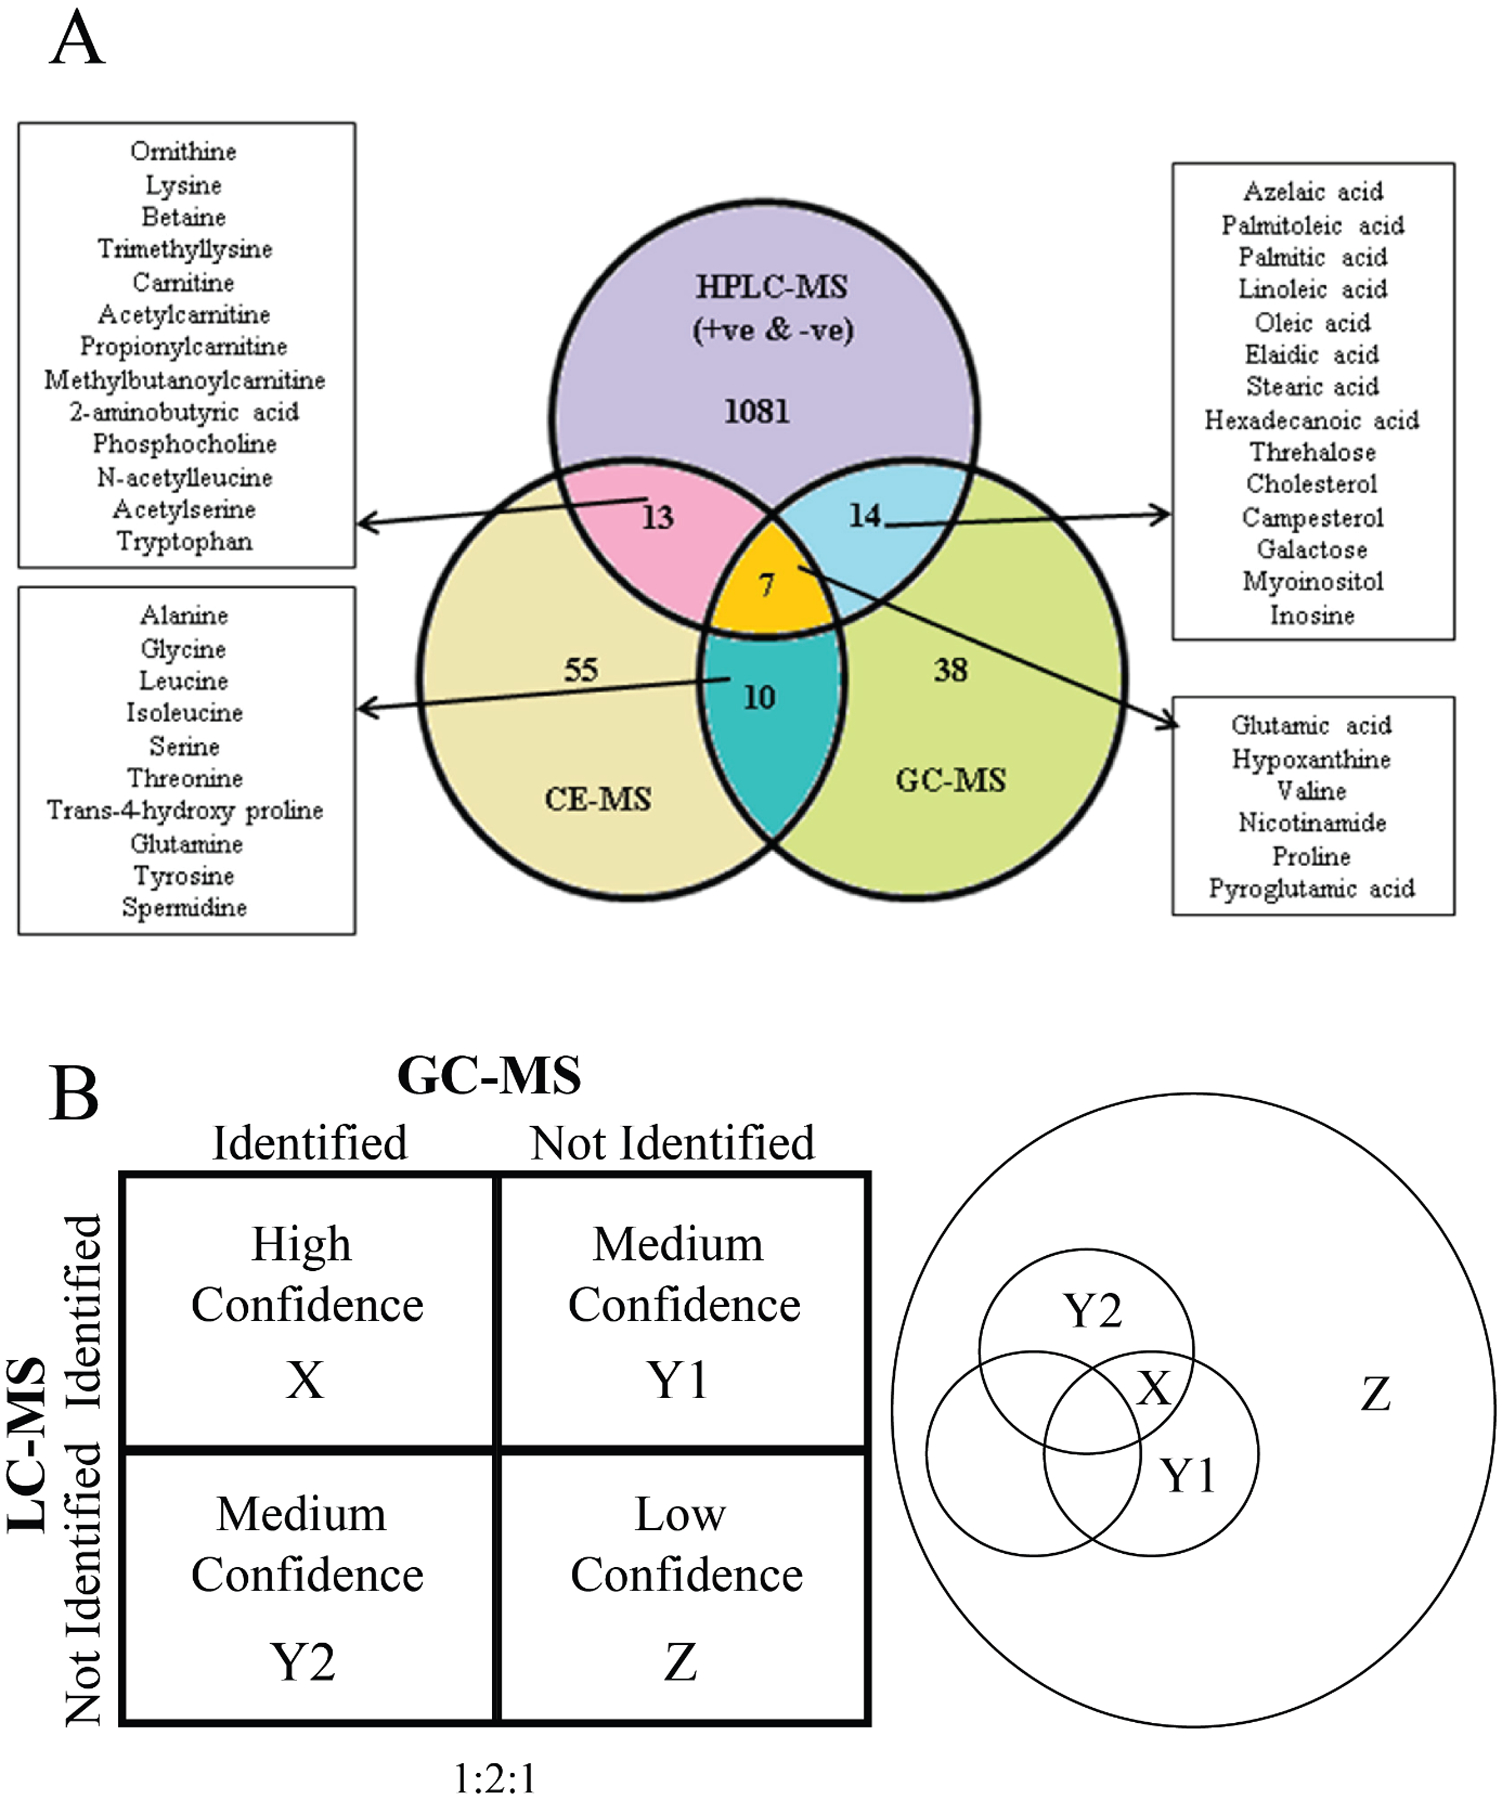
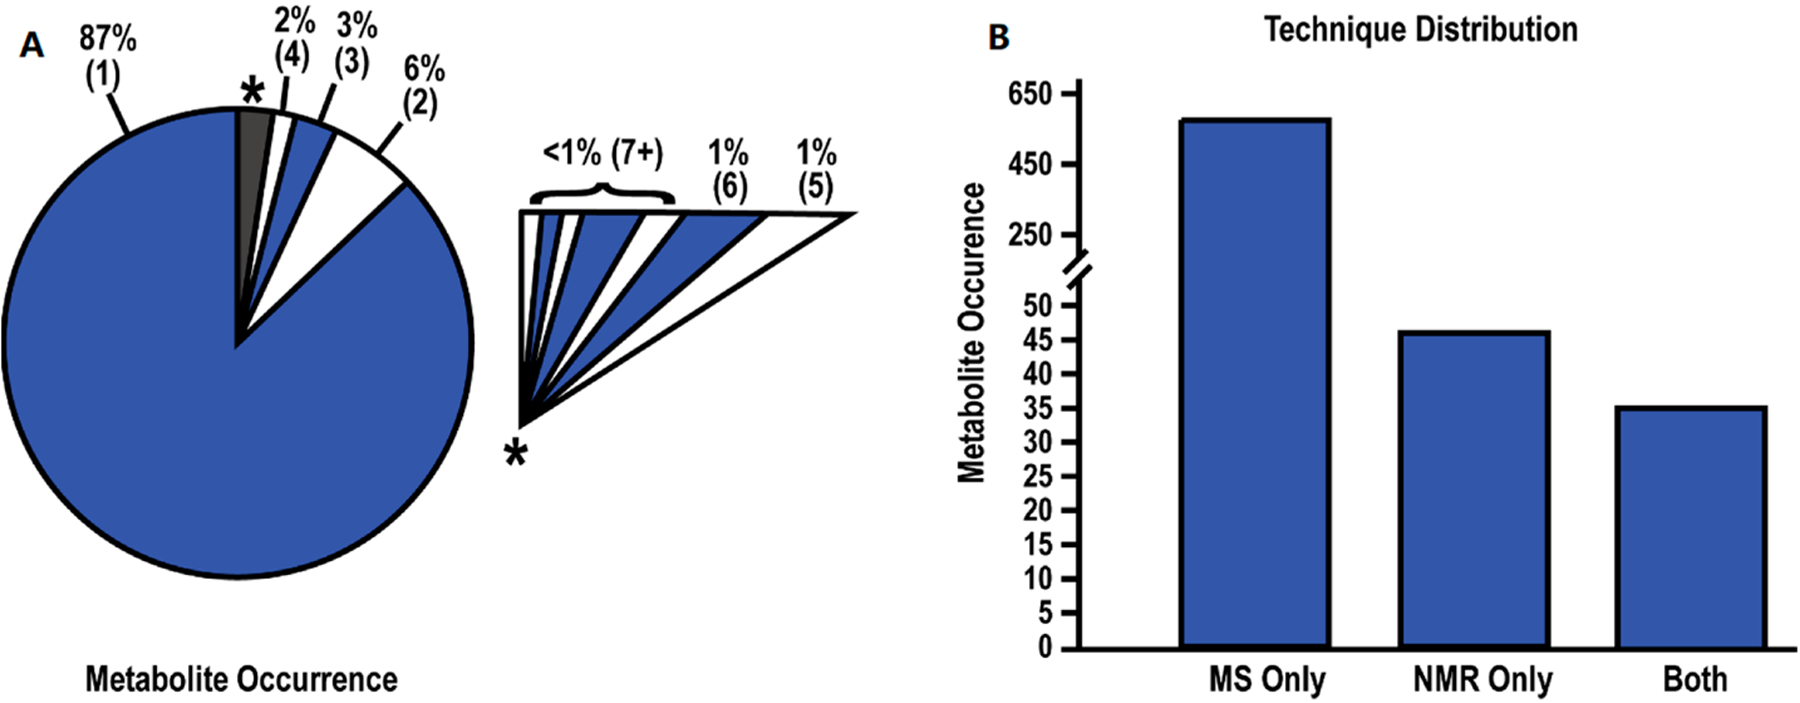
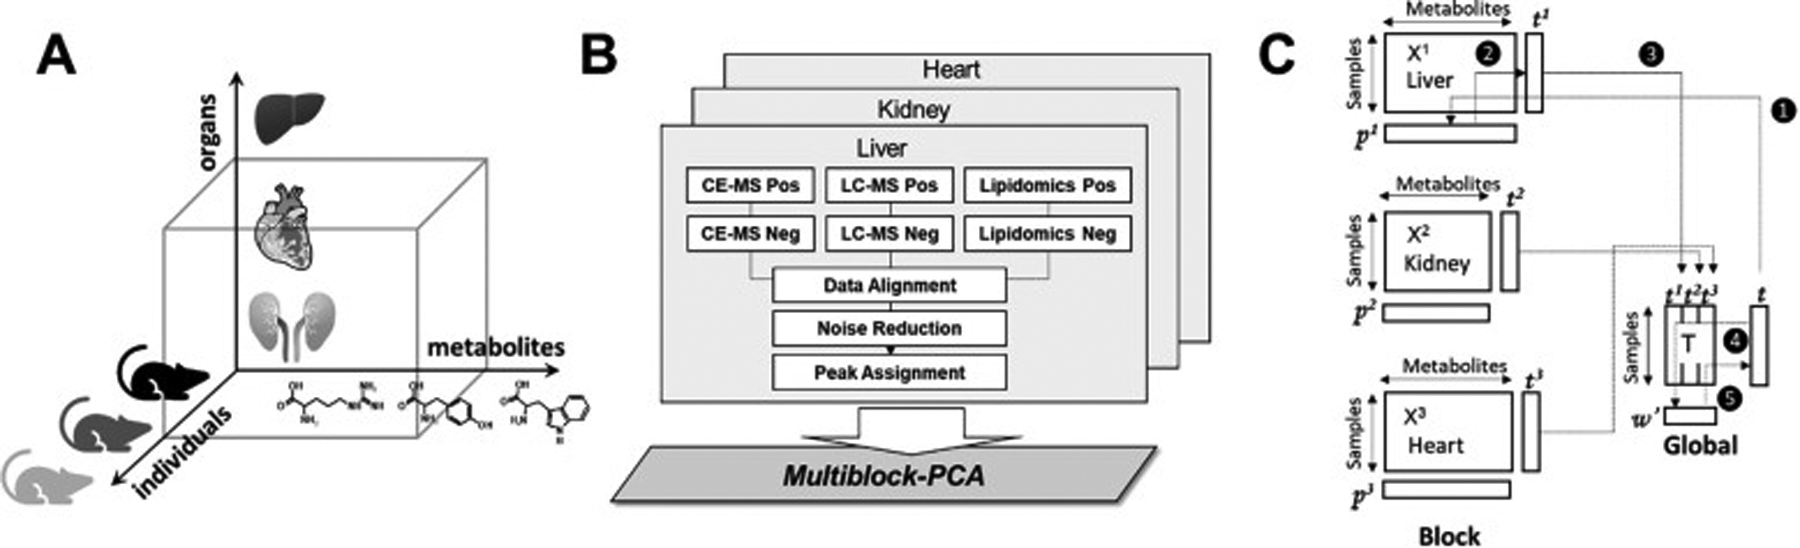
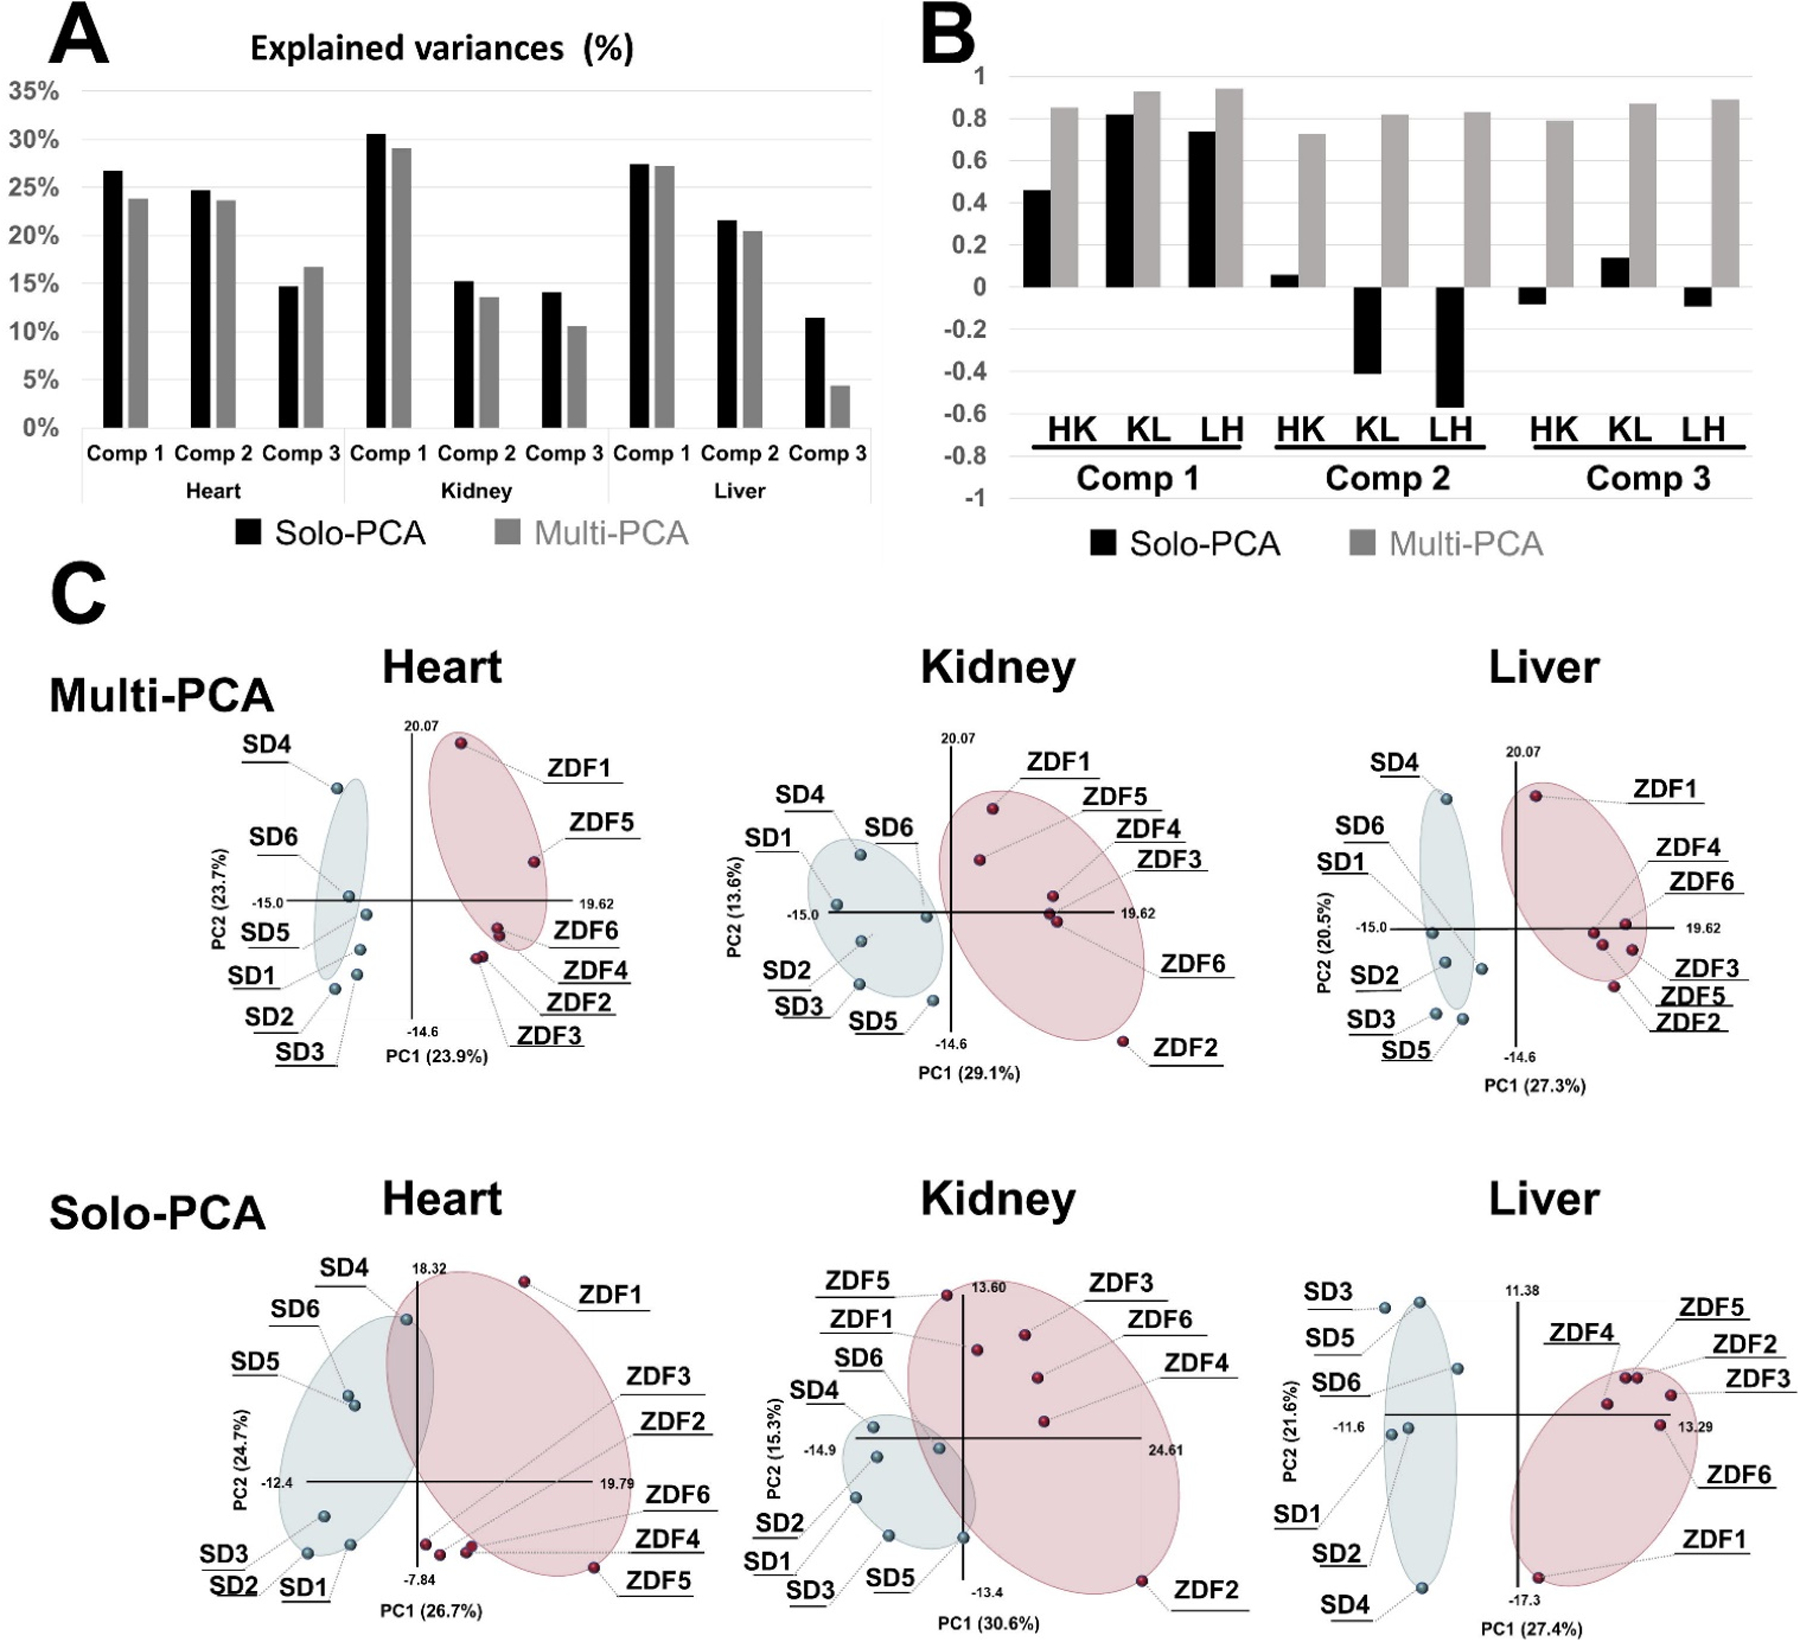
Metabolomics samples like human urine or serum contain upwards of a few thousand metabolites, but individual analytical techniques can only characterize a few hundred metabolites at best. The uncertainty in metabolite identification commonly encountered in untargeted metabolomics adds to this low coverage problem. A multiplatform (multiple analytical techniques) approach can improve upon the number of metabolites reliably detected and correctly assigned. This can be further improved by applying synergistic sample preparation along with the use of combinatorial or sequential non-destructive and destructive techniques. Similarly, peak detection and metabolite identification strategies that employ multiple probabilistic approaches have led to better annotation decisions. Applying these techniques also addresses the issues of reproducibility found in single platform methods. Nevertheless, the analysis of large data sets from disparate analytical techniques presents unique challenges. While the general data processing workflow is similar across multiple platforms, many software packages are only fully capable of processing data types from a single analytical instrument. Traditional statistical methods such as principal component analysis were not designed to handle multiple, distinct data sets. Instead, multivariate analysis requires multiblock or other model types for understanding the contribution from multiple instruments. This review summarizes the advantages, limitations, and recent achievements of a multiplatform approach to untargeted metabolomics.

Keywords: mass spectrometry; metabolite assignment; metabolome coverage; metabolomics; multiplatform; nuclear magnetic resonance.


Conflict of interest statement

The authors declare no competing financial interest.

Figures

Figure 1.
Figure 1.
Flow diagram for an untargeted multiplatform metabolomics study that describes the methods for improving the coverage of the metabolome and confidence in metabolite identifications. The metabolome can be extracted from cells, tissue, or biofluids. The sample preparation protocol is either compatible for both instruments or specific to one instrument. Sample preparation is then followed by the multiplatform data collection that encompasses any combination of two or more instruments. The data collection can occur in parallel or sequentially. Data processing is subdivided into preprocessing and informative analysis steps, which includes statistics and metabolite identifications. A variety of commercial or free academic software is available for platform specific analysis of a single type of data. There are limited software packages capable of processing multiple data types.
Figure 2.
Figure 2.
A bar graph of the number of articles in PubMed per year identified by the query: ((untargeted) OR (non-targeted)) AND ((metabolomics) OR (metabonomics)) AND ((nuclear magnetic resonance) AND (mass spectrometry)). A line plot of the number of articles in PubMed per year identified by the query: ((untargeted) OR (non-targeted)) AND ((metabolomics) OR (metabonomics)) AND (multiplatform). The chart extends up to October 26, 2022 with no hits found before 2008. The first query found a total of 203 papers and the second query identified a total of 60 manuscripts.
Figure 3.
Figure 3.
Details of multiple extractions. (A) Workflow displaying the different metabonomic techniques selected to analyze the aqueous and lipid fraction of breast milk extractions. Reprinted with permission from Andreas, N.J., Hyde, M.J., Gomez-Romero, M., Lopez-Gonzalvez, M.A., Villaseñor, A., Wijeyesekera, A., Barbas, C., Modi, N., Holmes, E. and Garcia-Perez, I. (2015), Multiplatform characterization of dynamic changes in breast milk during lactation. ELECTROPHORESIS, 36: 2269–2285. Copyright 2015 Wiley-VCH GmbH, Weinheim. (B) Survey of 43 multiplatform untargeted metabolomics papers. A bar graph summarizing the number and type of solvents or methods used to extract metabolites from a biological sample.
Figure 4.
Figure 4.
Metabolic pathway summarizing the coverage of the C. reinhardtii metabolome (metabolites of interest) from the combined application of NMR and GC–MS. Metabolites that were only identified by NMR are colored blue. Metabolites that were only identified by GC–MS are colored red. Metabolites identified by both methods are colored black, and metabolites that are not identified are colored gray. The embedded Venn diagram identifies the total number of metabolites of interest within these metabolic pathways that were identified either by NMR, by GC–MS, or by both techniques. Reprinted with permission from Bhinderwala, F.; Wase, N.; DiRusso, C.; Powers, R., Combining Mass Spectrometry and NMR Improves Metabolite Detection and Annotation. Analytical Chemistry 2018, 17 (11), 4017–4022. Copyright 2018 American Chemical Society.
Figure 5.
Figure 5.
(A) Venn diagram presenting data for identified features detected in all 6 replicates for mouse lung pool compared between the three analytical platforms (LC–MS, GC/MS, and CE–MS). Reprinted with permission from Naz, S.; García, A.; Barbas, C., Multiplatform Analytical Methodology for Metabolic Fingerprinting of Lung Tissue. Analytical Chemistry 2013, 85 (22), 10941–10948. Copyright 2013 American Chemical Society. (B) (left) Confidence array based on the number of instrumental platforms used to identify a metabolite in a complex biological sample. (right) Venn diagram depicting the group of hypothetical metabolites detected by two (X), one (Y1, Y2), or no (Z) analytical instruments.
Figure 6.
Figure 6.
Correlations networks calculated from the pair-wise RV coefficients matrix from Test #1 (a) with spiked and non-spiked samples or with native urine samples only (b) and from Test #2 (c). Node labelling: N NMR platforms, Q QTOF mass spectrometer, O orbitrap mass spectrometer, T TOF mass spectrometer. The P or N appended to the mass spectrometer identifier number denotes positive or negative ionization mode, respectively. Node shapes: hexagon for nuclear magnetic resonance platforms, ellipse for mass spectrometers. The node size is proportional to the number of features retained by each instrument. The node colour from black to white indicates an increasing node degree (number of edges per node). The edges represent the RV coefficient values, with cut off values ≥0.791 in Test #1 and ≥0.708 in Test #2). At this cut off level, O3P was excluded from the Test #2 network (b) Martin, JC., Maillot, M., Mazerolles, G. et al. Can we trust untargeted metabolomics? Results of the metabo-ring initiative, a large-scale, multi-instrument inter-laboratory study. Metabolomics 11, 807–821 (2015). Copyright 2014 Springer Nature.
Figure 7.
Figure 7.
Summary of Metabolite Data. (A) Pie chart depicting the rate of metabolite occurrence across the 24 studies. Numbers within parentheses indicate the number of studies identifying the metabolites. An expanded view of the grey-starred slice of the pie chart is shown as an insert. (B) Bar chart depicting the number of metabolites identified by MS, NMR, or both techniques. Reprinted with permissions set under the CC BY 4.0 open access license (https://creativecommons.org/licenses/by/4.0/legalcode) from Roth, H.E.; Powers, R. Meta-Analysis Reveals Both the Promises and the Challenges of Clinical Metabolomics. Cancers 2022, 14, 3992. https://doi.org/10.3390/cancers14163992. Copyright 2022 MDPI.
Figure 8.
Figure 8.
Multiblock metabolomics scheme. (A) Multiblock metabolomics requires a three-dimensional data structure, metabolites, individual samples, and organs. (B) Metabolomics data obtained from CE/MS and LC/MS (hilic and lipid modes) were merged into one data table. After noise reduction, peaks were identified based on the matched m/z values and normalized retention times of the corresponding standard compounds. This process was repeated for the heart, kidney, and liver, and three data matrices were integrated using multiblock PCA. (C) Multiblock PCA architecture: ❶All blocks of X1,2,3 were regressed by an arbitrary global score t to obtain the block loadings p1,2,3. ❷The block scores t1,2,3 were calculated with the normalized block loadings p1,2,3 using the following equation: tb = Xb pb where b = 1, 2, 3. ❸All block scores were combined to a global score matrix T. ❹The global score matrix T was regressed by the global score vector t, resulting in the global weights. ❺ Global weights were normalized to length one and a new global score vector t was then calculated. Reprinted with permission from K. Tanabe, C. Hayashi, T. Katahira, K. Sasaki, K. Igami, Multiblock metabolomics: An approach to elucidate whole-body metabolism with multiblock principal component analysis. Computational and Structural Biotechnology Journal 2021, 19, 1956–1965. Copyright 2021 Elsevier.
Figure 9.
Figure 9.
Comparison of multiblock PCA and solo PCA. Multiblock and solo-PCA were performed with the metabolomic data of the heart, kidney, and liver. (A) The explained variances (%) are indicated by black (solo) and gray (multiblock) bars for the first three components. (B) The cos θ values of the t block scores in the solo and multiblock PCAs are indicated by black and gray bars, respectively. HK: cos θ between heart and kidney, KL: cos θ between kidney and liver, LH: cos θ between liver and heart. (C) The tb block scores of the first and second components are plotted for the multiblock and solo PCAs for the three organs. Six SD rats and six ZDF rats are plotted as light blue and red solid circles in the scatter plots. (For interpretation of the references to colour in this figure legend, the reader is referred to the web version of this article.) Reprinted with permission from K. Tanabe, C. Hayashi, T. Katahira, K. Sasaki, K. Igami, Multiblock metabolomics: An approach to elucidate whole-body metabolism with multiblock principal component analysis. Computational and Structural Biotechnology Journal 2021, 19, 1956–1965. Copyright 2021 Elsevier.
Figure 10.
Figure 10.
Scores generated from (a) PCA of 1H NMR in vacuo, (b) PCA of DI-ESI–MS in vacuo, and (c) MB-PCA of 1H NMR and DI-ESI–MS. Separations between classes are greatly increased upon combination of the two data sets via MB-PCA. Symbols designate the following classes: Control (yellow circle), Rotenone (blue circle), 6-OHDA (red circle), MPP+ (green circle), and Paraquat (turquoise colour circle). Corresponding dendrograms are shown in (d–f). The statistical significance of each node in the dendrogram is indicated by a p-value (Worley et al. 2013). Reprinted with permission from Marshall, D.D., Lei, S., Worley, B. et al. Combining DI-ESI–MS and NMR data sets for metabolic profiling. Metabolomics 11, 391–402 (2015). Copyright 2015 Springer Nature.

Similar articles

Cited by

References

    1. Johnson CH, Ivanisevic J, Siuzdak G, Nature Reviews Molecular Cell Biology 2016, 17, 451–459. - PMC - PubMed
    1. Di Minno A, Gelzo M, Stornaiuolo M, Ruoppolo M, Castaldo G, Nutrition, Metabolism and Cardiovascular Diseases 2021, 31, 1645–1652. - PubMed
    1. Katam R, Lin C, Grant K, Katam CS, Chen S, International Journal of Molecular Sciences 2022, 23, 6985; - PMC - PubMed
    2. Jin L, Godri Pollitt KJ, Liew Z, Rosen Vollmar AK, Vasiliou V, Johnson CH, Zhang Y, Current Environmental Health Reports 2021, 8, 7–22; - PubMed
    3. Wei S, Wei Y, Gong Y, Chen Y, Cui J, Li L, Yan H, Yu Y, Lin X, Li G, Yi L, Metabolomics 2022, 18, 35. - PubMed
    1. Lacalle-Bergeron L, Izquierdo-Sandoval D, Sancho JV, López FJ, Hernández F, Portolés T, TrAC Trends in Analytical Chemistry 2021, 135, 116161;
    2. Jacobs DM, van den Berg MA, Hall RD, Current Opinion in Biotechnology 2021, 70, 23–28. - PubMed
    1. Duarte NC, Becker SA, Jamshidi N, Thiele I, Mo ML, Vo TD, Srivas R, Palsson BØ, Proceedings of the National Academy of Sciences 2007, 104, 1777–1782; - PMC - PubMed
    2. Graham E, Lee J, Price M, Tarailo-Graovac M, Matthews A, Engelke U, Tang J, Kluijtmans LAJ, Wevers RA, Wasserman WW, van Karnebeek CDM, Mostafavi S, Journal of Inherited Metabolic Disease 2018, 41, 435–445. - PMC - PubMed

Publication types

LinkOut - more resources