Review
. 2023 Apr 1;14(1):58.
doi: 10.1186/s13244-023-01413-w.

Topological data analysis in medical imaging: current state of the art

Affiliations
Review

Topological data analysis in medical imaging: current state of the art

Yashbir Singh et al. Insights Imaging. .

Abstract

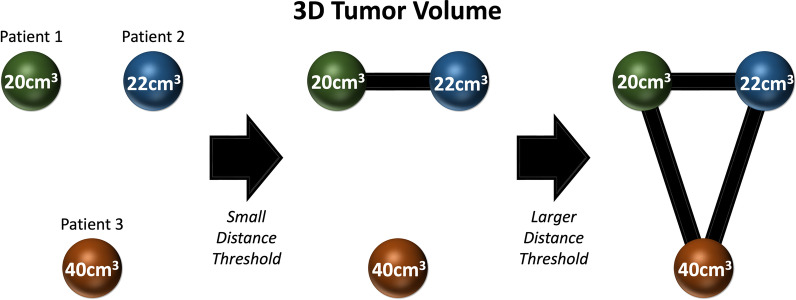
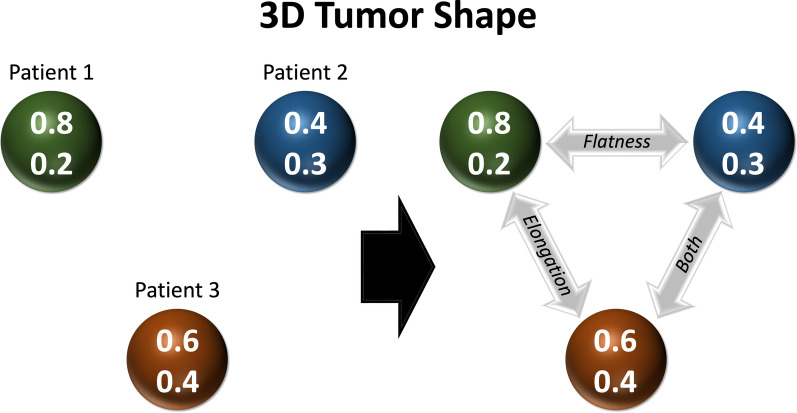
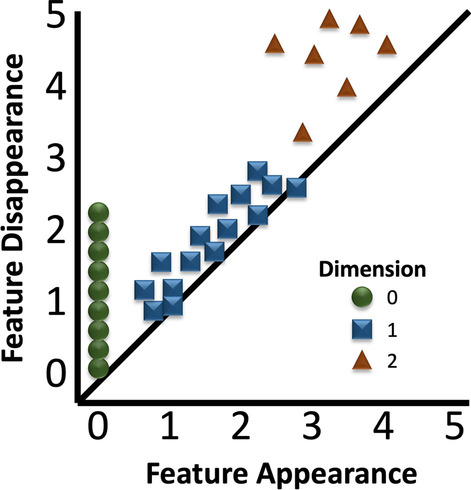
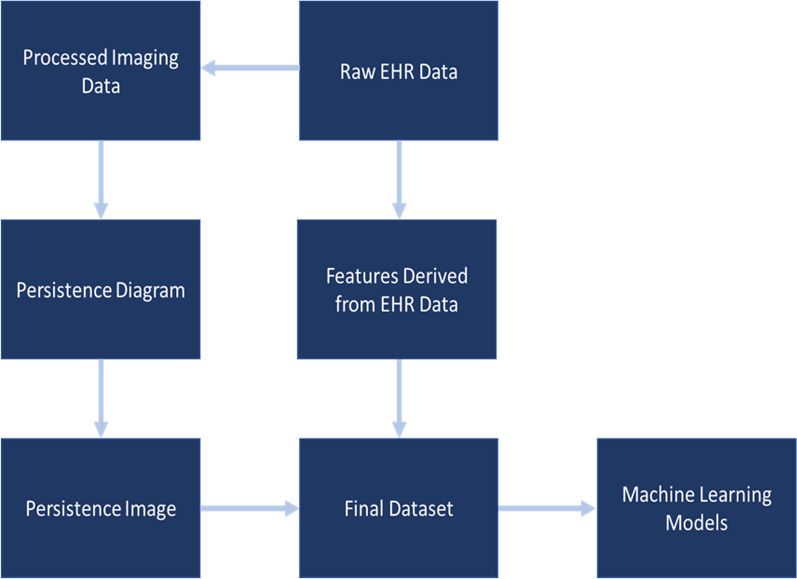
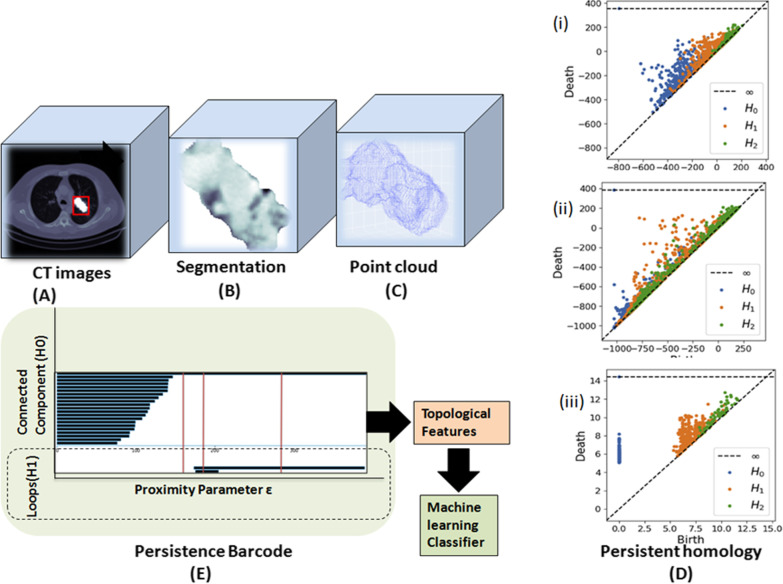
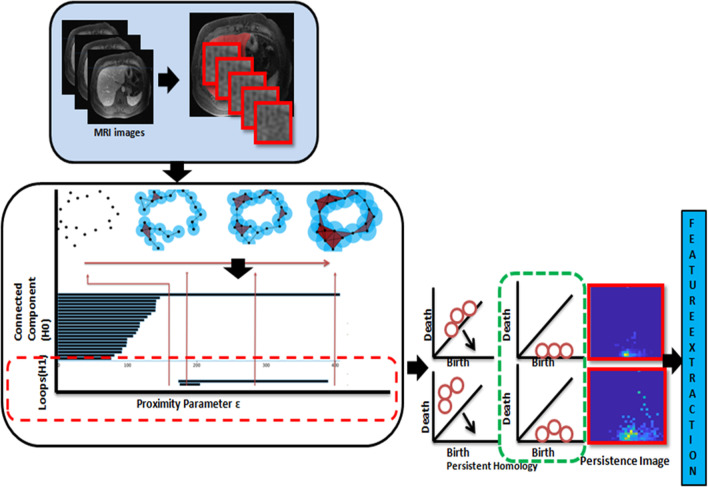
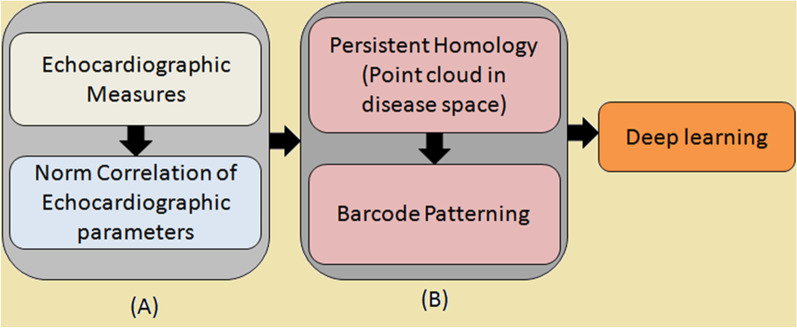
Machine learning, and especially deep learning, is rapidly gaining acceptance and clinical usage in a wide range of image analysis applications and is regarded as providing high performance in detecting anatomical structures and identification and classification of patterns of disease in medical images. However, there are many roadblocks to the widespread implementation of machine learning in clinical image analysis, including differences in data capture leading to different measurements, high dimensionality of imaging and other medical data, and the black-box nature of machine learning, with a lack of insight into relevant features. Techniques such as radiomics have been used in traditional machine learning approaches to model the mathematical relationships between adjacent pixels in an image and provide an explainable framework for clinicians and researchers. Newer paradigms, such as topological data analysis (TDA), have recently been adopted to design and develop innovative image analysis schemes that go beyond the abilities of pixel-to-pixel comparisons. TDA can automatically construct filtrations of topological shapes of image texture through a technique known as persistent homology (PH); these features can then be fed into machine learning models that provide explainable outputs and can distinguish different image classes in a computationally more efficient way, when compared to other currently used methods. The aim of this review is to introduce PH and its variants and to review TDA's recent successes in medical imaging studies.

Keywords: Medical imaging; Persistent homology; Texture landmarks; Topological data analysis.


Conflict of interest statement

The authors declare that they have no competing interests. CMF is an employee of Staticlysm LLC.

Figures

Fig. 1
Fig. 1
An example of three patients with varying 3D tumor volumes within a two-dimensional point cloud. The point from patient 1 and patient 2 for 3D tumor volume is close, therefore only requiring a small distance threshold to create a simplicial complex. As the distance threshold is expanded, the simplicial complex can include additional points with increasing variance
Fig. 2
Fig. 2
An example of three patients with varying 3D tumor shapes within a two-dimensional point cloud. In examining characteristics such as elongation and flatness, the points form mutual two-way relationships within a distance or filter characteristic without a three-way relationship. This can be altered by the data scientist, as increasing the distance threshold can increase the points included within a simplicial complex
Fig. 3
Fig. 3
Persistence diagram that tracks features in the 0th, 1st, and 2nd homology groups. This persistence diagram shows where the 0th, 1st, and 2nd Betti numbers appear (X-axis) and disappear (Y-axis) throughout the filtration of the data
Fig. 4
Fig. 4
Workflow for integrating PH from imaging data and raw EHR data into machine learning models
Fig. 5
Fig. 5
Numerous ways to compute PH from radiographic images. a An example 3D slice from a CT scan showing a lung tumor. The red box shows the lung tumor. The segmented tumor pixels are highlighted in white to distinguish them from their CT pixel values, which may be better seen in the following two images. b The same slice of the CT scan image only showing the tumor pixels that have been segmented. c A point cloud illustrating the tumor surface by stacking the tumor contours of all the 2D CT scan slices. d (i) Persistence diagrams derived from sublevel filtration of a 3D tumor image; image b showing a 2D slice. Three persistence diagrams are displayed. Each of the three dimensions of the topological hole under consideration has an unique diagram (H0/0-dim: connected components, H1/1-dim: cycles, and H2/2-dim: voids). (ii) The persistence diagrams, of which a 2D slice is shown in b, were generated by sublevel filtering the 3D tumor image with adjacent boundary box pixels. (iii) The lightly drawn persistence diagrams for the Vietoris–Rips filtering of the tumor surface-representing point cloud in c. e This is the persistent barcode extracted from the PH (H0/0-dim: connected components, H1/1-dim: cycles)
Fig. 6
Fig. 6
Workflow of algebraic topology-based machine learning with MRI imaging signal as input
Fig. 7
Fig. 7
Workflow for echocardiographic features on TDA network. a Normalized bivariate correlation matrix of the different echocardiographic parameters of the dataset. b TDA combines the compressed representation with expressive visualization and understanding using a persistence diagram and barcode

References

    1. Skaf Y, Laubenbacher R. Topological data analysis in biomedicine: a review. J Biomed Inform. 2022;130:104082. doi: 10.1016/j.jbi.2022.104082. - DOI - PubMed
    1. Kamruzzaman M (2020) Topological data analysis for computational phenomics: algorithms and applications. School of Electrical Engineering and Computer Science, Doctor of Philosophy.
    1. Nielson JL, Paquette J, Liu AW, et al. Topological data analysis for discovery in preclinical spinal cord injury and traumatic brain injury. Nat Commun. 2015;6:85811. doi: 10.1038/ncomms9581. - DOI - PMC - PubMed
    1. Wu C, Hargreaves CA. Topological machine learning for mixed numeric and categorical data. Int J Artif Intell Tools. 2021;30:2150025. doi: 10.1142/S0218213021500251. - DOI
    1. Nielson JL, Cooper SR, Yue JK, et al. Uncovering precision phenotype-biomarker associations in traumatic brain injury using topological data analysis. PLoS One. 2017;12:e0169490. doi: 10.1371/journal.pone.0169490. - DOI - PMC - PubMed

LinkOut - more resources