

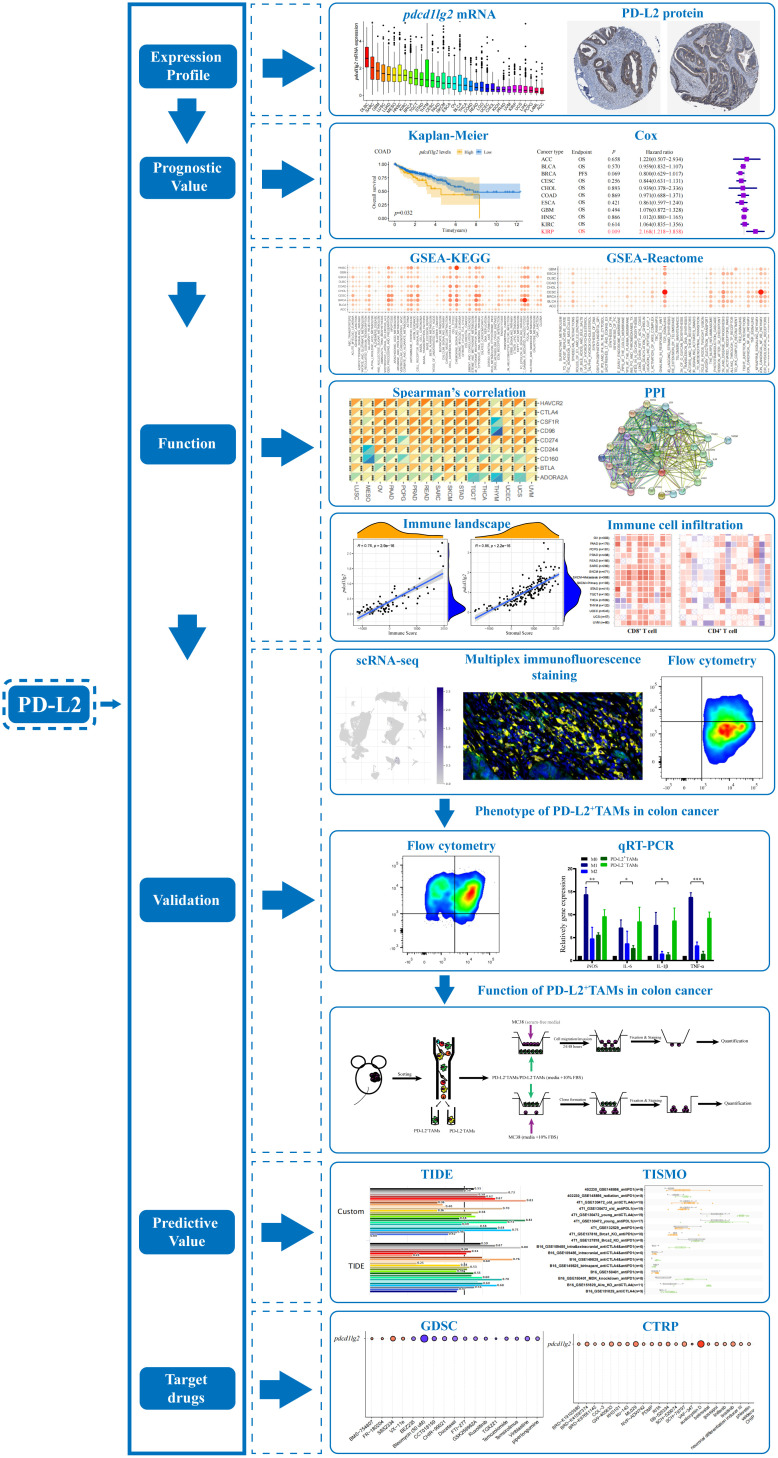
Pan-cancer analysis identifies PD-L2 as a tumor promotor in the tumor microenvironment
- PMID: 37006239
- PMCID: PMC10060638
- DOI: 10.3389/fimmu.2023.1093716
Pan-cancer analysis identifies PD-L2 as a tumor promotor in the tumor microenvironment
Abstract
Background: Programmed cell death protein 1 (PD-1) receptor has two ligands,programmed death-ligand 1 (PD-L1) and PD-L2. When compared with PD-L1, PD-L2 has not received much attention, and its role remains unclear.
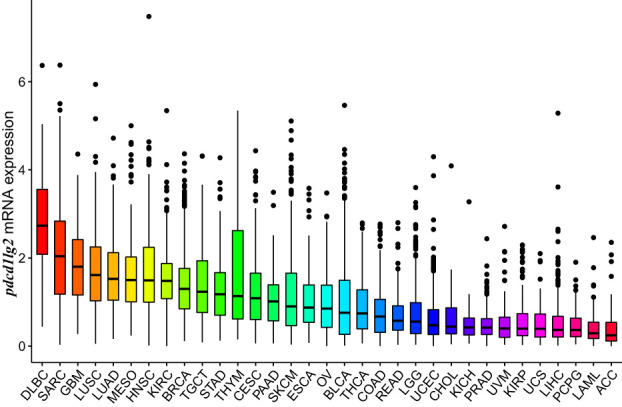
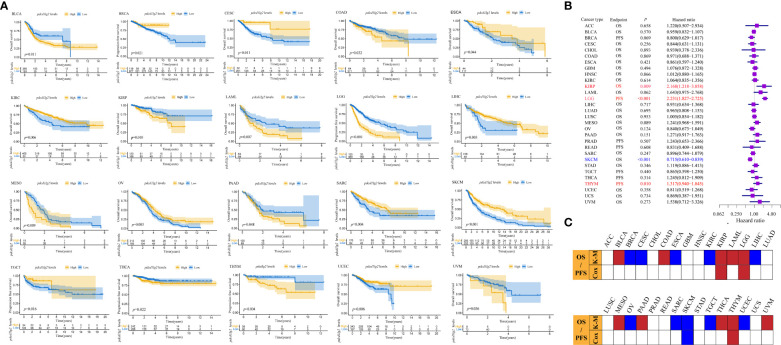
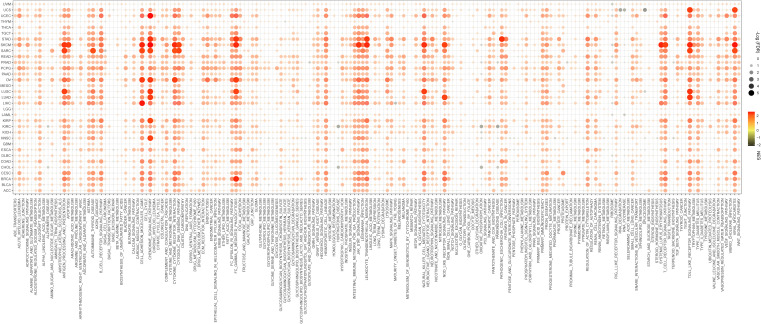
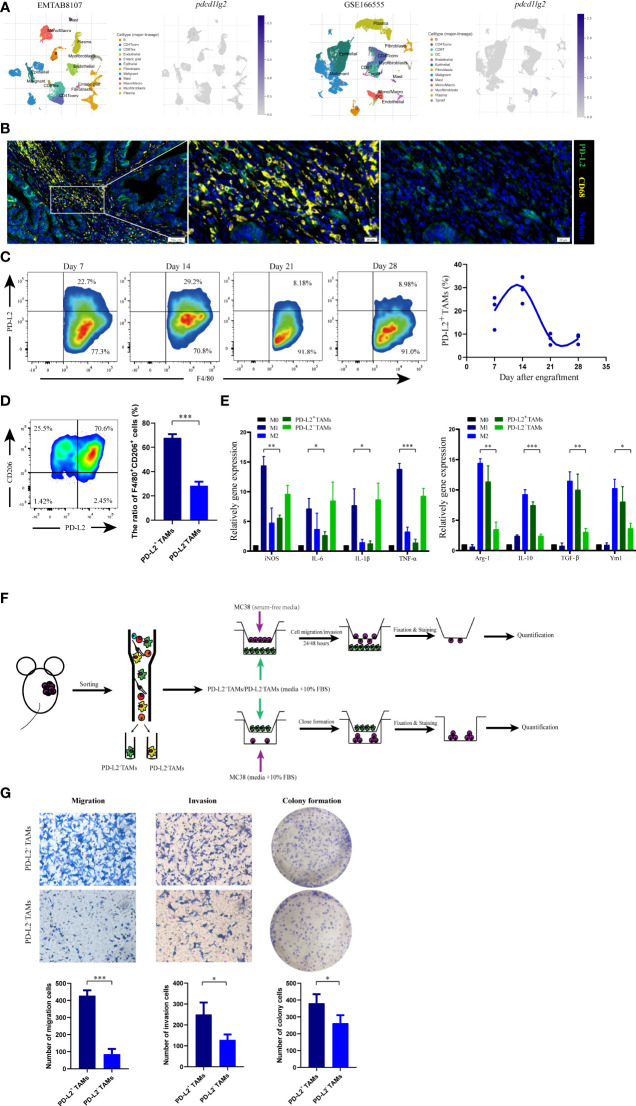
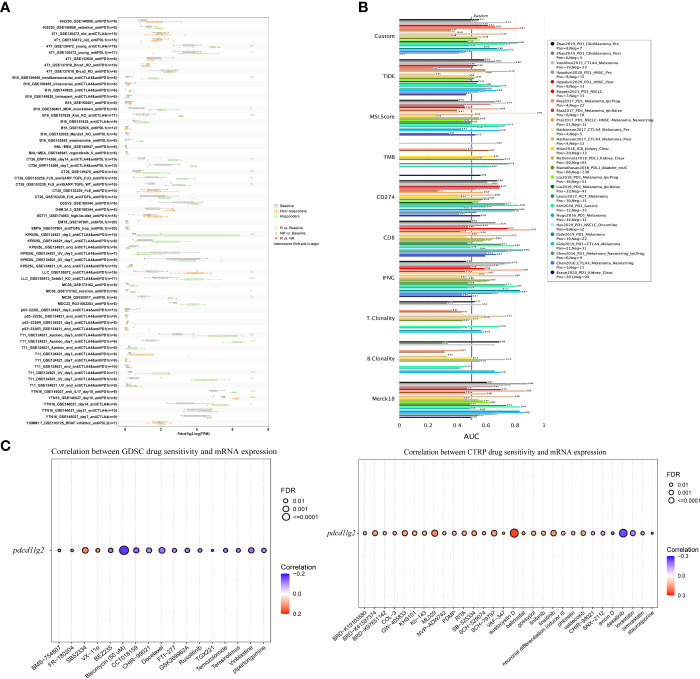
Methods: The expression profiles of pdcd1lg2 (PD-L2-encoding gene) mRNA and PD-L2 protein were analyzed using TCGA, ICGC, and HPA databases. Kaplan-Meier and Cox regression analyses were used to assess the prognostic significance of PD-L2. We used GSEA, Spearman's correlation analysis and PPI network to explore the biological functions of PD-L2. PD-L2-associated immune cell infiltration was evaluated using the ESTIMATE algorithm and TIMER 2.0. The expressions of PD-L2 in tumor-associated macrophages (TAMs) in human colon cancer samples, and in mice in an immunocompetent syngeneic setting were verified using scRNA-seq datasets, multiplex immunofluorescence staining, and flow cytometry. After fluorescence-activated cell sorting, flow cytometry and qRT-PCR and transwell and colony formation assays were used to evaluate the phenotype and functions of PD-L2+TAMs. Immune checkpoint inhibitors (ICIs) therapy prediction analysis was performed using TIDE and TISMO. Last, a series of targeted small-molecule drugs with promising therapeutic effects were predicted using the GSCA platform.
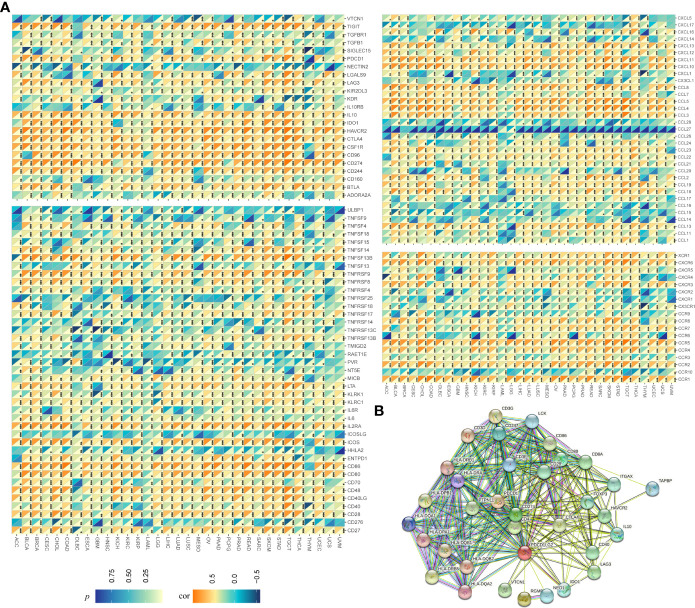
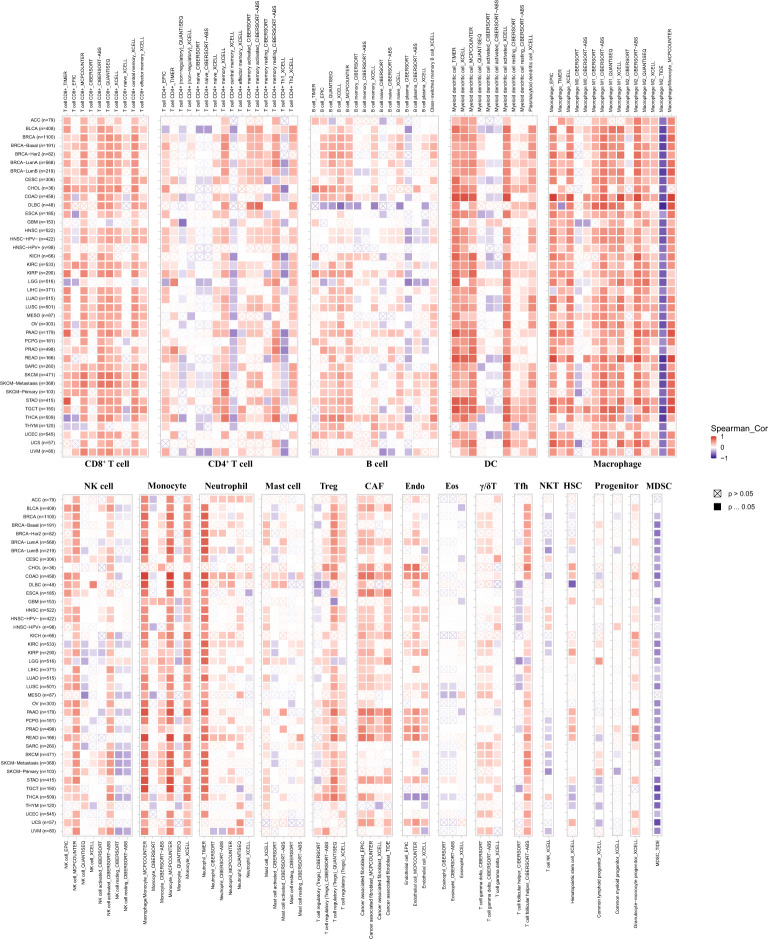
Results: PD-L2 was expressed in all the common human cancer types and deteriorated outcomes in multiple cancers. PPI network and Spearman's correlation analysis revealed that PD-L2 was closely associated with many immune molecules. Moreover, both GSEA results of KEGG pathways and GSEA results for Reactome analysis indicated that PD-L2 expression played an important role in cancer immune response. Further analysis showed that PD-L2 expression was strongly associated with the infiltration of immune cells in tumor tissue in almost all cancer types, among which macrophages were the most positively associated with PD-L2 in colon cancer. According to the results mentioned above, we verified the expression of PD-L2 in TAMs in colon cancer and found that PD-L2+TAMs population was not static. Additionally, PD-L2+TAMs exhibited protumor M2 phenotype and increased the migration, invasion, and proliferative capacity of colon cancer cells. Furthermore, PD-L2 had a substantial predictive value for ICIs therapy cohorts.
Conclusion: PD-L2 in the TME, especially expressed on TAMs, could be applied as a potential therapeutic target.
Keywords: PD-L2; colon cancer; immune checkpoint; pan-cancer analysis; tumor associated macrophages.
Copyright © 2023 Lv, Jiang, Yuan, Zhuang, Guan, Liu, Yin, Ma, Liu, Wang and Wang.
Conflict of interest statement
The authors declare that the research was conducted in the absence of any commercial or financial relationships that could be construed as a potential conflict of interest.
Figures
References
Publication types
MeSH terms
Substances
LinkOut - more resources
Full Text Sources
Molecular Biology Databases
Research Materials