. 2023 Mar 15:14:1137025.
doi: 10.3389/fimmu.2023.1137025. eCollection 2023.

T-cell exhaustion signatures characterize the immune landscape and predict HCC prognosis via integrating single-cell RNA-seq and bulk RNA-sequencing

Affiliations

T-cell exhaustion signatures characterize the immune landscape and predict HCC prognosis via integrating single-cell RNA-seq and bulk RNA-sequencing

Hao Chi et al. Front Immunol. .

Abstract

Background: Hepatocellular carcinoma (HCC), the third most prevalent cause of cancer-related death, is a frequent primary liver cancer with a high rate of morbidity and mortality. T-cell depletion (TEX) is a progressive decline in T-cell function due to continuous stimulation of the TCR in the presence of sustained antigen exposure. Numerous studies have shown that TEX plays an essential role in the antitumor immune process and is significantly associated with patient prognosis. Hence, it is important to gain insight into the potential role of T cell depletion in the tumor microenvironment. The purpose of this study was to develop a trustworthy TEX-based signature using single-cell RNA-seq (scRNA-seq) and high-throughput RNA sequencing, opening up new avenues for evaluating the prognosis and immunotherapeutic response of HCC patients.

Methods: The International Cancer Genome Consortium (ICGC) and The Cancer Genome Atlas (TCGA) databases were used to download RNA-seq information for HCC patients. The 10x scRNA-seq. data of HCC were downloaded from GSE166635, and UMAP was used for clustering descending, and subgroup identification. TEX-related genes were identified by gene set variance analysis (GSVA) and weighted gene correlation network analysis (WGCNA). Afterward, we established a prognostic TEX signature using LASSO-Cox analysis. External validation was performed in the ICGC cohort. Immunotherapy response was assessed by the IMvigor210, GSE78220, GSE79671, and GSE91061cohorts. In addition, differences in mutational landscape and chemotherapy sensitivity between different risk groups were investigated. Finally, the differential expression of TEX genes was verified by qRT-PCR.

Result: 11 TEX genes were thought to be highly predictive of the prognosis of HCC and substantially related to HCC prognosis. Patients in the low-risk group had a greater overall survival rate than those in the high-risk group, according to multivariate analysis, which also revealed that the model was an independent predictor of HCC. The predictive efficacy of columnar maps created from clinical features and risk scores was strong.

Conclusion: TEX signature and column line plots showed good predictive performance, providing a new perspective for assessing pre-immune efficacy, which will be useful for future precision immuno-oncology studies.

Keywords: HCC; T-cell exhaustion; immunotherapy; machine learning; predictive signature; single-cell RNA-seq; tumor microenvironment.


Conflict of interest statement

The authors declare that the research was conducted in the absence of any commercial or financial relationships that could be construed as a potential conflict of interest.

Figures

Figure 1
Figure 1
Different cell clustering in 10x scRNA-seq data of hepatocellular carcinoma and further analysis. (A, B) Cluster annotation and cell type identification by means of UMAP. (C) Heat map of marker genes for different cell types. (D) Functional enrichment analysis of all cell types using the “ReactomeGSA” package. (E, F) Cellular communication networks were inferred by calculating the likelihood of communication. Intercellular communication network studies show that HLA-DPA 1-CD 4 plays an important role in the intercellular communication network. scRNA-seq, single cell RNA sequencing; UMAP, Unified Flowform Approximation and Projection.
Figure 2
Figure 2
Identification of candidate T cell exhaustion-related genes. (A, B) Heat map and volcano map of differentially expressed genes in the TCGA cohort. (C) Scale independence and average connectivity. (D) Cluster dendrogram. (E) Heatmap of the correlation between TEX pathway and exhausted T cell scores and modules. (F) Venn diagram of T-cell marker genes and pink modules.
Figure 3
Figure 3
TEX signature establishment and external validation. (A) Lasso regression profiles of TEXs to avoid over-fitting. (B) 10-fold cross-validation of variable selection with Lasso. (C) Correlation of risk scores and 11-TEX genes. (D, G) Distribution of risk scores and patient survival between low and high risk groups in the TCGA cohort and the ICGC cohort. (E, H) KM curve compares the overall HCC patients between LR and HR groups in the TCGA cohort and the IGCG cohort. (F, I) Time-dependent ROC curves analysis in the TCGA cohort and the ICGC cohort.
Figure 4
Figure 4
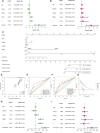
Creation of nomograms based on TEX signature combined with clinical characteristics. (A) Univariate and (B) multivariate COX regression analysis of the signature and different clinical features. (C) A Nomogram combining the age, grade, gender, stage, T stage, and risk score. (D) The calibration curve of the constructed Nomogram of 1-year, 2-year, and 3-year survival. (E) Time-dependent ROC curves analysis. (F) The Nomogram’s time-dependent ROC curves. (G) Decision curve analysis. (H) Univariate and (I) multivariate COX regression analysis of the Nomogram and different clinical features.
Figure 5
Figure 5
Clinical correlation and survival analysis of TEX genes in patients with HCC. (A, B) age, (C, D) pathological grade, (E, F) gender, (G, H) pathological stage, (I, J), and T stage.
Figure 6
Figure 6
Distribution of risk scores in different clinical subtypes. (A) Heatmap of clinicopathological variables in HR group and LR group. (B-F) The proportion of patients with different clinical subtypes (Age, Gender, Grade, Stage, T stage) in the HR group and LR group. (G-K) Risk score distribution of different clinical subtypes.
Figure 7
Figure 7
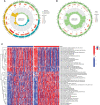
Function enrichment analysis. (A) GO enrichment pathway. (B) KEGG enrichment pathways. (C) Heatmap of differentially enriched pathways between the HR group and LR group.
Figure 8
Figure 8
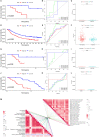
TMB analysis and survival analysis of TMB and risk scores. (A) Mutation analysis of HR group (B) Mutation analysis of LR group. (C) Violin plot revealing the distinction between HR and LR groups in TMB. (D) Kaplan-Meier curves for the high- and low-TMB groups. (E) Kaplan-Meier curves for the four groups divided by risk score and TMB.
Figure 9
Figure 9
TEX risk score predicts TME and immune cell infiltration. (A) The relative proportion of infiltrating immune cells with risk scores. (B) The relative proportion of infiltrating immune cells with risk scores. (C) Immune cell component between HR group and LR group. (D) Immune checkpoint differences between HR and LR groups. (E) Estimate the score of the expression profile in the HR group and LR group. *P < 0.05, **P < 0.01, ***P < 0.001.
Figure 10
Figure 10
Prediction and validation of immunotherapy effects. (A) Survival curves for the HR group and LR group of the GSE78220 cohort. (B) Risk score prognostic ROC curves for the GSE78220 cohort. (C) Comparison of overall response rates between the HR group and LR group of the GSE78220 cohort. (D) Survival curves for the HR group and LR group of the IMvigor cohort. (E) Risk score prognostic ROC curves for the IMvigor cohort. (F) Comparison of overall response rates between the HR group and LR group of the IMvigor cohort. (G) Survival curves of HR group and LR group of GSE79671 cohort. (H) Risk score prognostic ROC curves for the GSE79671 cohort. (I) Comparison of overall response rates between the HR group and LR group of the GSE79671 cohort. (J) Survival curves of HR group and LR group of GSE91061cohort. (K) Risk score prognostic ROC curves for the GSE91061 cohort. (L) Distribution of risk scores between responders and non-responders in the GSE91061 cohort. (M) Correlation of risk scores with ICB response signature and each step of the tumor-immune cycle.
Figure 11
Figure 11
TEX signature characteristics predicted the sensitivity of chemotherapy. (A) Sorafenib, (B) Cisplatin, (C) Gemcitabine, (D) Mitoxantrone, (E) Oxaliplatin, (F) 5-Fluorouracil, (G) Afatinib, (H) Docetaxel, and (I) Epirubicin. Relationship between risk score and ICB response characteristics, and each stage of the tumor immune cycle.
Figure 12
Figure 12
Validation of expression of TEX genes that comprised the risk model by RT-qPCR. QRT-PCR analysis of (A) ITM2A, (B) LTB, (C) TNFRSF4, (D) TNFRSF18, (E) ARPC1B, (F) CTSC, (G) TBC1D10C, and (H) TMSB10. *P < 0.05, **P < 0.01, ****P < 0.0001.

References

    1. Rebouissou S, Nault JC. Advances in molecular classification and precision oncology in hepatocellular carcinoma. J Hepatol (2020) 72(2):215–29. doi: 10.1016/j.jhep.2019.08.017 - DOI - PubMed
    1. Bray F, Ferlay J, Soerjomataram I, Siegel RL, Torre LA, Jemal A. Global cancer statistics 2018: Globocan estimates of incidence and mortality worldwide for 36 cancers in 185 countries. CA Cancer J Clin (2018) 68(6):394–424. doi: 10.3322/caac.21492 - DOI - PubMed
    1. Singal AG, Lampertico P, Nahon P. Epidemiology and surveillance for hepatocellular carcinoma: New trends. J Hepatol (2020) 72(2):250–61. doi: 10.1016/j.jhep.2019.08.025 - DOI - PMC - PubMed
    1. Pais R, Barritt AS4, Calmus Y, Scatton O, Runge T, Lebray P, et al. . Nafld and liver transplantation: Current burden and expected challenges. J Hepatol (2016) 65(6):1245–57. doi: 10.1016/j.jhep.2016.07.033 - DOI - PMC - PubMed
    1. Pinter M, Scheiner B, Peck-Radosavljevic M. Immunotherapy for advanced hepatocellular carcinoma: A focus on special subgroups. Gut (2021) 70(1):204–14. doi: 10.1136/gutjnl-2020-321702 - DOI - PMC - PubMed

Publication types