. 2023 Mar 15:14:1112312.
doi: 10.3389/fneur.2023.1112312. eCollection 2023.

Implications of quantitative susceptibility mapping at 7 Tesla MRI for microbleeds detection in cerebral small vessel disease

Affiliations

Implications of quantitative susceptibility mapping at 7 Tesla MRI for microbleeds detection in cerebral small vessel disease

Valentina Perosa et al. Front Neurol. .

Abstract

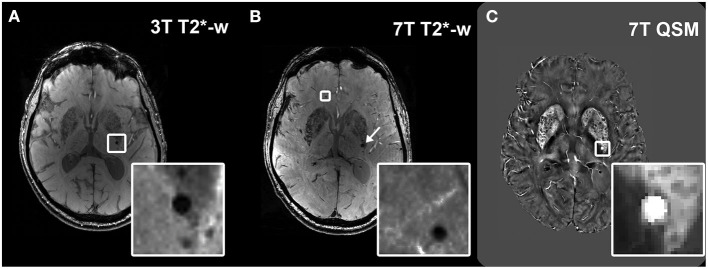
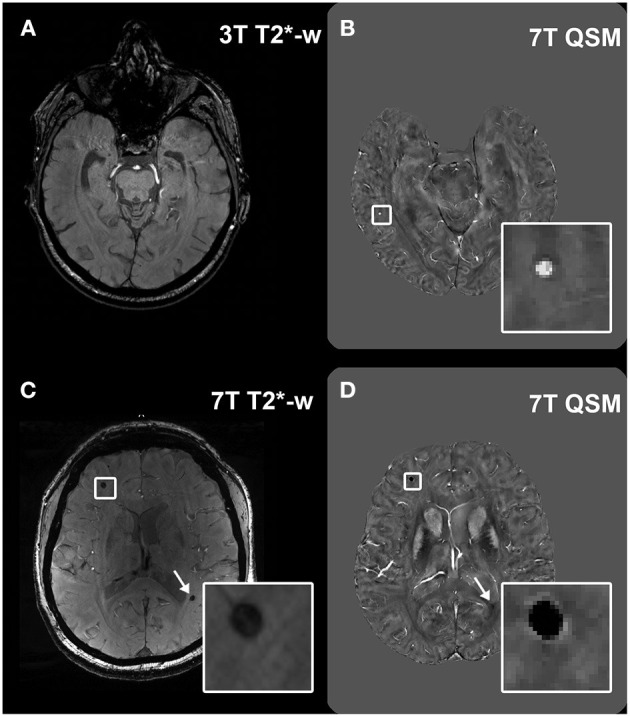
Background: Cerebral microbleeds (MBs) are a hallmark of cerebral small vessel disease (CSVD) and can be found on T2*-weighted sequences on MRI. Quantitative susceptibility mapping (QSM) is a postprocessing method that also enables MBs identification and furthermore allows to differentiate them from calcifications.

Aims: We explored the implications of using QSM at submillimeter resolution for MBs detection in CSVD.

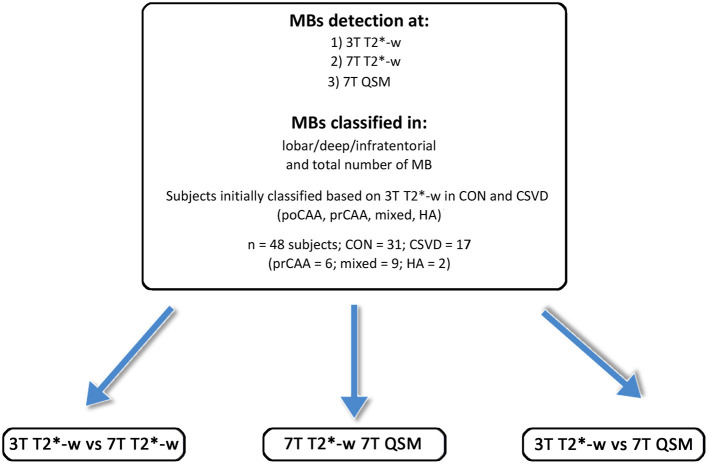
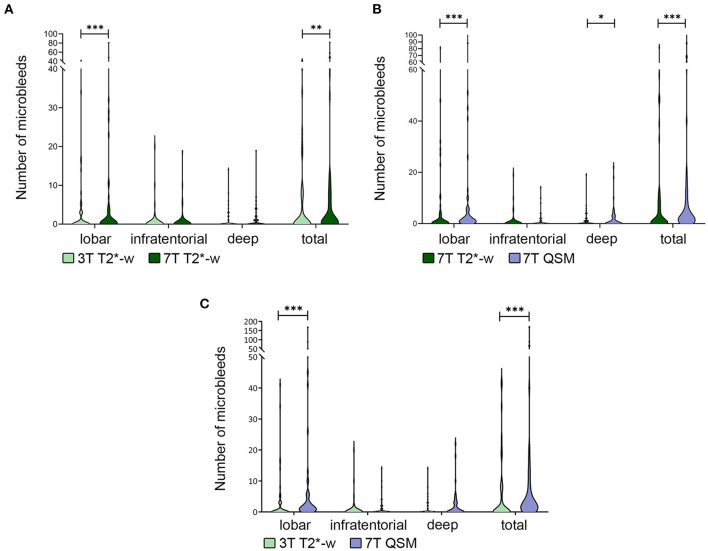
Methods: Both 3 and 7 Tesla (T) MRI were performed in elderly participants without MBs and patients with CSVD. MBs were quantified on T2*-weighted imaging and QSM. Differences in the number of MBs were assessed, and subjects were classified in CSVD subgroups or controls both on 3T T2*-weighted imaging and 7T QSM.

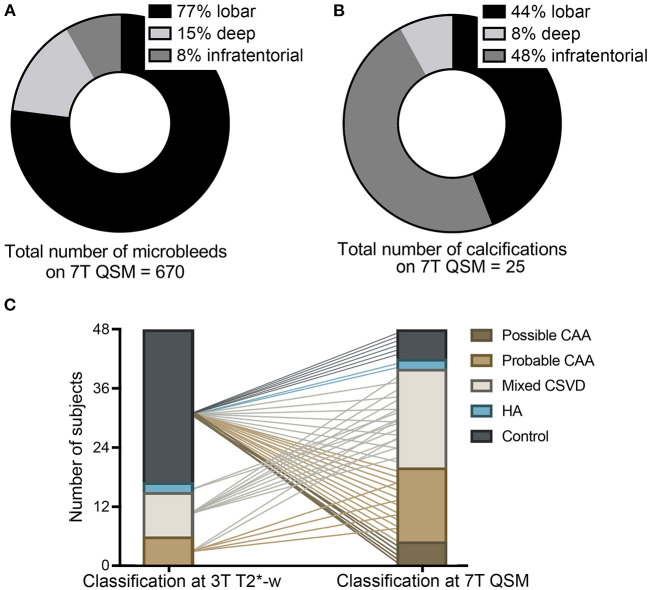
Results: 48 participants [mean age (SD) 70.9 (8.8) years, 48% females] were included: 31 were healthy controls, 6 probable cerebral amyloid angiopathy (CAA), 9 mixed CSVD, and 2 were hypertensive arteriopathy [HA] patients. After accounting for the higher number of MBs detected at 7T QSM (Median = Mdn; Mdn7T-QSM = 2.5; Mdn3T-T2 = 0; z = 4.90; p < 0.001) and false positive MBs (6.1% calcifications), most healthy controls (80.6%) demonstrated at least one MB and more MBs were discovered in the CSVD group.

Conclusions: Our observations suggest that QSM at submillimeter resolution improves the detection of MBs in the elderly human brain. A higher prevalence of MBs than so far known in healthy elderly was revealed.

Keywords: 7 Tesla MRI; cerebral amyloid angiopathy (CAA); cerebral small vessel disease (CSVD); hypertensive arteriopathy (HA); microbleeds; quantitative susceptibility mapping (QSM).


Conflict of interest statement

The authors declare that the research was conducted in the absence of any commercial or financial relationships that could be construed as a potential conflict of interest.

Figures

Figure 1
Figure 1
Visualization of microbleeds on different sequences. Example of a microbleed (MB) visualized as a hypointense round structure in the deep brain region at 3T T2*-w imaging (A); visualization of the same brain region in the same subject at 7T T2*-w imaging, which shows the same MB (arrow) and an additional MB that had remained undetected at 3T (inset) (B). Hyperintense appearance of the deep MB (inset) in the same subject on 7T QSM (C).
Figure 2
Figure 2
Overview of the study participants, the subgroups and the MRI scans performed. CAA, cerebral amyloid angiopathy; poCAA, possible CAA; prCAA, probable CAA; CON, controls; HA, hypertensive arteriopathy.
Figure 3
Figure 3
Differences in number of microbleeds. Legend: Violin plot showing the difference in total number of microbleeds (MBs) and in different brain localizations in 3T vs. 7T T2*-w imaging (A), 7T T2*-w imaging vs. 7T QSM (B), 3T T2*-w imaging vs. 7TQSM (C). The difference in total number of detected MBs is always significant and driven by the difference in number of those in lobar localization. *p < 0.05; **p < 0.01; ***p < 0.001.
Figure 4
Figure 4
Implications of the use of 7T QSM. Legend: Pie charts showing the localization of the total amount of microbleeds (MBs) in our study cohort, as detected on QSM (A) and of calcifications (B), as detected on 7T QSM. Graph (C) elucidating the classification of study participants in the different subgroups at 3T T2*-w imaging and how 7T QSM would impact the neuroimaging-based classification due to the increased number of MBs detected and due to the calcifications. Possible and probable cerebral amyloid angiopathy (CAA, light and dark brown), mixed cerebral small vessel disease (CSVD, white), hypertensive arteriopathy (HA, blue), healthy controls without CSVD (gray) (C).
Figure 5
Figure 5
Visualization of lesions at 7T QSM. Legend: Example of a microbleed (MB) which was not visible at 3T T2*-w imaging in a healthy control (A), but was then detected at 7T QSM [(B), inset]. Calcifications can appear as hypointense round structures on T2*-w imaging, easily mimicking MBs [(C), inset and arrow], however they can be differentiated from MBs in the QSM because of their hypointense appearance [(D), inset and arrow].

Similar articles

Cited by

References

    1. Shoamanesh A, Kwok CS, Benavente O. Cerebral microbleeds: histopathological correlation of neuroimaging. Cerebrovasc Dis. (2011) 32:528–34. 10.1159/000331466 - DOI - PubMed
    1. van Veluw SJ, Charidimou A, van der Kouwe AJ, Lauer A, Reijmer YD, Costantino I, et al. . Microbleed and microinfarct detection in amyloid angiopathy: a high-resolution MRI-histopathology study. Brain. (2016) 139:3151–62. 10.1093/brain/aww229 - DOI - PMC - PubMed
    1. Wardlaw JM, Smith C, Dichgans M. Small vessel disease: mechanisms and clinical implications. Lancet Neurol. (2019) 18:684–96. 10.1016/S1474-4422(19)30079-1 - DOI - PubMed
    1. Martinez-Ramirez S, Greenberg SM, Viswanathan A. Cerebral microbleeds: overview and implications in cognitive impairment. Alzheimers Res Ther. (2014) 6:33. 10.1186/alzrt263 - DOI - PMC - PubMed
    1. Haller S, Vernooij MW, Kuijer JPA, Larsson E-M, Jäger HR, Barkhof F. Cerebral microbleeds: imaging and clinical significance. Radiology. (2018) 287:11–28. 10.1148/radiol.2018170803 - DOI - PubMed