. 2023 Mar 16:10:1133985.
doi: 10.3389/fmolb.2023.1133985. eCollection 2023.

Structural and oxidative investigation of a recombinant high-yielding fetal hemoglobin mutant

Affiliations

Structural and oxidative investigation of a recombinant high-yielding fetal hemoglobin mutant

Karin Kettisen et al. Front Mol Biosci. .

Abstract

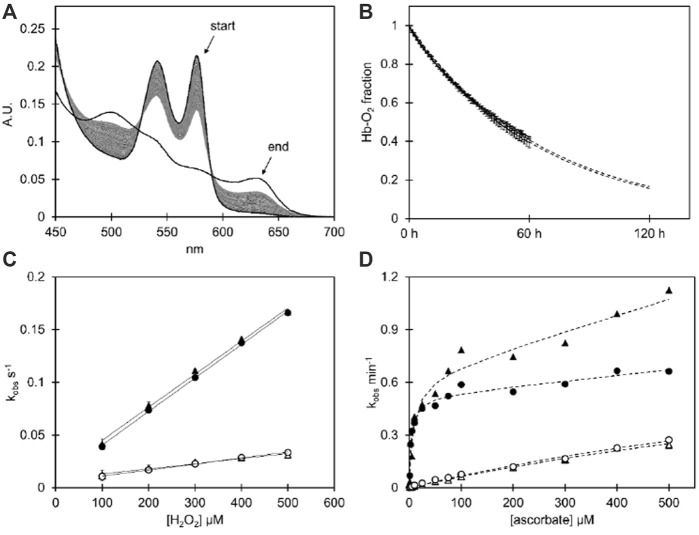
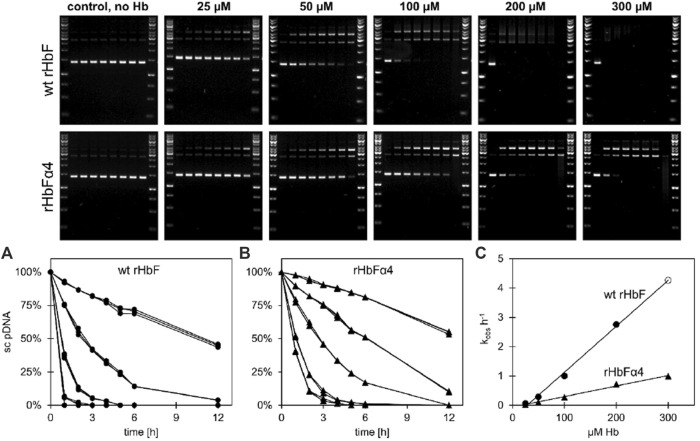
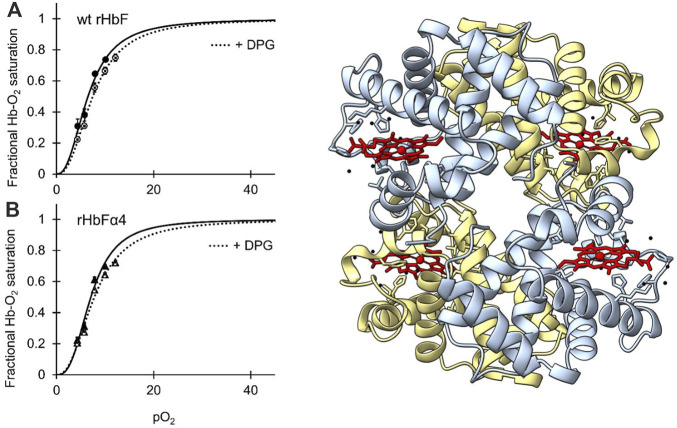
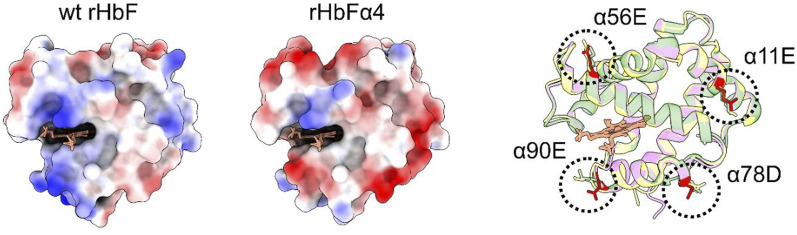
Human fetal hemoglobin (HbF) is an attractive starting protein for developing an effective agent for oxygen therapeutics applications. This requires that HbF can be produced in heterologous systems at high levels and in a homogeneous form. The introduction of negative charges on the surface of the α-chain in HbF can enhance the recombinant production yield of a functional protein in Escherichia coli. In this study, we characterized the structural, biophysical, and biological properties of an HbF mutant carrying four additional negative charges on each α-chain (rHbFα4). The 3D structure of the rHbFα4 mutant was solved with X-ray crystallography at 1.6 Å resolution. Apart from enabling a higher yield in recombinant protein production in E. coli, we observed that the normal DNA cleavage activity of the HbF was significantly lowered, with a four-time reduced rate constant for the rHbFα4 mutant. The oxygen-binding properties of the rHbFα4 mutant were identical to the wild-type protein. No significant difference between the wild-type and rHbFα4 was observed for the investigated oxidation rates (autoxidation and H2O2-mediated ferryl formation). However, the ferryl reduction reaction indicated some differences, which appear to be related to the reaction rates linked to the α-chain.

Keywords: DNA cleavage; X-ray crystallography; fetal hemoglobin; oxygen binding; protein surface net charge; redox reactions.


Conflict of interest statement

The authors declare that the research was conducted in the absence of any commercial or financial relationships that could be construed as a potential conflict of interest.

Figures

FIGURE 1
FIGURE 1
(A) Spectral series of the spontaneous autoxidation reaction of the HbFα4 mutant during 60 h at 37°C in 100 mM phosphate buffer pH 7.4 supplemented with 4.6 U/mL superoxide dismutase, 414 U/mL catalase, and 1 mM EDTA using Hb at 20 µM heme. The end spectrum shows the potassium ferricyanide-induced complete ferric state of the same sample. (B) The autoxidation decay of ferrous O2-bound Hb as resolved by component analysis for wt HbF and the HbFα4 mutant. The data is shown with error bars representing the standard deviation (n = 3), and the fitted single exponential decay equation is depicted as dashed lines, which extend beyond 60 h to represent the extrapolated continued reaction. (C) The graph shows the kobs plotted against the H2O2 concentration of the H2O2-induced ferryl formation experiment (Fe3+ → Fe4+), with a linear fitting of the second-order rate constant µM−-s-1. (D) The plot shows the kobs plotted against ascorbate concentration during the induced reduction from the ferryl to the ferric state of Hb (Fe4+ → Fe3+). The data is fitted with a rectangular hyperbola plus a linear equation for the fast phase (α-subunit), and a single hyperbola for the slow phase (γ-subunit). For graphs (C, D), the fast phase kobs are shown with filled symbols and the slow kobs have open symbols. Circles represent wt HbF and triangles represent HbFα4 mutant. For experimental details cf Material and Methods.
FIGURE 2
FIGURE 2
Plasmid DNA cleavage of wt HbF and the HbFα4 mutant was monitored for 12 h at 37°C in 20 mM phosphate buffer pH 7.2. Without the addition of Hb, no cleavage of the supercoiled (sc) pDNA was observed. In contrast, when Hb was included, the sc form deteriorated and open circular and linear pDNA bands emerged. By increasing the Hb concentrations from 0 µM to 25, 100, 200 and 300 µM (heme) the process was accelerated. The decay of sc pDNA over time was plotted and fitted to a single exponential equation and the data for wt HbF and HbFα4 mutant can be seen in graphs (A) and (B), respectively. Circles represent wt HbF and triangles represent HbFα4 mutant. The obtained rates were then plotted against the Hb concentration and the linear relationship was used to determine the decay constants of pDNA cleavage [graph (C)]. The data point for wt HbF at 300 µM (open circle) in graph (C) is a product of the linear fitting to the other wt HbF data points, due to the lack of detection of the sc DNA band after 1 h of incubation.
FIGURE 3
FIGURE 3
[IN COLOR] Oxygen binding curves of wt HbF (A) and HbFα4 mutant (B) at 37°C, at a Hb concentration of 0.3 mM heme in 0.1 M HEPES buffer pH 7.4 supplemented with 0.1 M KCl. Solid lines represent the oxygen-binding curve without the addition of DPG, while the dotted lines show the oxygen binding with 0.75 mM DPG present. To the right of the graphs, the 3D structure of mutant rHbFα4 obtained by X-ray crystallography is shown (PDB database entry code: 7QU4). The α-subunits are colored light blue and the γ-subunits are light yellow. The heme groups are shown in red while water molecules are colored black. The figure was created in the UCSF ChimeraX molecular visualization program (Goddard et al., 2018).
FIGURE 4
FIGURE 4
[IN COLOR] The α-subunits of the wt and mutant HbF structures are shown with electrostatic surface coloring. Blue color indicates positive charge and red color indicates negative charge. To the right, three different HbF α-subunit structures, one from this work (rHbFα4 purple) and two from the PDB database (1FDH (Soman and Olson, 2013) yellow, 4MQJ (Miklos et al., 2012) green), are three-dimensionally aligned with the peptide backbones shown as ribbons. The mutation sites of the rHbFα4 mutant are colored in red for clarification. All 3D structures of the α-subunit in HbF align and show that the four mutations introduced on the protein in this work do not disrupt the globin fold.

References

    1. Abramov A., Lehmann H., Robb L. (1980). Hb Shaare Zedek (alpha 56 E5 Lys leads to glu). FEBS Lett. 113 (2), 235–237. 10.1016/0014-5793(80)80599-0 - DOI - PubMed
    1. Adams P. D., Afonine P. V., Bunkóczi G., Chen V. B., Davis I. W., Echols N., et al. (2010). PHENIX: A comprehensive python-based system for macromolecular structure solution. Acta Cryst. D. 66 (2), 213–221. 10.1107/S0907444909052925 - DOI - PMC - PubMed
    1. Alayash A. I., Andersen C. B. F., Moestrup S. K., Bulow L. (2013). Haptoglobin: The hemoglobin detoxifier in plasma. TIBTECH 31 (1), 2–3. 10.1016/j.tibtech.2012.10.003 - DOI - PubMed
    1. Alayash A. I. (2014). Blood substitutes: Why haven't we been more successful? Trends Biotechnol. 32 (4), 177–185. 10.1016/j.tibtech.2014.02.006 - DOI - PMC - PubMed
    1. Andersen N. C. M., Fago A., Damsgaard C. (2021). Evolution of hemoglobin function in tropical air‐breathing catfishes. J. Exp. Zool. A 335 (9-10), 814–819. 10.1002/jez.2504 - DOI - PubMed

LinkOut - more resources