. 2023 Mar 16:10:1146916.
doi: 10.3389/fnut.2023.1146916. eCollection 2023.

High-fat intake reshapes the circadian transcriptome profile and metabolism in murine meibomian glands

Affiliations

High-fat intake reshapes the circadian transcriptome profile and metabolism in murine meibomian glands

Sen Zou et al. Front Nutr. .

Abstract

Background: Nutritional and food components reshape the peripheral clock and metabolism. However, whether food challenges affect the circadian clock and metabolism of meibomian glands (MGs) has not been fully explored. This study was designed to analyze alterations in the rhythmic transcriptome and metabolism of MGs of murine fed a balanced diet or a high-fat diet (HFD).

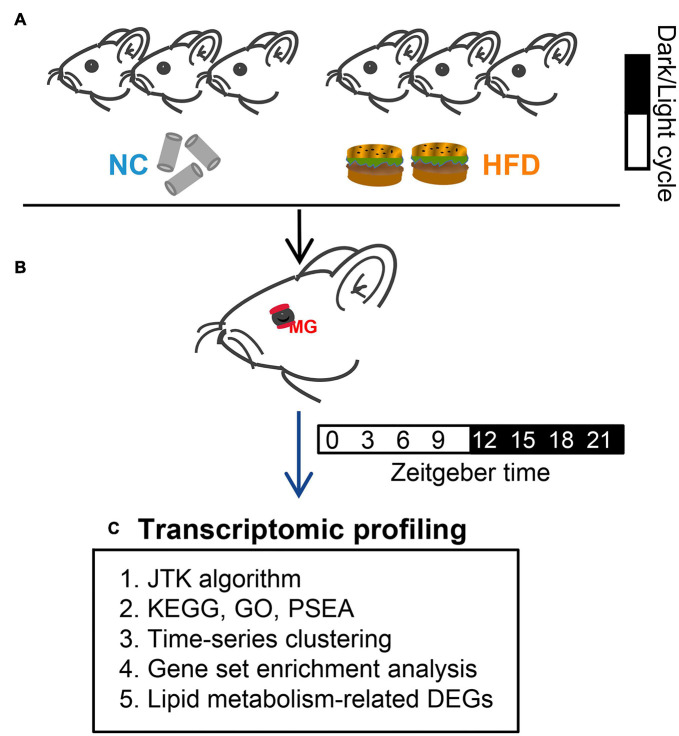
Methods: Male C57BL/6J mice were maintained on a 12/12 h light/dark cycle and fed ad libitum on normal chow (NC) or HFD for 4 weeks. MGs were collected from sacrificed animals at 3-h intervals throughout a 24-h circadian cycle. The circadian transcriptome of MGs was analyzed via bioinformatics approaches using high-throughput RNA sequencing (RNA-seq). In addition, circadian oscillations of lipid components in MGs were analyzed.

Results: Meibomian glands displayed robust transcriptome rhythmicity. HFD feeding significantly altered the circadian transcriptome profile of MGs-including composition and phase-and spatiotemporally affected the enriched signaling pathways. In addition, HFD feeding significantly altered the normal rhythmic oscillations of lipid components in MGs.

Conclusion: Our data show that HFD significantly affects MGs' rhythmicity, which reveals a high sensitivity of MGs' clocks to lipid composition in food.

Keywords: RNA-seq; bioinformatics; circadian rhythm; high-fat diet; meibomian gland; metabolic dysfunction; transcriptome.


Conflict of interest statement

The authors declare that the research was conducted in the absence of any commercial or financial relationships that could be construed as a potential conflict of interest.

Figures

FIGURE 1
FIGURE 1
Experimental design. (A) After adaption, all mice were divided randomly into two groups. Mice in the NC- and HFD-fed groups were provided with standard normal chow and a high-fat diet for 4 weeks, respectively. (B) MGs were obtained from euthanized mice at 3-h intervals (for transcriptomic profiling analysis) or 6-h intervals (for ORO staining) over a 24-h circadian cycle. (C) High-throughput sequencing (RNA-Seq) was performed after MG collection. Circadian gene identification and circadian transcriptomic analysis were performed using the Jonckheere–Terpstra–Kendall (JTK) cycling algorithm. The biological processes and molecular function of genes were annotated by the Kyoto Encyclopedia of Genes and Genomes (KEGG), Gene Ontology (GO), phase set enhanced analysis (PSEA), time-series clustering analysis, and gene set enriched analysis (GSEA).
FIGURE 2
FIGURE 2
High-fat diet (HFD) reprograms the characteristics of the circadian transcriptome in murine MGs. (A) Volcano plot of RNA-seq data for NC- and HFD-fed MG genes. The red and blue dots denote ≥1.2-fold or ≤0.83-fold changes in expression between the NC-fed and HFD-fed MGs, respectively. (B) The number of rhythmic genes in NC- and HFD-fed MGs under different threshold conditions in the JTK_ algorithm. (C) Venn diagram showing the gene sets of the MGs of NC- and HFD-fed mice (JTK algorithm, adjusted P < 0.05 and expression ≥ 0.1). n = 3 mice per group per time point at 3-h intervals. n = 24 mice per group. (D) Heatmaps visualizing the expression levels of 338 shared rhythmic genes in the MGs of NC- (left) and HFD-fed (right) mice at different ZT points at 3-h intervals throughout the circadian cycle. The expression levels were indicated by a color bar ranging from blue to red, with the expression range normalized to ± 2. (E) Heatmaps visualizing the expression levels of 1,059 rhythmic genes unique in the MGs of NC-fed mice at various ZT points at 3-h intervals throughout the circadian cycle. (F) Heatmaps visualizing the expression levels of 1,384 rhythmic genes unique in the MGs of HFD-fed mice at various ZT points at 3-h intervals throughout the circadian cycle. (G–J) Phase analysis of rhythmic genes in the MGs of NC- and HFD-fed mice. Gray shading: dark phase. (K) Phase analysis of 338 shared rhythmic genes in the MGs of NC- and HFD-fed mice. Phase distribution plot for phase-delayed (L) and phase-advanced genes (M) in shared cycling genes. Gray shading: dark phase.
FIGURE 3
FIGURE 3
High-fat diet (HFD) alters the oscillatory characteristics of circadian transcriptomic profiling in murine MGs. (A) Functional annotations for NC-unique (up) and HFD-unique (down) cycling genes by GO Biological Process analysis (Q < 0.05). Phase distribution of significantly enriched KEGG pathways (Q < 0.05) in the MGs of NC-fed (B) and HFD-fed (C) mice. The blue (B) and yellow (C) lines on the outside circle indicate the enriched pathways at various phases. Gray shading: dark phase.
FIGURE 4
FIGURE 4
High-fat diet (HFD) alters the cluster-dependent transcriptomic map. (A,C,E,G) Oscillating patterns of normalized expression for rhythmic genes from four enriched clusters for the MGs of NC-fed mice (left). The enriched KEGG pathways for genes in each cluster (P < 0.05) are shown in the (right) panel. Gray shading: dark phase. (B,D,F,H) Oscillating patterns of normalized expression for rhythmic genes from four enriched clusters for the MGs of HFD-fed mice (left). The enriched KEGG pathways for genes in each cluster (P < 0.05) are shown in the (right) panel. Gray shading: dark phase.
FIGURE 5
FIGURE 5
Expression and oscillation patterns of core clock machinery genes in the MGs of NC- and HFD-fed mice. n = 3 mice per group for each sampling time point. Student’s t-test was performed for each ZT time point for the NC- and HFD-fed mice. Gray shading: dark phase.
FIGURE 6
FIGURE 6
High-fat diet (HFD)-induced lipid metabolism disorder in MGs. (A) Heatmaps visualizing the expression levels of the differentially expressed lipid-associated genes (fold change ≥1.2 or ≤0.83, adjust P < 0.05) in MGs between the NC- and HFD-fed mice at various ZT points at 3-h intervals throughout the circadian cycle. The expression levels were indicated by a color bar ranging from blue to red, with the expression range normalized to ± 3. (B) Heatmaps visualizing the expression levels of the top 20 up- and down-regulated DEGs of lipid metabolism-related genes in the MGs between the NC- and HFD-fed mice at various ZT points. (C) The top 10 significant KEGG annotations of 98 DGEs associated with lipid metabolism in the MGs between the NC- and HFD-fed mice (Q < 0.05). (D) The protein–protein association networks (PPANs) and functional clusters with specific KEGG annotations of lipid metabolism-related DEGs in the MGs between the NC- and HFD-fed mice (Q < 0.05). (E–H) Enrichment plots for triglyceride metabolism/catabolism, PPAR signaling pathway, and fatty acid metabolic process were enriched specifically in the MGs of HFD-fed mice by GSEA analysis. (I) Temporal changes in lipid droplets in the MGs of NC- and HFD-fed mice at 6 -h intervals. Three to five right-sided MGs were randomly selected from each NC- and HFD-fed mouse. n = 6 mice per group per sampling time point. Student’s t-test was performed for each ZT point in the NC- and HFD-fed mice. ***P < 0.001. The gray shading indicates the dark phase. (J) Average lipid droplet accumulation in the MGs of NC- and HFD-fed mice. n = 24 mice per group. Student’s t-test between the NC- and HFD-fed mice. ***P < 0.001. (K) Representative ORO staining images of lipid deposition in the MGs of NC- (left) and HFD-fed (right) mice at ZT18. Scale bar: 50 μm.
FIGURE 7
FIGURE 7
Summary displaying the effects of an HFD on the cyclical transcriptomic profile of MGs. In mice receiving a high-fat dietary regimen, the light-regulated central clock pacemaker (SCN) functions normally and expresses normal sleep/wake and fasting/feeding rhythms. However, a high-fat diet alters the normal circadian rhythmicity transcriptome profiles and lipid droplet oscillation of MGs.

Similar articles

Cited by

References

    1. Knop E, Knop N, Millar T, Obata H, Sullivan D. The international workshop on meibomian gland dysfunction: report of the subcommittee on anatomy, physiology, and pathophysiology of the meibomian gland. Invest Ophthalmol Vis Sci. (2011) 52:1938–78. 10.1167/iovs.10-6997c - DOI - PMC - PubMed
    1. Sun M, Moreno I, Dang M, Coulson-Thomas V. Meibomian gland dysfunction: What have animal models taught us? Int J Mol Sci. (2020) 21:8822. 10.3390/ijms21228822 - DOI - PMC - PubMed
    1. Chhadva P, Goldhardt R, Galor A. Meibomian gland disease: the role of gland dysfunction in dry eye disease. Ophthalmology. (2017) 124:20–6. 10.1016/j.ophtha.2017.05.031 - DOI - PMC - PubMed
    1. Sabeti S, Kheirkhah A, Yin J, Dana R. Management of meibomian gland dysfunction: a review. Surv Ophthalmol. (2020) 65:205–17. 10.1016/j.survophthal.2019.08.007 - DOI - PubMed
    1. Nelson J, Shimazaki J, Benitez-del-Castillo J, Craig J, McCulley J, Den S, et al. The international workshop on meibomian gland dysfunction: report of the definition and classification subcommittee. Invest Ophthalmol Vis Sci. (2011) 52:1930–7. 10.1167/iovs.10-6997b - DOI - PMC - PubMed

LinkOut - more resources