Consumption of sugar sweetened beverages, artificially sweetened beverages and fruit juices and risk of type 2 diabetes, hypertension, cardiovascular disease, and mortality: A meta-analysis
- PMID: 37006931
- PMCID: PMC10050372
- DOI: 10.3389/fnut.2023.1019534
Consumption of sugar sweetened beverages, artificially sweetened beverages and fruit juices and risk of type 2 diabetes, hypertension, cardiovascular disease, and mortality: A meta-analysis
Abstract
Introduction: Sugar-sweetened beverage (SSB) intake is associated with an increased risk of cardiometabolic diseases. However, evidence regarding associations of artificially sweetened beverages (ASBs) and fruit juices with cardiometabolic diseases is mixed. In this study, we aimed to investigate the association between the SSB, ASB and fruit juice consumption with the incidence of cardiometabolic conditions and mortality.
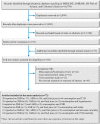
Methods: Relevant prospective studies were identified by searching PubMed, Web of Science, Embase, and Cochrane Library until December 2022 without language restrictions. The pooled relative risk (RR) and 95% confidence intervals (CIs) were estimated for the association of SSBs, ASBs, and fruit juices with the risk of type 2 diabetes (T2D), cardiovascular disease (CVD), and mortality by using random-effect models.
Results: A total of 72 articles were included in this meta-analysis study. Significantly positive associations were observed between the consumption of individual beverages and T2D risk (RR: 1.27; 95% CI: 1.17, 1.38 for SSBs; RR: 1.32; 95% CI: 1.11, 1.56 for ASBs; and RR:0.98; 95% CI: 0.93, 1.03 for fruit juices). Moreover, our findings showed that intakes of SSBs and ASBs were significantly associated with risk of hypertension, stroke, and all-cause mortality (RR ranging from 1.08 to 1.54; all p < 0.05). A dose-response meta-analysis showed monotonic associations between SSB intake and hypertension, T2D, coronary heart disease (CHD), stroke and mortality, and the linear association was only significant between ASB consumption and hypertension risk. Higher SSB and ASB consumptions were associated with a greater risk of developing cardiometabolic diseases and mortality. Fruit juice intake was associated with a higher risk of T2D.
Conclusion: Therefore, our findings suggest that neither ASBs nor fruit juices could be considered as healthier beverages alternative to SSBs for achieving improved health.Systematic Review Registration: [PROSPERO], identifier [No. CRD42022307003].
Keywords: artificially sweetened beverages; cardiovascular disease; fruit juices; hypertension; mortality; sugar sweetened beverages; type 2 diabetes.
Copyright © 2023 Li, Yan, Jiang, Cui, Wu, Wang, Mi, Li, Shi, Fan, Azalati, Li, Chen, Ma, Wang and Ma.
Conflict of interest statement
The authors declare that the research was conducted in the absence of any commercial or financial relationships that could be construed as a potential conflict of interest.
Figures


Similar articles
-
Association of soft drink and 100% fruit juice consumption with all-cause mortality, cardiovascular diseases mortality, and cancer mortality: A systematic review and dose-response meta-analysis of prospective cohort studies.Crit Rev Food Sci Nutr. 2022;62(32):8908-8919. doi: 10.1080/10408398.2021.1937040. Epub 2021 Jun 13. Crit Rev Food Sci Nutr. 2022. PMID: 34121531
-
Sugar- and Artificially Sweetened Beverages Consumption Linked to Type 2 Diabetes, Cardiovascular Diseases, and All-Cause Mortality: A Systematic Review and Dose-Response Meta-Analysis of Prospective Cohort Studies.Nutrients. 2021 Jul 30;13(8):2636. doi: 10.3390/nu13082636. Nutrients. 2021. PMID: 34444794 Free PMC article.
-
Associations between consumption of three types of beverages and risk of cardiometabolic multimorbidity in UK Biobank participants: a prospective cohort study.BMC Med. 2022 Aug 18;20(1):273. doi: 10.1186/s12916-022-02456-4. BMC Med. 2022. PMID: 35978398 Free PMC article.
-
Sugar and artificially sweetened beverages and risk of obesity, type 2 diabetes mellitus, hypertension, and all-cause mortality: a dose-response meta-analysis of prospective cohort studies.Eur J Epidemiol. 2020 Jul;35(7):655-671. doi: 10.1007/s10654-020-00655-y. Epub 2020 Jun 11. Eur J Epidemiol. 2020. PMID: 32529512
-
[Consumption of sugar-sweetened beverages and artificially sweetened beverages and risk of cardiovascular disease: a meta-analysis].Zhonghua Yu Fang Yi Xue Za Zhi. 2021 Sep 6;55(9):1159-1167. doi: 10.3760/cma.j.cn112150-20210729-00726. Zhonghua Yu Fang Yi Xue Za Zhi. 2021. PMID: 34619938 Chinese.
Cited by
-
Physical activity and screen time behavior, and non-alcoholic beverage consumption during the COVID-19 pandemic in the longitudinal study of adult health (ELSA-Brasil).Front Nutr. 2025 May 2;12:1503010. doi: 10.3389/fnut.2025.1503010. eCollection 2025. Front Nutr. 2025. PMID: 40386216 Free PMC article.
-
Umbrella Review of Systematic Reviews and Meta-Analyses on Consumption of Different Food Groups and Risk of Type 2 Diabetes Mellitus and Metabolic Syndrome.J Nutr. 2025 May;155(5):1285-1297. doi: 10.1016/j.tjnut.2025.03.021. Epub 2025 Mar 22. J Nutr. 2025. PMID: 40122387 Free PMC article.
-
Comparison of diet quality indices for predicting metabolic syndrome in Iran: cross-sectional findings from the persian cohort study.Diabetol Metab Syndr. 2024 Oct 28;16(1):253. doi: 10.1186/s13098-024-01490-x. Diabetol Metab Syndr. 2024. PMID: 39465430 Free PMC article.
-
Exploring Sugary Drink Consumption and Perceptions among Primary-School-Aged Children and Parents in Australia.Nutrients. 2024 Sep 30;16(19):3320. doi: 10.3390/nu16193320. Nutrients. 2024. PMID: 39408287 Free PMC article.
-
The Interactive Effects of Fruit Intake Frequency and Serum miR-484 Levels as Biomarkers for Incident Type 2 Diabetes in a Prospective Cohort of the Spanish Adult Population: The Di@bet.es Study.Biomedicines. 2025 Jan 10;13(1):160. doi: 10.3390/biomedicines13010160. Biomedicines. 2025. PMID: 39857744 Free PMC article.
References
-
- Global Food Research Program . (2022). Sugary drink taxes around the world. Chapel Hill. Available at: https://www.globalfoodresearchprogram.org/wp-content/uploads/2022/11/Sug...
LinkOut - more resources
Full Text Sources

