

Development and validation of machine learning models for predicting prognosis and guiding individualized postoperative chemotherapy: A real-world study of distal cholangiocarcinoma
- PMID: 37007095
- PMCID: PMC10050553
- DOI: 10.3389/fonc.2023.1106029
Development and validation of machine learning models for predicting prognosis and guiding individualized postoperative chemotherapy: A real-world study of distal cholangiocarcinoma
Abstract
Background: Distal cholangiocarcinoma (dCCA), originating from the common bile duct, is greatly associated with a dismal prognosis. A series of different studies based on cancer classification have been developed, aimed to optimize therapy and predict and improve prognosis. In this study, we explored and compared several novel machine learning models that might lead to an improvement in prediction accuracy and treatment options for patients with dCCA.
Methods: In this study, 169 patients with dCCA were recruited and randomly divided into the training cohort (n = 118) and the validation cohort (n = 51), and their medical records were reviewed, including survival outcomes, laboratory values, treatment strategies, pathological results, and demographic information. Variables identified as independently associated with the primary outcome by least absolute shrinkage and selection operator (LASSO) regression, the random survival forest (RSF) algorithm, and univariate and multivariate Cox regression analyses were introduced to establish the following different machine learning models and canonical regression model: support vector machine (SVM), SurvivalTree, Coxboost, RSF, DeepSurv, and Cox proportional hazards (CoxPH). We measured and compared the performance of models using the receiver operating characteristic (ROC) curve, integrated Brier score (IBS), and concordance index (C-index) following cross-validation. The machine learning model with the best performance was screened out and compared with the TNM Classification using ROC, IBS, and C-index. Finally, patients were stratified based on the model with the best performance to assess whether they benefited from postoperative chemotherapy through the log-rank test.
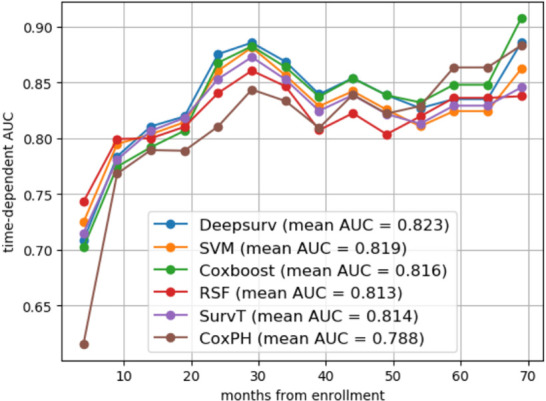
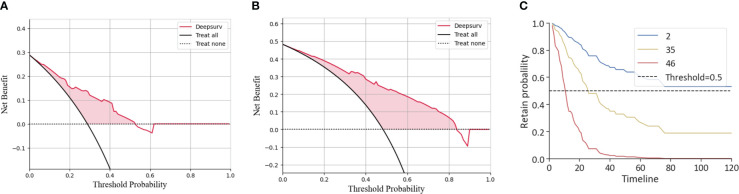
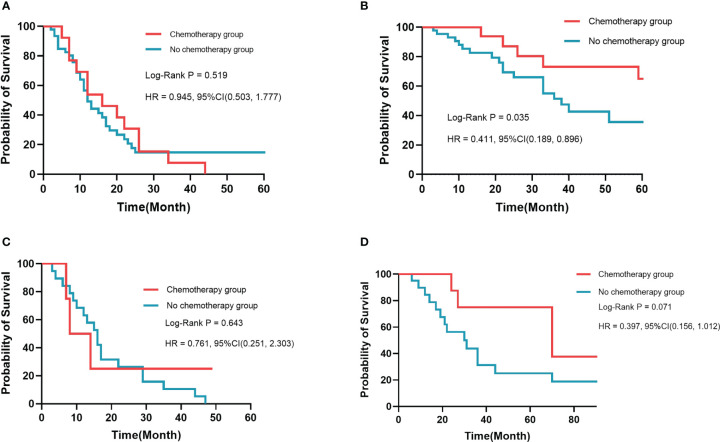
Results: Among medical features, five variables, including tumor differentiation, T-stage, lymph node metastasis (LNM), albumin-to-fibrinogen ratio (AFR), and carbohydrate antigen 19-9 (CA19-9), were used to develop machine learning models. In the training cohort and the validation cohort, C-index achieved 0.763 vs. 0.686 (SVM), 0.749 vs. 0.692 (SurvivalTree), 0.747 vs. 0.690 (Coxboost), 0.745 vs. 0.690 (RSF), 0.746 vs. 0.711 (DeepSurv), and 0.724 vs. 0.701 (CoxPH), respectively. The DeepSurv model (0.823 vs. 0.754) had the highest mean area under the ROC curve (AUC) than other models, including SVM (0.819 vs. 0.736), SurvivalTree (0.814 vs. 0.737), Coxboost (0.816 vs. 0.734), RSF (0.813 vs. 0.730), and CoxPH (0.788 vs. 0.753). The IBS of the DeepSurv model (0.132 vs. 0.147) was lower than that of SurvivalTree (0.135 vs. 0.236), Coxboost (0.141 vs. 0.207), RSF (0.140 vs. 0.225), and CoxPH (0.145 vs. 0.196). Results of the calibration chart and decision curve analysis (DCA) also demonstrated that DeepSurv had a satisfactory predictive performance. In addition, the performance of the DeepSurv model was better than that of the TNM Classification in C-index, mean AUC, and IBS (0.746 vs. 0.598, 0.823 vs. 0.613, and 0.132 vs. 0.186, respectively) in the training cohort. Patients were stratified and divided into high- and low-risk groups based on the DeepSurv model. In the training cohort, patients in the high-risk group would not benefit from postoperative chemotherapy (p = 0.519). In the low-risk group, patients receiving postoperative chemotherapy might have a better prognosis (p = 0.035).
Conclusions: In this study, the DeepSurv model was good at predicting prognosis and risk stratification to guide treatment options. AFR level might be a potential prognostic factor for dCCA. For the low-risk group in the DeepSurv model, patients might benefit from postoperative chemotherapy.
Keywords: AFR; DeepSurv; distal cholangiocarcinoma; individualized treatment; machine learning; post-operative chemotherapy; risk stratification.
Copyright © 2023 Wang, Pan, Huang, Chen, Cui, Lang and Lyu.
Conflict of interest statement
The authors declare that the research was conducted in the absence of any commercial or financial relationships that could be construed as a potential conflict of interest.
Figures


Similar articles
-
Development and validation of a deep learning-based survival prediction model for pediatric glioma patients: A retrospective study using the SEER database and Chinese data.Comput Biol Med. 2024 Nov;182:109185. doi: 10.1016/j.compbiomed.2024.109185. Epub 2024 Sep 27. Comput Biol Med. 2024. PMID: 39341114
-
Deep learning models for predicting the survival of patients with chondrosarcoma based on a surveillance, epidemiology, and end results analysis.Front Oncol. 2022 Aug 22;12:967758. doi: 10.3389/fonc.2022.967758. eCollection 2022. Front Oncol. 2022. PMID: 36072795 Free PMC article.
-
Deep learning models for predicting the survival of patients with hepatocellular carcinoma based on a surveillance, epidemiology, and end results (SEER) database analysis.Sci Rep. 2024 Jun 9;14(1):13232. doi: 10.1038/s41598-024-63531-9. Sci Rep. 2024. PMID: 38853169 Free PMC article.
-
The potential of high-order features of routine blood test in predicting the prognosis of non-small cell lung cancer.BMC Cancer. 2023 Jun 1;23(1):496. doi: 10.1186/s12885-023-10990-4. BMC Cancer. 2023. PMID: 37264319 Free PMC article. Review.
-
A Systematic Review of Artificial Intelligence Models for Time-to-Event Outcome Applied in Cardiovascular Disease Risk Prediction.J Med Syst. 2024 Jul 19;48(1):68. doi: 10.1007/s10916-024-02087-7. J Med Syst. 2024. PMID: 39028429 Free PMC article.
Cited by
-
Application of AI on cholangiocarcinoma.Front Oncol. 2024 Jan 29;14:1324222. doi: 10.3389/fonc.2024.1324222. eCollection 2024. Front Oncol. 2024. PMID: 38347839 Free PMC article. Review.
-
Micro-invasive pancreaticoduodenectomy will be a promising treatment option for distal cholangiocarcinoma.Hepatobiliary Surg Nutr. 2024 Oct 1;13(5):841-844. doi: 10.21037/hbsn-24-331. Epub 2024 Sep 5. Hepatobiliary Surg Nutr. 2024. PMID: 39507723 Free PMC article. No abstract available.
-
Creating a multifaceted prognostic model for cutaneous melanoma: the convergence of single-cell and bulk sequencing with machine learning.Front Cell Dev Biol. 2024 May 6;12:1401945. doi: 10.3389/fcell.2024.1401945. eCollection 2024. Front Cell Dev Biol. 2024. PMID: 38770150 Free PMC article.
-
A logistic regression model to predict long-term survival for borderline resectable pancreatic cancer patients with upfront surgery.Cancer Imaging. 2025 Feb 5;25(1):10. doi: 10.1186/s40644-025-00830-y. Cancer Imaging. 2025. PMID: 39910648 Free PMC article.
References
LinkOut - more resources
Full Text Sources