

Cuproptosis signature and PLCD3 predicts immune infiltration and drug responses in osteosarcoma
- PMID: 37007130
- PMCID: PMC10060837
- DOI: 10.3389/fonc.2023.1156455
Cuproptosis signature and PLCD3 predicts immune infiltration and drug responses in osteosarcoma
Abstract
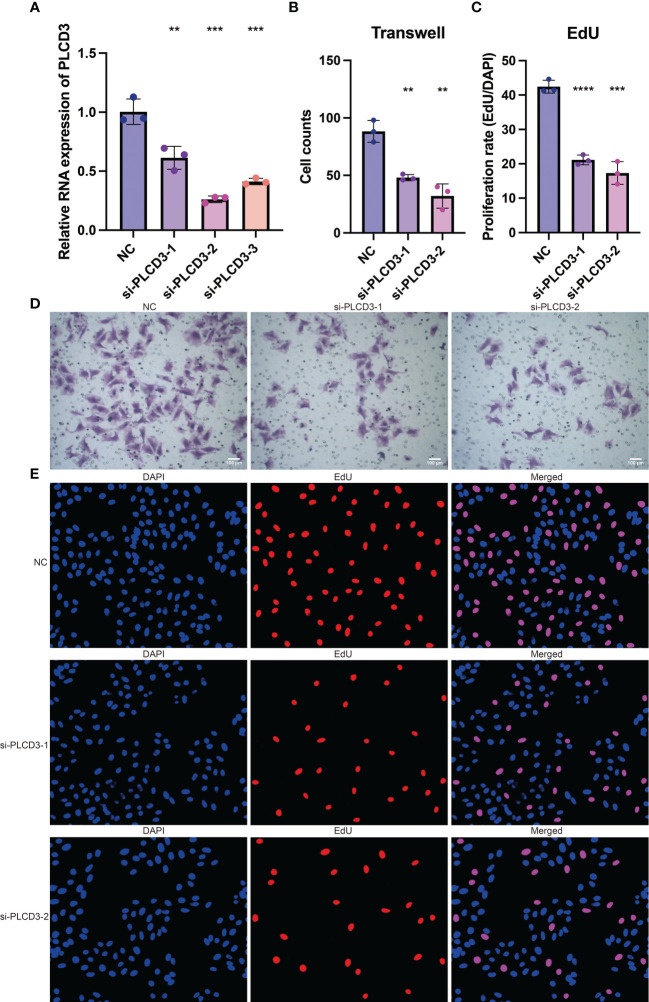
Osteosarcoma (OS) is a cancer that is frequently found in children and adolescents and has made little improvement in terms of prognosis in recent years. A recently discovered type of programmed cell death called cuproptosis is mediated by copper ions and the tricarboxylic acid (TCA) cycle. The expression patterns, roles, and prognostic and predictive capabilities of the cuproptosis regulating genes were investigated in this work. TARGET and GEO provided transcriptional profiling of OS. To find different cuproptosis gene expression patterns, consensus clustering was used. To identify hub genes linked to cuproptosis, differential expression (DE) and weighted gene co-expression network analysis (WGCNA) were used. Cox regression and Random Survival Forest were used to build an evaluation model for prognosis. For various clusters/subgroups, GSVA, mRNAsi, and other immune infiltration experiments were carried out. The drug-responsive study was carried out by the Oncopredict algorithm. Cuproptosis genes displayed two unique patterns of expression, and high expression of FDX1 was associated with a poor outcome in OS patients. The TCA cycle and other tumor-promoting pathways were validated by the functional study, and activation of the cuproptosis genes may also be connected with immunosuppressive state. The robust survival prediction ability of a five-gene prognostic model was verified. This rating method also took stemness and immunosuppressive characteristics into account. Additionally, it can be associated with a higher sensitivity to medications that block PI3K/AKT/mTOR signaling as well as numerous chemoresistances. U2OS cell migration and proliferation may be encouraged by PLCD3. The relevance of PLCD3 in immunotherapy prediction was verified. The prognostic significance, expressing patterns, and functions of cuproptosis in OS were revealed in this work on a preliminary basis. The cuproptosis-related scoring model worked well for predicting prognosis and chemoresistance.
Keywords: cuproptosis; drug response; immune infiltration; machine learning; osteosarcoma; tumor microenvironment.
Copyright © 2023 Hu, Yin, Jiang, Feng, Cai and Wu.
Conflict of interest statement
The authors declare that the research was conducted in the absence of any commercial or financial relationships that could be construed as a potential conflict of interest.
Figures


Similar articles
-
Identification of cuproptosis-related subtypes, construction of a prognosis model, and tumor microenvironment landscape in gastric cancer.Front Immunol. 2022 Nov 21;13:1056932. doi: 10.3389/fimmu.2022.1056932. eCollection 2022. Front Immunol. 2022. PMID: 36479114 Free PMC article.
-
Cuproptosis-related modification patterns depict the tumor microenvironment, precision immunotherapy, and prognosis of kidney renal clear cell carcinoma.Front Immunol. 2022 Sep 23;13:933241. doi: 10.3389/fimmu.2022.933241. eCollection 2022. Front Immunol. 2022. PMID: 36211378 Free PMC article.
-
Comprehensive analysis of cuproptosis in immune response and prognosis of osteosarcoma.Front Pharmacol. 2022 Oct 3;13:992431. doi: 10.3389/fphar.2022.992431. eCollection 2022. Front Pharmacol. 2022. PMID: 36263140 Free PMC article.
-
Identification of a novel cuproptosis-related gene signature and integrative analyses in patients with lower-grade gliomas.Front Immunol. 2022 Aug 15;13:933973. doi: 10.3389/fimmu.2022.933973. eCollection 2022. Front Immunol. 2022. PMID: 36045691 Free PMC article. Review.
-
Machine learning algorithm to construct cuproptosis- and immune-related prognosis prediction model for colon cancer.World J Gastrointest Oncol. 2023 Mar 15;15(3):372-388. doi: 10.4251/wjgo.v15.i3.372. World J Gastrointest Oncol. 2023. PMID: 37009317 Free PMC article. Review.
Cited by
-
Specific signaling pathways mediated programmed cell death in tumor microenvironment and target therapies.Discov Oncol. 2025 May 16;16(1):776. doi: 10.1007/s12672-025-02592-2. Discov Oncol. 2025. PMID: 40377777 Free PMC article. Review.
-
Revealing the key role of cuproptosis in osteoporosis via the bioinformatic analysis and experimental validation of cuproptosis-related genes.Mamm Genome. 2024 Sep;35(3):414-431. doi: 10.1007/s00335-024-10049-0. Epub 2024 Jun 21. Mamm Genome. 2024. PMID: 38904833
-
The role of programmed cell death in osteosarcoma: From pathogenesis to therapy.Cancer Med. 2024 May;13(10):e7303. doi: 10.1002/cam4.7303. Cancer Med. 2024. PMID: 38800967 Free PMC article. Review.
-
Construction and validation of a novel cuproptosis-mitochondrion prognostic model related with tumor immunity in osteosarcoma.PLoS One. 2023 Jul 5;18(7):e0288180. doi: 10.1371/journal.pone.0288180. eCollection 2023. PLoS One. 2023. PMID: 37405988 Free PMC article.
-
Identification and validation of a fatty acid metabolism gene signature for the promotion of metastasis in liver cancer.Oncol Lett. 2023 Sep 6;26(4):457. doi: 10.3892/ol.2023.14044. eCollection 2023 Oct. Oncol Lett. 2023. PMID: 37736554 Free PMC article.
References
LinkOut - more resources
Full Text Sources
Miscellaneous