. 2023 Mar 17:14:1136763.
doi: 10.3389/fgene.2023.1136763. eCollection 2023.

Identification of the cuproptosis-related hub genes and therapeutic agents for sarcopenia

Affiliations

Identification of the cuproptosis-related hub genes and therapeutic agents for sarcopenia

Yingqian Zhu et al. Front Genet. .

Abstract

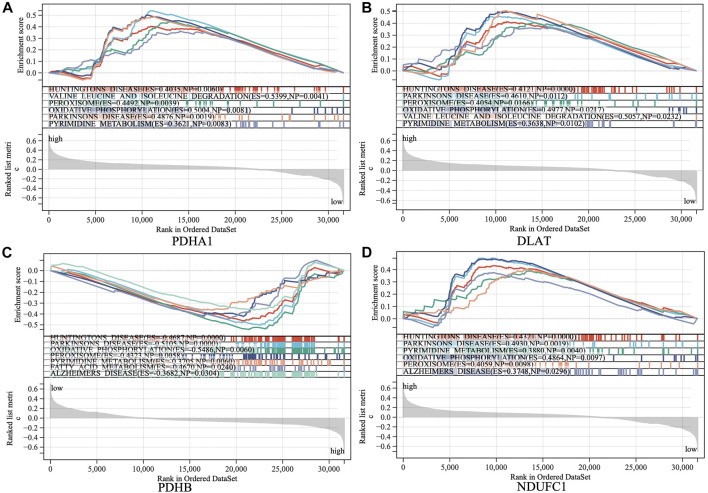
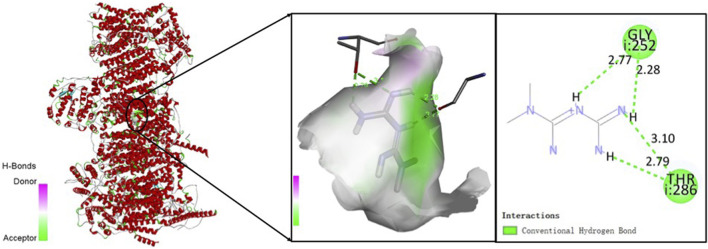
Background: Along with acceleration of population aging, the increasing prevalence of sarcopenia has posed a heavy burden on families as well as society. In this context, it is of great significance to diagnose and intervene sarcopenia as early as possible. Recent evidence has indicated the role of cuproptosis in the development of sarcopenia. In this study, we aimed to seek the key cuproptosis-related genes that can be used for identification and intervention of sarcopenia. Methods: The GSE111016 dataset was retrieved from GEO. The 31 cuproptosis-related genes (CRGs) were obtained from previous published studies. The differentially expressed genes (DEGs) and Weighed gene co-expression network analysis (WGCNA) were subsequently analyzed. The core hub genes were acquired by the intersection of DEGs, WGCNA and CRGs. Through logistic regression analysis, we established a diagnostic model of sarcopenia based on the selected biomarkers and was validated in muscle samples from GSE111006 and GSE167186. In addition, Kyoto Encyclopedia of Genes and Genomes (KEGG) and Gene Ontology (GO) enrichment analysis were performed on these genes. Furthermore, the gene set enrichment analysis (GSEA), and immune cell infiltration were also conducted on the identified core genes. Finally, we screened the potential drugs targeting the potential biomarkers of sarcopenia. Results: A total of 902 DEGs and WGCNA containing 1,281 significant genes were preliminarily selected. Intersection of DEGs, WGCNA and CRGs yielded four core genes (PDHA1, DLAT, PDHB, and NDUFC1) as potential biomarkers for the prediction of sarcopenia. The predictive model was established and validated with high AUC values. KEGG pathway and Gene Ontology biological analysis indicated these core genes may play a crucial role in energy metabolism in mitochondria, oxidation process, and aging-related degenerative diseases. In addition, the immune cells may be involved in the development of sarcopenia through mitochondrial metabolism. Finally, metformin was identified as a promising strategy of sarcopenia treatment via targeting NDUFC1. Conclusion: The four cuproptosis-related genes PDHA1, DLAT, PDHB and NDUFC1 may be the diagnostic biomarkers for sarcopenia, and metformin holds great potential to be developed as a therapy for sarcopenia. These outcomes provide new insights for better understanding of sarcopenia and innovative therapeutic approaches.

Keywords: bioinformatics; cuproptosis; metformin; mitochondrial metabolism; sarcopenia.


Conflict of interest statement

The authors declare that the research was conducted in the absence of any commercial or financial relationships that could be construed as a potential conflict of interest.

Figures

FIGURE 1
FIGURE 1
The flowchart of the study.
FIGURE 2
FIGURE 2
Identification of DEGs. (A) Volcano plot analysis of DEGs. Red color represents high expression, green color represents low expression. (B) The heatmap of top 30-fold-change DEGs. Red areas represent highly expressed genes and green areas represent lowly expressed genes involved in sarcopenia patients compared with healthy controls.
FIGURE 3
FIGURE 3
Screening of key genes by weighted gene co-expression network analysis (WGCNA). The scale independence (A) and the mean connectivity (B) to identify the soft threshold with best performance. (C) Clustering dendrogram and trait heatmap of samples. (D) The heatmap displaying the correlation between gene modules and clinical traits. The rows represent gene modules and columns correspond to clinical traits. Each cell contains the correlation coefficient (upper number) and p value (lower number). (E) Hierarchical cluster dendrogram and color-coding of gene co-expression modules. (F) Scatter plot showing the relationship between gene significance and module membership in the turquoise module.
FIGURE 4
FIGURE 4
Identification of hub genes and Functional enrichment analysis. (A) The Venn diagram of genes among differentially expressed genes (DEGs) list, WGCNA and cuproptosis related genes (CRGs). (B) Kyoto Encyclopedia of Genes and Genomes (KEGG) enrichment analysis for hub genes. (C) Gene Ontology (GO) enrichment analysis for hub genes, including biological processes (BP), cellular components (CC) and molecular functions (MF).
FIGURE 5
FIGURE 5
The expression levels of four hub genes, the establishment and validation of the diagnostic model for sarcopenia. (A) The expression levels of PDHA1, DLAT, PDHB, and NDUFC1 in sarcopenia group were downregulated in GSE111016 dataset. (B) Receiver operating characteristic (ROC) curve and area under the curve (AUC) statistics of predictive model of sarcopenia in GSE111016 dataset. ROC curves and AUC statistics to assess diagnostic efficiency of hub genes on the identification of sarcopenia in GSE111006 (C) and GSE167186 dataset (D).
FIGURE 6
FIGURE 6
Gene set enrichment analysis (GSEA) to identify the enriched pathways of the central hub genes. (A) PDHA1; (B) DLAT; (C) PDHB; (D) NDUFC1.
FIGURE 7
FIGURE 7
The proportions and correlations of immune cells among sarcopenia group and healthy control group. (A) The relative abundance of 17 distinct immune cells subsets. (B) The expression levels of immune cells shown in box plots among sarcopenia group and healthy control group, p < 0.05 indicated statistical difference. (C) The spearman’ correlation of each hub gene with different immune cell subsets. The rows correspond to immune cell subsets and each columns represents a hub gene. Each cell contains the correlation coefficient (upper number) and -log10 (p value) (lower number). (D) The correlations between different populations of immune cell subsets.
FIGURE 8
FIGURE 8
The three-dimensional molecular docking diagram of metformin and target protein NDUFC1.
FIGURE 9
FIGURE 9
The two-dimensional molecular docking diagram of metformin and target protein NDUFC1. Hydrogen bonds are shown as green lines, and hydrophobic forces are denoted as pink color.

Similar articles

Cited by

References

    1. Alvarez-Calderon F., Gregory M. A., Pham-Danis C., DeRyckere D., Stevens B. M., Zaberezhnyy V., et al. (2015). Tyrosine kinase inhibition in leukemia induces an altered metabolic state sensitive to mitochondrial perturbations. Clin. Cancer Res. 21 (6), 1360–1372. 10.1158/1078-0432.Ccr-14-2146 - DOI - PMC - PubMed
    1. Alway S. E., Mohamed J. S., Myers M. J. (2017). Mitochondria initiate and regulate sarcopenia. Exerc Sport Sci. Rev. 45 (2), 58–69. 10.1249/jes.0000000000000101 - DOI - PMC - PubMed
    1. Bandmann O., Weiss K. H., Kaler S. G. (2015). Wilson's disease and other neurological copper disorders. Lancet Neurol. 14 (1), 103–113. 10.1016/s1474-4422(14)70190-5 - DOI - PMC - PubMed
    1. Berman H. M., Westbrook J., Feng Z., Gilliland G., Bhat T. N., Weissig H., et al. (2000). The protein Data Bank. Nucleic Acids Res. 28 (1), 235–242. 10.1093/nar/28.1.235 - DOI - PMC - PubMed
    1. Burté F., Carelli V., Chinnery P. F., Yu-Wai-Man P. (2015). Disturbed mitochondrial dynamics and neurodegenerative disorders. Nat. Rev. Neurol. 11 (1), 11–24. 10.1038/nrneurol.2014.228 - DOI - PubMed

LinkOut - more resources