. 2023 Mar 17:14:1157305.
doi: 10.3389/fgene.2023.1157305. eCollection 2023.

Immune responses of different COVID-19 vaccination strategies by analyzing single-cell RNA sequencing data from multiple tissues using machine learning methods

Affiliations

Immune responses of different COVID-19 vaccination strategies by analyzing single-cell RNA sequencing data from multiple tissues using machine learning methods

Hao Li et al. Front Genet. .

Abstract

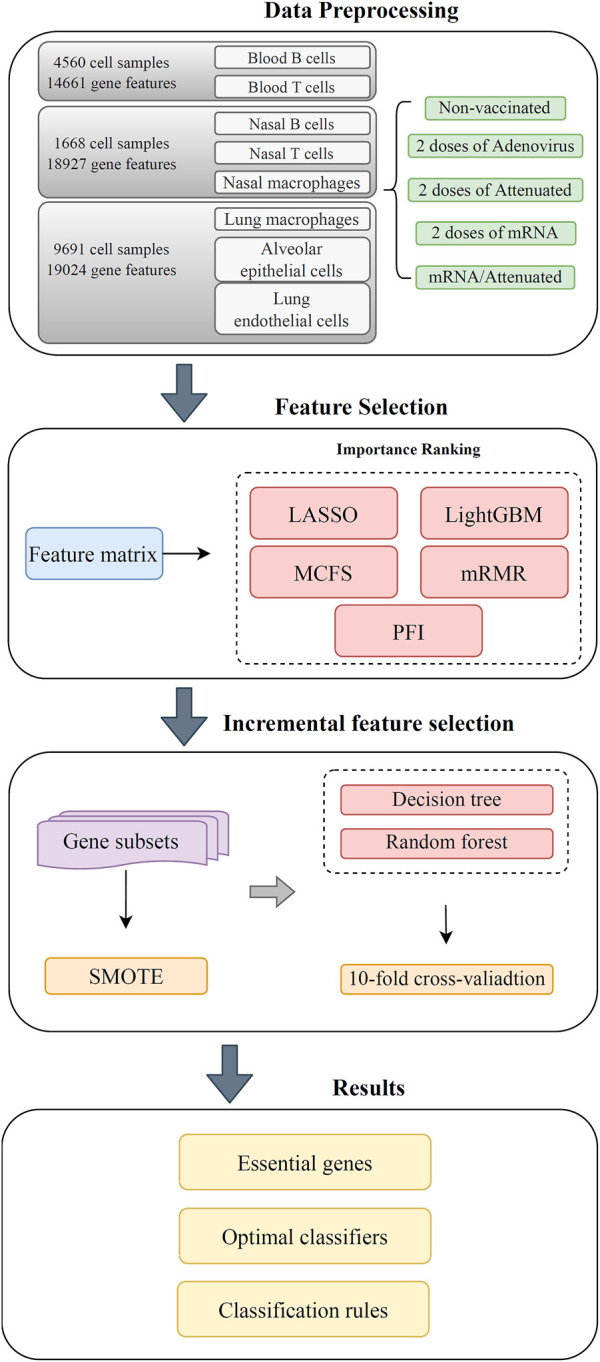
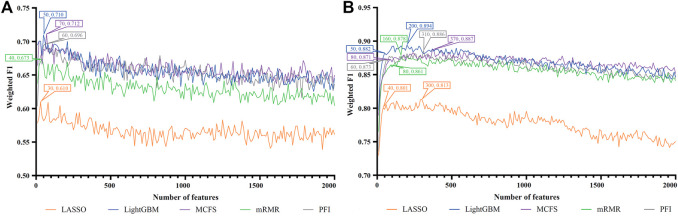
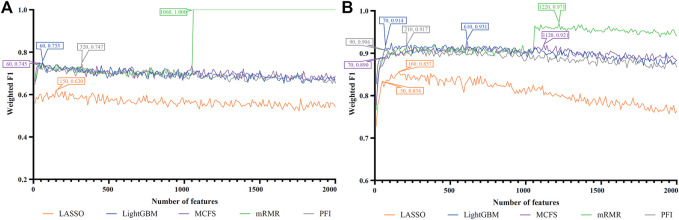
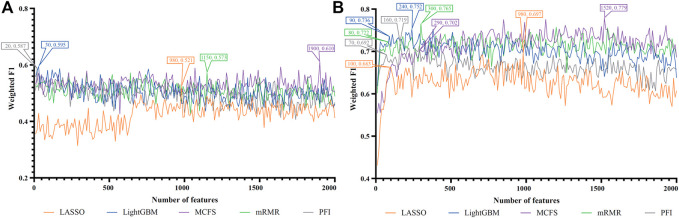
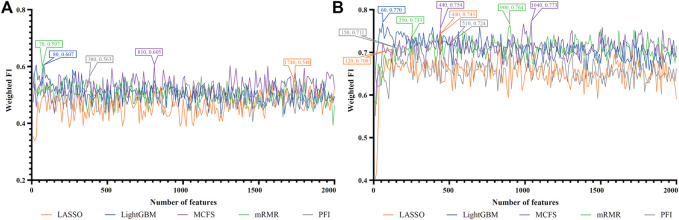
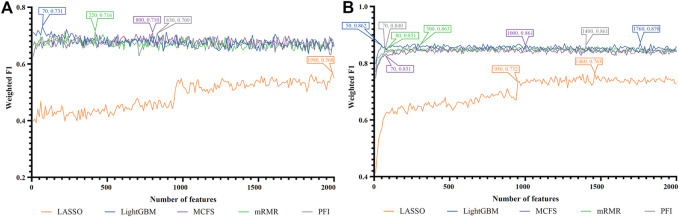
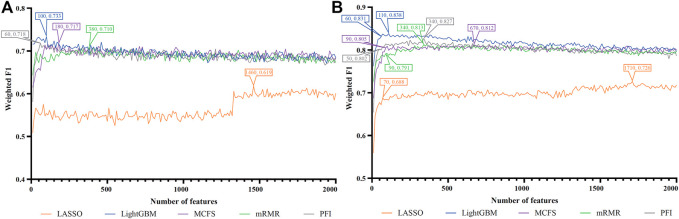
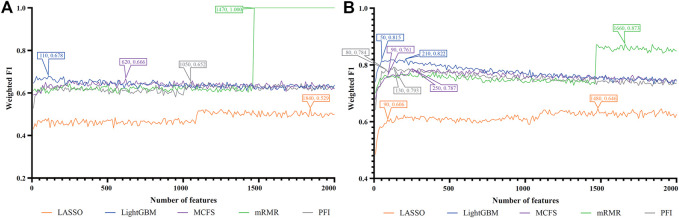
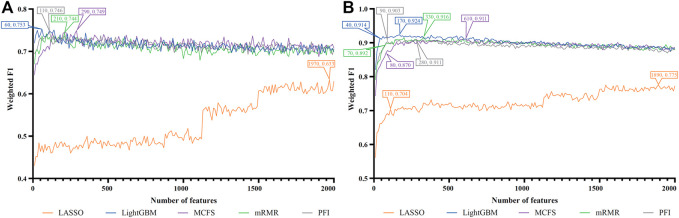
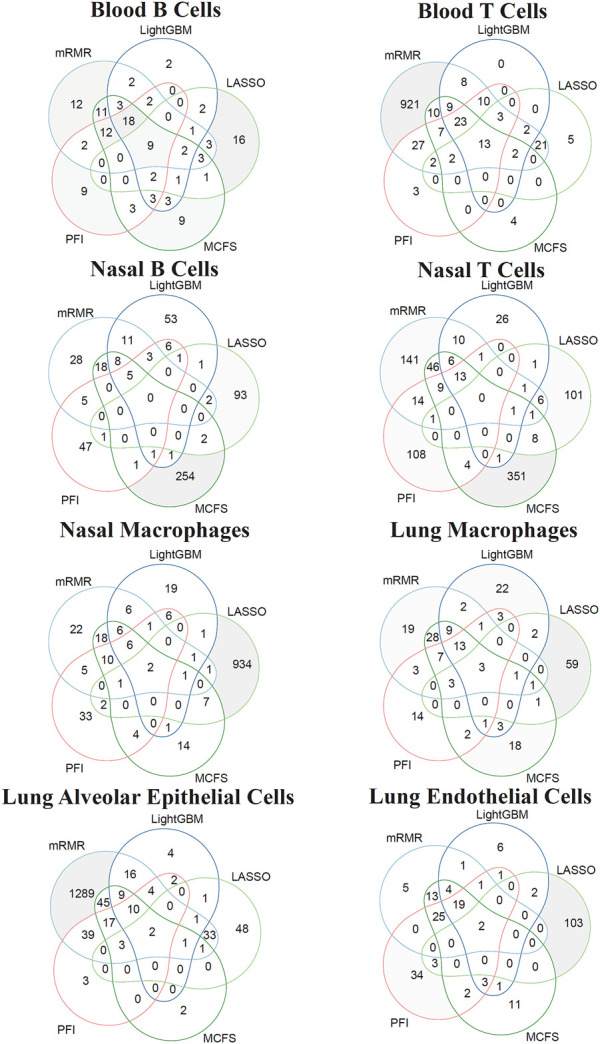
Multiple types of COVID-19 vaccines have been shown to be highly effective in preventing SARS-CoV-2 infection and in reducing post-infection symptoms. Almost all of these vaccines induce systemic immune responses, but differences in immune responses induced by different vaccination regimens are evident. This study aimed to reveal the differences in immune gene expression levels of different target cells under different vaccine strategies after SARS-CoV-2 infection in hamsters. A machine learning based process was designed to analyze single-cell transcriptomic data of different cell types from the blood, lung, and nasal mucosa of hamsters infected with SARS-CoV-2, including B and T cells from the blood and nasal cavity, macrophages from the lung and nasal cavity, alveolar epithelial and lung endothelial cells. The cohort was divided into five groups: non-vaccinated (control), 2*adenovirus (two doses of adenovirus vaccine), 2*attenuated (two doses of attenuated virus vaccine), 2*mRNA (two doses of mRNA vaccine), and mRNA/attenuated (primed by mRNA vaccine, boosted by attenuated vaccine). All genes were ranked using five signature ranking methods (LASSO, LightGBM, Monte Carlo feature selection, mRMR, and permutation feature importance). Some key genes that contributed to the analysis of immune changes, such as RPS23, DDX5, PFN1 in immune cells, and IRF9 and MX1 in tissue cells, were screened. Afterward, the five feature sorting lists were fed into the feature incremental selection framework, which contained two classification algorithms (decision tree [DT] and random forest [RF]), to construct optimal classifiers and generate quantitative rules. Results showed that random forest classifiers could provide relative higher performance than decision tree classifiers, whereas the DT classifiers provided quantitative rules that indicated special gene expression levels under different vaccine strategies. These findings may help us to develop better protective vaccination programs and new vaccines.

Keywords: COVID-19 vaccination; SARS-CoV-2 infection; classification rule; immune response; machine learning method.


Conflict of interest statement

The authors declare that the research was conducted in the absence of any commercial or financial relationships that could be construed as a potential conflict of interest.

Figures

FIGURE 1
FIGURE 1
Flow chart of the entire computational analysis. Gene expression profiling data of SARS-CoV-2 infection in hamster were analyzed using a machine learning based approach with samples from blood T cells, blood B cells, nasal T cells, nasal B cells, lung macrophages, nasal macrophages, alveolar epithelial cells, and lung endothelial cells. Each cell has five vaccination states, that is, unvaccinated, two doses of adenovirus vaccine, two doses of attenuated virus vaccine, two doses of mRNA vaccine, and one dose of mRNA followed by one dose of attenuated vaccine. Gene features were analyzed by five feature selection methods, namely, LASSO, LightGBM, MCFS, mRMR, and PFI. The resulting feature lists were fed into the incremental feature selection (IFS) method to extract the underlying genes, construct effective classifiers and classification rules.
FIGURE 2
FIGURE 2
IFS curves of two classification algorithms on five feature lists for blood B cells. (A) IFS curves of the decision tree (DT). (B) IFS curves of the random forest (RF). The best DT/RF classifier used top 70/200 features in the MCFS/LightGBM feature list.
FIGURE 3
FIGURE 3
IFS curves of two classification algorithms on five feature lists for blood T cells. (A) IFS curves of the decision tree (DT). (B) IFS curves of the random forest (RF). The best DT/RF classifier used top 1,060/1,220 features in the mRMR/mRMR feature list.
FIGURE 4
FIGURE 4
IFS curves of two classification algorithms on five feature lists for nasal B cells. (A) IFS curves of the decision tree (DT). (B) IFS curves of the random forest (RF). The best DT/RF classifier used top 1900/1,520 features in the MCFS/MCFS feature list.
FIGURE 5
FIGURE 5
IFS curves of two classification algorithms on five feature lists for nasal T cells. (A) IFS curves of the decision tree (DT). (B) IFS curves of the random forest (RF). The best DT/RF classifier used top 80/1,040 features in the LightGBM/MCFS feature list.
FIGURE 6
FIGURE 6
IFS curves of two classification algorithms on five feature lists for nasal macrophages. (A) IFS curves of the decision tree (DT). (B) IFS curves of the random forest (RF). The best DT/RF classifier used top 70/1760 features in the LightGBM/LightGBM feature list.
FIGURE 7
FIGURE 7
IFS curves of two classification algorithms on five feature lists for lung macrophages. (A) IFS curves of the decision tree (DT). (B) IFS curves of the random forest (RF). The best DT/RF classifier used top 100/110 features in the LightGBM/LightGBM feature list.
FIGURE 8
FIGURE 8
IFS curves of two classification algorithms on five feature lists for lung alveolar epithelial cells. (A) IFS curves of the decision tree (DT). (B) IFS curves of the random forest (RF). The best DT/RF classifier used top 1,470/1,660 features in the mRMR/mRMR feature list.
FIGURE 9
FIGURE 9
IFS curves of two classification algorithms on five feature lists for lung endothelial cells. (A) IFS curves of the decision tree (DT). (B) IFS curves of the random forest (RF). The best DT/RF classifier used top 60/170 features in the LightGBM/LightGBM feature list.
FIGURE 10
FIGURE 10
Venn diagram of the features used in feasible classifiers on five feature lists that were generated by LASSO, LightGBM, MCFS, mRMR, and PFI for eight cell types. The overlapping circles indicated genes that were identified to be important by multiple ranking algorithms.

References

    1. Ahmed F. (2020). A network-based analysis reveals the mechanism underlying vitamin D in suppressing cytokine storm and virus in SARS-CoV-2 infection. Front. Immunol. 11, 590459. 10.3389/fimmu.2020.590459 - DOI - PMC - PubMed
    1. Akbulut S., Yağın F. H., olak C. (2022). Prediction of COVID-19 based on genomic biomarkers of metagenomic next-generation sequencing data using artificial intelligence Technology. Erciyes Med. J. 44, 544–548. 10.14744/etd.2022.00868 - DOI
    1. Ariumi Y. (2022). Host cellular RNA helicases regulate SARS-CoV-2 infection. J. Virol. 96, e0000222. 10.1128/jvi.00002-22 - DOI - PMC - PubMed
    1. Arowolo O., Pobezinsky L., Suvorov A. (2021). Chemical exposures affect innate immune response to SARS-CoV-2. Int. J. Mol. Sci. 22, 12474. 10.3390/ijms222212474 - DOI - PMC - PubMed
    1. Ballesteros Reviriego C., Clare S., Arends M. J., Cambridge E. L., Swiatkowska A., Caetano S., et al. (2019). FBXO7 sensitivity of phenotypic traits elucidated by a hypomorphic allele. PLoS One 14, e0212481. 10.1371/journal.pone.0212481 - DOI - PMC - PubMed