. 2023 Mar 16:11:1140118.
doi: 10.3389/fbioe.2023.1140118. eCollection 2023.

Osteochondrogenesis by TGF-β3, BMP-2 and noggin growth factor combinations in an ex vivo muscle tissue model: Temporal function changes affecting tissue morphogenesis

Affiliations

Osteochondrogenesis by TGF-β3, BMP-2 and noggin growth factor combinations in an ex vivo muscle tissue model: Temporal function changes affecting tissue morphogenesis

Heng Liu et al. Front Bioeng Biotechnol. .

Abstract

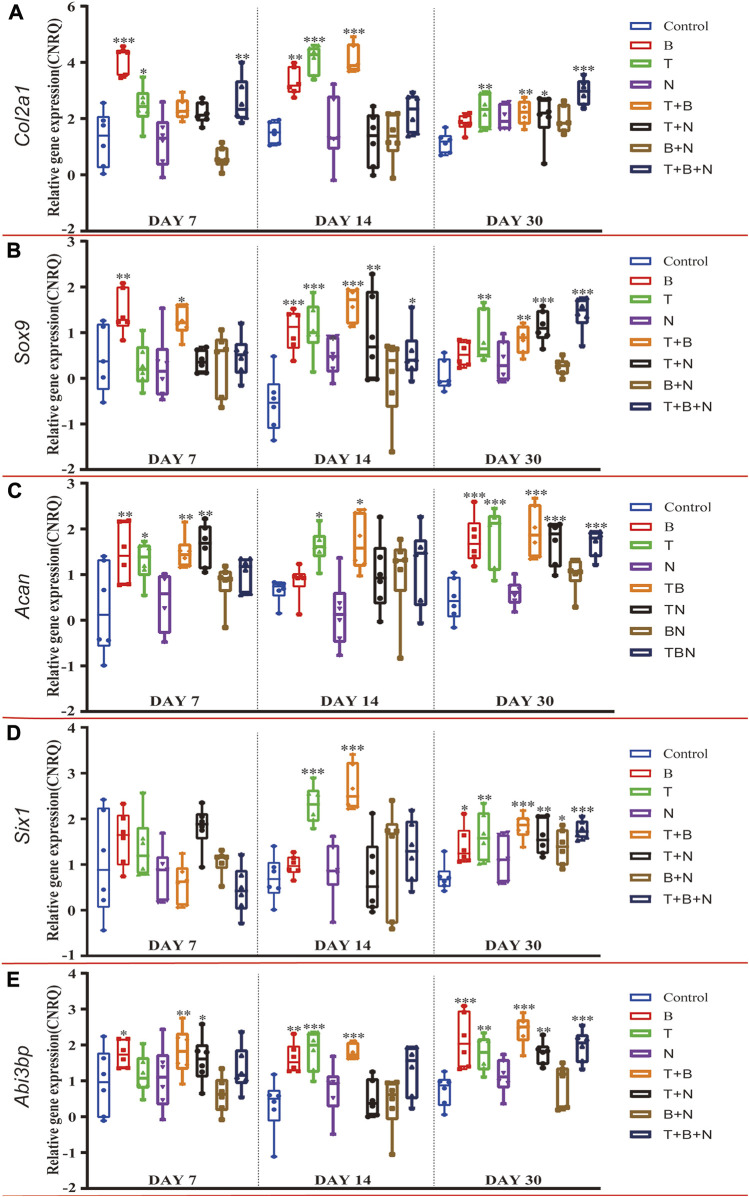
In the absence of clear molecular insight, the biological mechanism behind the use of growth factors applied in osteochondral regeneration is still unresolved. The present study aimed to resolve whether multiple growth factors applied to muscle tissue in vitro, such as TGF-β3, BMP-2 and Noggin, can lead to appropriate tissue morphogenesis with a specific osteochondrogenic nature, thereby revealing the underlying molecular interaction mechanisms during the differentiation process. Interestingly, although the results showed the typical modulatory effect of BMP-2 and TGF-β3 on the osteochondral process, and Noggin seemingly downregulated specific signals such as BMP-2 activity, we also discovered a synergistic effect between TGF-β3 and Noggin that positively influenced tissue morphogenesis. Noggin was observed to upregulate BMP-2 and OCN at specific time windows of culture in the presence of TGF-β3, suggesting a temporal time switch causing functional changes in the signaling protein. This implies that signals change their functions throughout the process of new tissue formation, which may depend on the presence or absence of specific singular or multiple signaling cues. If this is the case, the signaling cascade is far more intricate and complex than originally believed, warranting intensive future investigations so that regenerative therapies of a critical clinical nature can function properly.

Keywords: BMP-2; TGF-β3; muscle tissue; noggin; temporal modulation; tissue engineering.


Conflict of interest statement

The authors declare that the research was conducted in the absence of any commercial or financial relationships that could be construed as a potential conflict of interest.

Figures

FIGURE 1
FIGURE 1
The relative gene expression of (A) Col2a1, (B) Sox9, (C) Acan, (D) Six1 and (E) Abi3bp at 7, 14, and 30 days, which were shown as CNRQ. The asterisks indicate that the stimulated group is statistically significant compared to the control group. The baseline number 0 indicates non-cultured fresh tissue was used as the normalization parameter. (n = 6; *p < 0.05; **p < 0.01; ***p < 0.001).
FIGURE 2
FIGURE 2
The staining results of Alcian Blue in each group. (A) Staining results on day 30; the positive staining color was blue (marked by black arrows). (B) Histomorphometrical assessment; the result was shown as Mean IOD/Area. Control group vs. stimulated groups at 7, 14, and 30 days; the asterisks indicate that the stimulated group is statistically significant compared to the control group. (Magnification: ×40; n = 6; *p < 0.05; **p < 0.01; ***p < 0.001).
FIGURE 3
FIGURE 3
The staining results of ACAN antigen in IHC in each group. (A) Staining results on day 30; the positive staining color was green (marked by black arrows). (B) Histomorphometrical assessment; the result was shown as Mean IOD/Area. Control group vs. stimulated groups at 7, 14, and 30 days; the asterisks indicate that the stimulated group is statistically significant compared to the control group. (Magnification: ×40; n = 6; *p < 0.05; **p < 0.01; ***p < 0.001).
FIGURE 4
FIGURE 4
The relative gene expression of (A) Alp, (B) Runx2, (C) Bmp-2, (D) Ocn, and (E) Col1a1 at 7, 14, and 30 days, which were shown as CNRQ. The asterisks indicate that the stimulated group is statistically significant compared to the control group. The baseline number 0 indicates non-cultured fresh tissue was used as the normalization parameter. (n = 6; *p < 0.05; **p < 0.01; ***p < 0.001).
FIGURE 5
FIGURE 5
The staining results of Alizarin Red S in each group. (A) Staining results on day 30; the positive staining color was red (marked by black arrows). (B) Histomorphometrical assessment; the result was shown as Mean IOD/Area. Control group vs. stimulated groups at 7, 14, and 30 days; the asterisks indicate that the stimulated group is statistically significant compared to the control group. (Magnification: ×40; n = 6; *p < 0.05; **p < 0.01; ***p < 0.001).
FIGURE 6
FIGURE 6
The staining results of the OCN antigen in the IHC in each group. (A) Staining results on day 30; the positive staining color was green (marked by black arrows). (B) Histomorphometrical assessment; the result was shown as Mean IOD/Area. Control group vs. stimulated groups at 7, 14, and 30 days; the asterisks indicate that the stimulated group is statistically significant compared to the control group. (Magnification: ×40; n = 6; *p < 0.05; **p < 0.01; ***p < 0.001).
FIGURE 7
FIGURE 7
Heat map of gene expression. All relative gene expression at 7 (A), 14 (B) and 30 days (C). Acan = Aggrecan, Col2a1= Collagen type II alpha 1, Sox9 = Sex determining region Y (SRY)-box transcription factor 9, Six1= Six homeobox 1, Abi3bp = Abi family member 3 binding protein, Runx2 = Runx family transcription factor 2, Alp= Alkaline phosphatase, Bmp-2 = Bone morphogenetic protein-2, Ocn = Osteocalcin, Col1a1 = Collagen type I alpha 1 chain; (n = 6).
FIGURE 8
FIGURE 8
Heat map of histomorphometrical analyses. (A) Alcian Blue staining. (B) Alizarin Red S staining. (C) IHC-ACAN staining. (D) IHC-OCN staining. IHC = Immunohistochemistry, ACAN = Aggrecan, OCN = Osteocalcin; (n = 6).
FIGURE 9
FIGURE 9
A graphical abstract of the whole experiment.

Similar articles

Cited by

References

    1. Albert R. (2005). Scale-free networks in cell biology. J. Cell Sci. 118 (21), 4947–4957. 10.1242/jcs.02714 - DOI - PubMed
    1. Alhadlaq A., Mao J. J. (2005). Tissue-engineered osteochondral constructs in the shape of an articular condyle. J. bone Jt. Surg. Am. volume 87 (5), 936–944. 10.2106/jbjs.d.02104 - DOI - PubMed
    1. Alliston T., Piek E., Derynck R., Miyazono K., Derynck R. (2008), TGF-Beta family signaling in skeletal development, maintenance, and disease. 667
    1. Bami M., Mavrogenis A. F., Angelini A., Milonaki M., Mitsiokapa E., Stamoulis D., et al. (2016). Bone morphogenetic protein signaling in musculoskeletal cancer. J. Cancer Res. Clin. Oncol. 142 (10), 2061–2072. 10.1007/s00432-016-2149-9 - DOI - PMC - PubMed
    1. Bayramov A. V., Eroshkin F. M., Martynova N. Y., Ermakova G. V., Solovieva E. A., Zaraisky A. G. (2011). Novel functions of noggin proteins: Inhibition of activin/nodal and wnt signaling. Development 138 (24), 5345–5356. 10.1242/dev.068908 - DOI - PubMed

LinkOut - more resources