. 2023 Apr 1;14(2):529-547.
doi: 10.14336/AD.2022.0826.

Positive Feedback Regulation of Circular RNA Hsa_circ_0000566 and HIF-1α promotes Osteosarcoma Progression and Glycolysis Metabolism

Affiliations

Positive Feedback Regulation of Circular RNA Hsa_circ_0000566 and HIF-1α promotes Osteosarcoma Progression and Glycolysis Metabolism

Shuying Shen et al. Aging Dis. .

Abstract

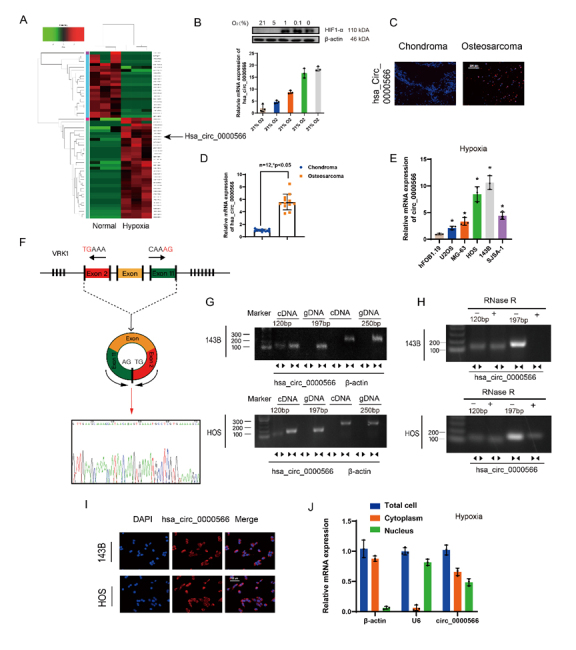
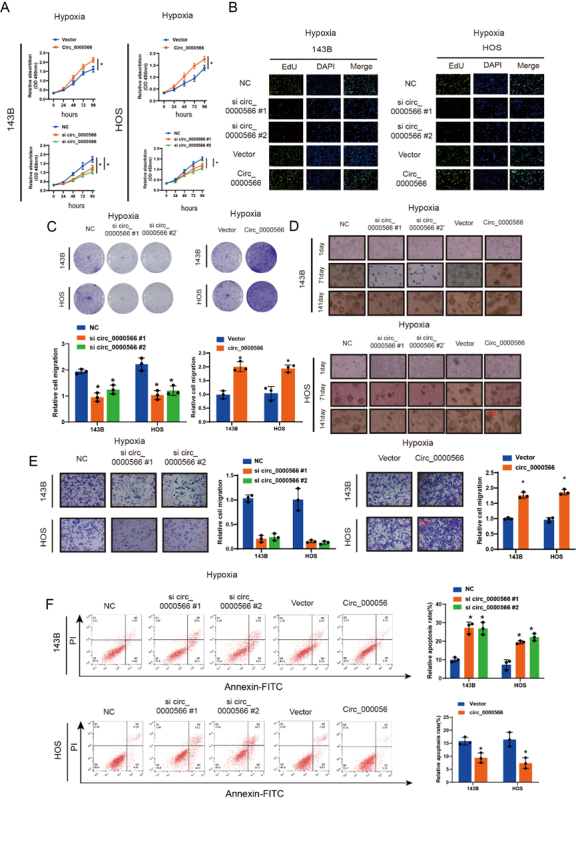
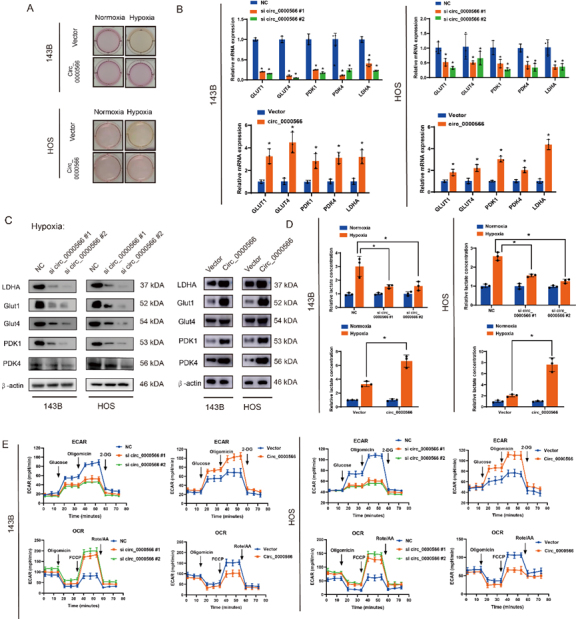
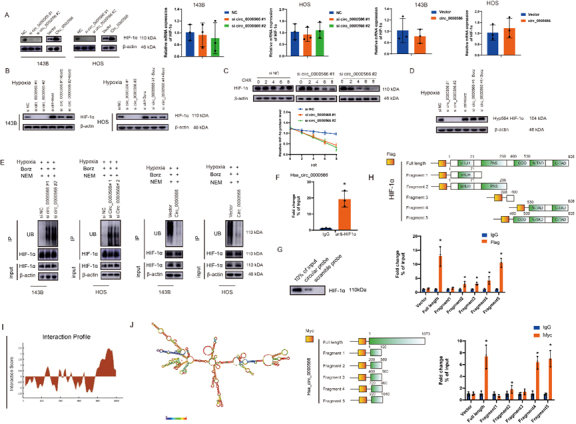
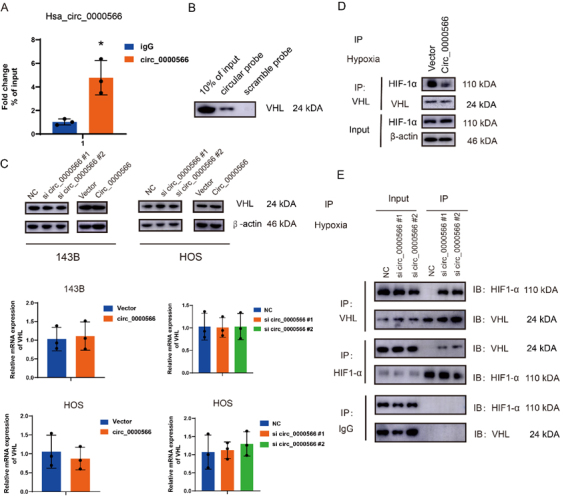
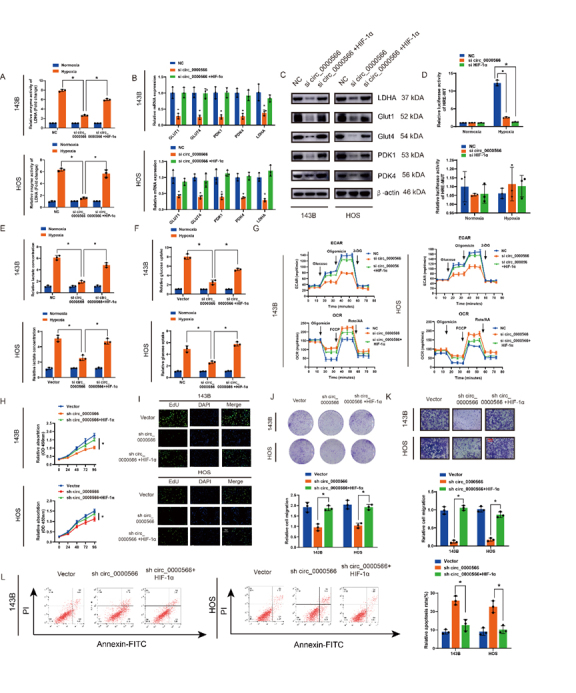
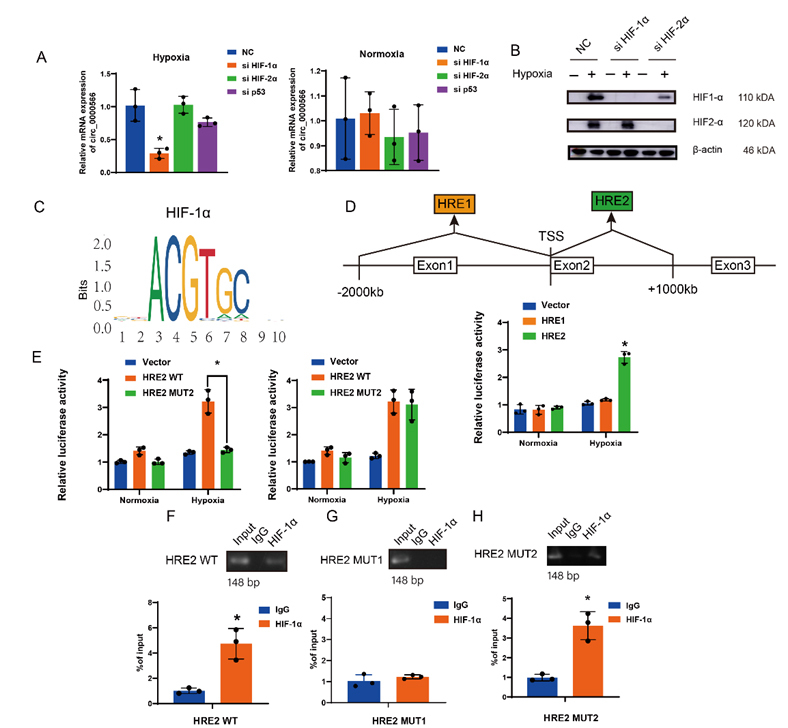
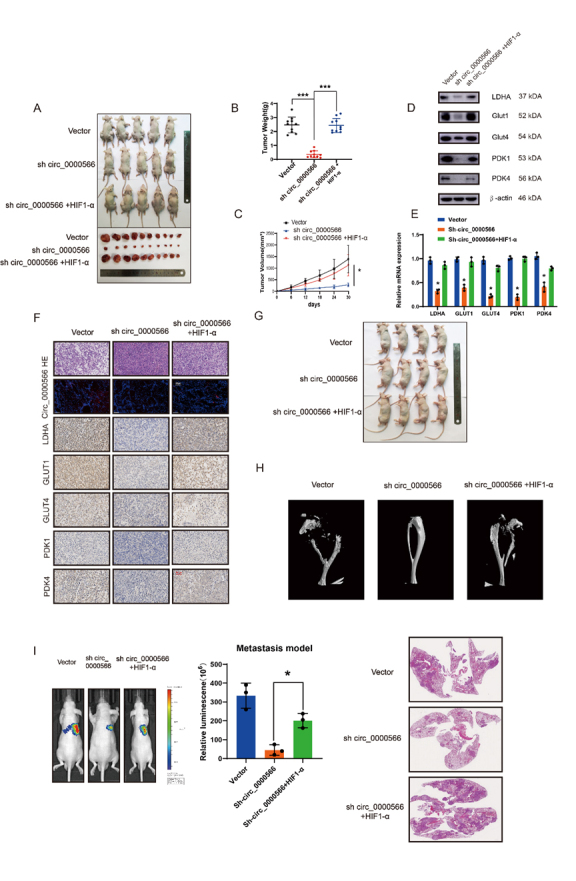
Hypoxia is an indispensable factor for cancer progression and is closely associated with the Warburg effect. Circular RNAs (CircRNA) have garnered considerable attention in molecular malignancy therapy as they are potentially important modulators. However, the roles of circRNAs and hypoxia in osteosarcoma (OS) progression have not yet been elucidated. This study reveals the hypoxia-sensitive circRNA, Hsa_circ_0000566, that plays a crucial role in OS progression and energy metabolism under hypoxic stress. Hsa_circ_0000566 is regulated by hypoxia-inducible factor-1α (HIF-1α) and directly binds to it as well as to the Von Hippel-Lindau (VHL) E3 ubiquitin ligase protein. Consequentially, binding between VHL and HIF-1α is impeded. Furthermore, Hsa_circ_0000566 contributes to OS progression by binding to HIF-1α (while competing with VHL) and by confers protection against HIF-1α against VHL-mediated ubiquitin degradation. These findings demonstrate the existence of a positive feedback loop formed by HIF-1α and Hsa_circ_0000566 and the key role they play in OS glycolysis. Taken together, these data indicate the significance of Hsa_circ_0000566 in the Warburg effect and suggest that Hsa_circ_0000566 could be a potential therapeutic target to combat OS progression.

Keywords: Circular RNA; Warburg effect; hypoxia; hypoxia-inducible factor-1α; osteosarcoma.


Conflict of interest statement

Conflict of Interest The authors declare that there are no competing financial interests related to this study.

Figures

Figure 1.
Figure 1.
Hypoxia-associated circRNA profiling and expression characteristics of Hsa_circ_0000566 in osteosarcoma (OS). (A) CircRNA microarray analysis reveals 35 upregulated and 23 downregulated circRNAs in OS cells under normoxic and hypoxic conditions. The black arrow represents Hsa_circ_0000566. (B) OS cells incubated under various oxygen concentrations. Total RNA extraction was performed for qRT-PCR assay. Western blotting was performed to determine the protein level of HIF-1α. Results are reported as mean ± standard deviation (SD), *p < 0.05, n = 3. Scale bars, 200 μm. (C) Hsa_circ_0000566 expression is much higher in primary OS tissue than in chondroma tissue. Results are representative images according to three different experiments. (D) Quantitative real-time polymerase chain reaction (qRT-PCR) results comparing Hsa_circ_0000566 mRNA expression in 12 OS and chondroma samples. Results are reported as mean ± SD, *p < 0.05, n = 12. (E) Hsa_circ_0000566 expression levels in hFOB1.19 and various OS cell lines. Results are reported as mean ± SD, *p < 0.05, n = 3. (F) Schematic diagram showing Hsa_circ_0000566 back-spliced by exons 2-11 of the VRK1 gene and the corresponding Sanger sequencing. (G) RT-PCR results validating the presence of Hsa_circ_0000566 in 143B and HOS cells. Various primers amplified the Hsa_circ_0000566 region in cDNA but not in genomic DNA. β-actin was used as the negative control. Divergent primers are presented as the opposite direction of the arrowhead, and the convergent primers were shown as the face-to-face direction of the arrowhead. (H) RT-PCR results indicating Hsa_circ_0000566 and VRK1 mRNA expression in untreated 143B and HOS cells and in the cells subjected to treatment with RNase-R. (I) RNA fluorescence in situ hybridization (FISH) results revealing Hsa_circ_0000566 localized mainly in the cytoplasm. Hsa_circ_0000566 probes were labeled with cy3 and nuclei were stained with 4’,6-diamidino-2-phenylindole (DAPI). Scale bars, 100 μm. (J) qRT-PCR determination of the main localization of Hsa_circ_0000566 in OS cells. Results are reported as mean ± SD, *p < 0.05, n = 3.
Figure 2.
Figure 2.
Hsa_circ_0000566 contributes to in vitro osteosarcoma (OS) cell progression under hypoxic conditions. (A) Hsa_circ_0000566 overexpression and knockdown induced and repressed OS cell proliferation under hypoxia. Results are reported as mean ± standard deviation (SD), *p < 0.05, n = 3. Circ_0000566 represents Hsa_circ_0000566 overexpression, and si circ_0000566 represents Hsa_circ_0000566 knockdown. Vector and Si NC represents the negative control of Hsa_circ_0000566 overexpression and Hsa_circ_0000566 knockdown, respectively. (B) EdU exhibits the impact of Hsa_circ_0000566 on OS cell proliferation under hypoxia. Nuclei are stained with 4’,6-diamidino-2-phenylindole (DAPI). Results are reported as mean ± SD, *p < 0.05, n = 3. Scale bars, 100 μm. (C) Colony formation experiment verifies Hsa_circ_0000566 functions in OS cells under hypoxia. Results are reported as mean ± SD, *p < 0.05, n = 3. (D) Soft agar colony formation assay indicates the effects of Hsa_circ_0000566 on 143B and HOS cell colony forming capacity under hypoxia. Results are reported as mean ± SD, *p < 0.05, n = 3. Scale bars, 100 μm. (E) OS cell migration capacity as determined by Transwell™ migration assays. Results are reported as mean ± SD, *p < 0.05, n = 3. Scale bars, 100 μm. (F) Flow cytometry verifies Hsa_circ_0000566 functions in OS cell apoptosis. Results are reported as mean ± SD, *p < 0.05, n = 3.
Figure 3.
Figure 3.
Hsa_circ_0000566 accelerates osteosarcoma (OS) glucose metabolism and regulates hypoxia-enhanced glycolysis. (A) Colors of the media indicate that Hsa_circ_0000566 silencing decreased lactate accumulation under hypoxia. (B-C) Quantitative real-time polymerase chain reaction (qRT-PCR) or western blots evaluating the expression levels of genes involved in glucose metabolism in 143B and HOS cells transfected with Hsa_circ_0000566-overexpressing, Hsa_circ_0000566 (shRNA), or vector plasmids. Results are reported as mean ± standard deviation (SD), *p < 0.05, n = 3. (D) Hsa_circ_0000566 knockdown in OS cells with decreased lactate accumulation, while Hsa_circ_0000566 overexpression has increased lactate accumulation. Results are reported as mean ± SD, *p < 0.05, n = 3. (E) Extracellular acidification rate (ECAR) indicates glycolysis rate. ECAR decreases in response to Hsa_circ_0000566 knockdown and increases in response to Hsa_circ_0000566 overexpression. Oxygen consumption rate (OCR) represented mitochondrial respiratory capacity. OCR is enhanced in response to Hsa_circ_0000566 silencing and reduced in response to Hsa_circ_0000566 overexpression in OS cells. Results are reported as mean ± SD, *p < 0.05, n = 3.
Figure 4.
Figure 4.
Hsa_circ_0000566 establishes interactions with HIF-1α and confers protection against ubiquitination-mediating degradation. (A) Effects of Hsa_circ_0000566 knockdown and Hsa_circ_0000566 overexpression on mRNA and protein expression in 143B and HOS cells under hypoxia. Results are reported as mean ± standard deviation (SD), *p < 0.05, n = 3. (B) Western blotting results revealing the impact of bortezomib treatment on the changes occurring at HIF-1α protein level mediated by Hsa_circ_0000566 silencing and vector transfection. (C) Western blotting assessment of the impact of CHX treatment on the variations in HIF-1α protein levels affected by Hsa_circ_0000566 silencing and vectors. Results are reported as mean ± SD, *p < 0.05, n = 3. (D) The western blot illustrates the effects of Hsa_circ_0000566 knockdown in the Hyp564 HIF-1α protein levels in the presence or absence of bortezomib treatment. (E) Immunoprecipitation assessing the HIF-1α ubiquitination levels in Hsa_circ_0000566 silencing and Hsa_circ_0000566 overexpressing osteosarcoma (OS) cells under hypoxia. Culture media were supplemented with bortezomib (250 nM) for 6 h. (F) The combination of Hsa_circ_0000566 with HIF-1α confirmed by radioimmunoprecipitation (RIP). Results are reported as mean ± SD, *p < 0.05, n = 3. (G) Pulldown assay validation of the interaction between Hsa_circ_0000566 and HIF-1α. (H) A RIP assay of HIF-1α regions interacting with Hsa_circ_0000566. Schematic diagram shows HIF-1α protein fragments. Results are reported as mean ± SD, *p < 0.05, n = 3. (I) Interaction profile between Hsa_circ_0000566 and HIF-1α obtained from catRAPID (left). (J) Schematic diagram showing Hsa_circ_0000566 RNA fragments. Combinative regions between Hsa_circ_0000566 and HIF-1α were identified by RIP assay. Results are reported as mean ± SD, *p < 0.05, n = 3.
Figure 5.
Figure 5.
Hypoxia-induced Hsa_circ_0000566 stabilizes HIF-1α by attenuating interactions between Von Hippel—Lindau (VHL) and HIF-1α. (A) The interaction between VHL and Hsa_circ_0000566, assessed by performing a RIP assay. Results are reported as mean ± standard deviation (SD), *p < 0.05, n = 3. (B) Interaction between VHL and Hsa_circ_0000566, identified by conducting pulldown assays. (C) Effects of Hsa_circ_0000566 silencing and Hsa_circ_0000566 overexpression on VHL protein and mRNA expression, identified by performing western blotting and quantitative real-time polymerase chain reaction (qRT-PCR). (D) Immunoprecipitation experiment revealing VHL-HIF-1α interaction that is inhibited by Hsa_circ_0000566 overexpression. (E) Sequential coimmunoprecipitation assay, performed to determine whether Hsa_circ_0000566 could simultaneously bind VHL and HIF-1α.
Figure 6.
Figure 6.
HIF-1α overexpression reverses Hsa_circ_0000566 silencing-induced attenuation of osteosarcoma (OS) cell proliferation, migration, and glucose metabolism. (A) Hsa_circ_0000566 silencing in OS cells inhibits LDHA enzyme activity, whereas HIF-1α overexpression promotes enzyme activity. (B-C) Quantitative real-time polymerase chain reaction (qRT-PCR) and western blots identifying the effects of HIF-1α overexpression in Hsa_circ_0000566 knockdown OS cells. Results are reported as mean ± standard deviation (SD), *p < 0.05, n = 3. (D) A luciferase report assay showing that Hsa_circ_0000566 knockdown markedly reversed HIF-1α transcription induced by hypoxic stress. Results are reported as mean ± SD, *p < 0.05, n = 3. (E-F) HIF-1α overexpression recovered Hsa_circ_0000566 knockdown-induced decreases in glucose uptake and lactate production. Results are reported as mean ± SD, *p < 0.05, n = 3. (G) Extracellular acidification rate (ECAR) and oxygen consumption rate (OCR) indicate that HIF-1α overexpression recovered the decline in glycolysis rate induced by Hsa_circ_0000566 knockdown under hypoxia. Results are reported as mean ± SD, *p < 0.05, n = 3. CCK-8 experiments reveal that HIF-1α and Hsa_circ_0000566 silencing affects OS cell proliferation under hypoxia. Results are reported as mean ± SD, *p < 0.05, n = 3. (I) EdU assay shows that HIF-1α and Hsa_circ_0000566 silencing influences OS cell vitality. Scale bars, 100 μm. (J) Colony formation assay indicates that colony formation ability is mediated by HIF-1α and Hsa_circ_0000566 knockdown. Results are reported as mean ± SD, *p < 0.05, n = 3. (K) Effects of HIF-1α and Hsa_circ_0000566 attenuation on tumor migration, as evidenced by Transwell™ migration assay results. Results are reported as mean ± SD, *p < 0.05, n = 3. Scale bars, 100 μm. (L) Flow cytometry evaluates the impact of HIF-1α and Hsa_circ_0000566 attenuation on OS cell apoptosis. Results are reported as mean ± SD, *p < 0.05, n = 3.
Figure 7.
Figure 7.
HIF-1α targets and regulates Hsa_circ_0000566 in glycolysis under hypoxic stress. (A-B) Quantitative real-time polymerase chain reaction (qRT-PCR) and western blotting demonstrates that among vital transcription factors such as HIF-1α, HIF-2α, p53, and Hsa_circ_0000566, only Hsa_circ_0000566 is induced by HIF-1α under hypoxia. Results are reported as mean ± standard deviation (SD), *p < 0.05, n = 3. (C) The HIF-1 motif. (D) Luciferase report assays identifying the effective binding regions on Hsa_circ_0000566. Results are reported as mean ± SD, *p < 0.05, n = 3. (E) Luciferase gene experiment shows that mutant 1 is the binding site that regulates Hsa_circ_0000566 transcription. Results are reported as mean ± SD, *p < 0.05, n = 3. (F-H) ChIP assay indicates that HIF-1α is not bound to the genomic region after mutation of HRE2 mutant 1. Results are reported as mean ± SD, *p < 0.05, n = 3. (I) Schematic diagram of the HIF-1α/Hsa_circ_0000566/HIF-1α loop.
Figure 8.
Figure 8.
Hsa_circ_0000566 promotes osteosarcoma (OS) glucose metabolism and tumorigenesis progression in vivo. (A) 143B cells stably transfected with Hsa_circ_0000566 knockdown, HIF-1α overexpression, or empty vector plasmids. Nude mice were subcutaneously injected with 1 × 10⁷ cells that were either stable negative controls or those with Hsa_circ_0000566 knockdown, HIF-1α overexpression, or Hsa_circ_0000566 knockdown. Thirty days after injection, the animals were euthanized, and their tumors dissected and photographed. (B) Tumor weight measurements on the same day the mice were euthanized. Results are reported as mean ± standard deviation (SD), *p < 0.05, n = 5. (C) Tumor volumes (ab2/2) were calculated every 6 d from the day after the mice were injected with stable OS cells. (D-E) Western blotting and quantitative real-time polymerase chain reaction (qRT-PCR) exhibit the expression levels of the genes involved in glycolysis metabolism. Results are reported as mean ± SD, *p < 0.05, n = 3. (F) Fluorescence in situ hybridization (FISH), hematoxylin and eosin (H&E) staining, and immunohistochemistry (IHC) analysis indicate the OS organization in mice and relative GLUT1, GLUT4, PDK1, PDK4, and LDHA protein levels in tumors from different groups. (G) In situ tumor formation experiment reveals that HIF-1α overexpression recovered Hsa_circ_0000566 knockdown-induced tumor attenuation. Results are reported as mean ± SD, *p < 0.05, n = 4. (H) Micro-computed tomography (CT) indicates the functions of HIF-1α and Hsa_circ_0000566 knockdown in bone loss. (I) H&E staining of lung metastasis. In mice injected in the tail vein with various stable 143B cells, lung metastasis was detected using an in vivo bioluminescence imaging system. Results are reported as mean ± SD, *p < 0.05, n = 5.

References

    1. Gill J, Gorlick R (2021). Advancing therapy for osteosarcoma. Nat Rev Clin Oncol. - PubMed
    1. Ritter J, Bielack SS (2010). Osteosarcoma. Ann Oncol,21 Suppl 7:vii320-325. - PubMed
    1. Kansara M, Teng MW, Smyth MJ, Thomas DM (2014). Translational biology of osteosarcoma. Nat Rev Cancer, 14:722-735. - PubMed
    1. Corre I, Verrecchia F, Crenn V, Redini F, Trichet V (2020). The Osteosarcoma Microenvironment: A Complex But Targetable Ecosystem. Cells, 9. - PMC - PubMed
    1. Bielack SS, Kempf-Bielack B, Delling G, Exner GU, Flege S, Helmke K, et al.. (2002). Prognostic factors in high-grade osteosarcoma of the extremities or trunk: an analysis of 1,702 patients treated on neoadjuvant cooperative osteosarcoma study group protocols. J Clin Oncol, 20:776-790. - PubMed

LinkOut - more resources