Real-Time Crystal Growth Monitoring of Boric Acid from Sodium or Lithium Sulfate Containing Aqueous Solutions by Atomic Force Microscopy
- PMID: 37008081
- PMCID: PMC10061539
- DOI: 10.1021/acsomega.2c06953
Real-Time Crystal Growth Monitoring of Boric Acid from Sodium or Lithium Sulfate Containing Aqueous Solutions by Atomic Force Microscopy
Abstract
The crystal growth of boric acid from an aqueous solution in the absence and presence of sodium and lithium sulfate was studied by real-time monitoring. For this purpose, atomic force microscopy in situ has been used. The results show that the growth mechanism of boric acid from its pure and impure solutions is spiral growth driven by screw dislocation and that the velocity of advancement of steps on the crystal surface, and the relative growth rate (ratio of the growth rate in presence and absence of a salt) is reduced in the presence of salts. The reduction of the relative growth rate could be explained by the inhibition of advancement of steps of the (001) face mainly in the growth direction [100] caused by the adsorption of salts on the actives sites and the inhibition of the formation of sources of steps such as dislocations. The adsorption of the salts on the crystal surface is anisotropic and independent of the supersaturation and preferentially on the active sites of the (100) edge. Moreover, this information is of significance for the improvement of the quality of boric acid recovered from brines and minerals and the synthesis of nanostructures and microstructures of boron-based materials.
© 2023 The Authors. Published by American Chemical Society.
Conflict of interest statement
The authors declare no competing financial interest.
Figures


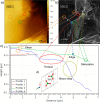
 ; ● (light green),
  ; ● (dark green),
  ; ● (purple),
  ; -●- (sky blue), [100].


 direction. (c) Velocity of advancement
of steps v in the [100] direction.


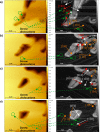
 at the same salt concentrations, supersaturation,
and temperature stated above. ---, trend lines. —, experimental
bar lines.
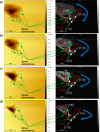
 . The coverage of active sites by an impurity,
θl, for the boric acid crystal surface in the presence
of, cimp, Na2SO4, ●(red), and Li2SO4, ●(blue),
—, calculated from
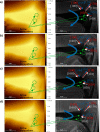
  . Shaded regions indicate 95% confidence
intervals for the model forecast. —, experimental bar lines.
. Shaded regions indicate 95% confidence
intervals for the model forecast. —, experimental bar lines.Similar articles
-
Surface morphology and kinetic properties in rapid growth of EAFP protein crystals investigated by atomic force microscopy.Acta Crystallogr D Biol Crystallogr. 2005 Jun;61(Pt 6):826-31. doi: 10.1107/S0907444905013703. Epub 2005 May 26. Acta Crystallogr D Biol Crystallogr. 2005. PMID: 15930648
-
Controllable Growth and Formation Mechanisms of Dislocated WS2 Spirals.Nano Lett. 2018 Jun 13;18(6):3885-3892. doi: 10.1021/acs.nanolett.8b01210. Epub 2018 May 18. Nano Lett. 2018. PMID: 29763565
-
An in situ atomic force microscopy study of uric acid crystal growth.J Phys Chem B. 2005 May 26;109(20):9989-95. doi: 10.1021/jp0455733. J Phys Chem B. 2005. PMID: 16852207
-
Nucleation of solid solutions crystallizing from aqueous solutions.Philos Trans A Math Phys Eng Sci. 2003 Mar 15;361(1804):615-31; discussion 632. doi: 10.1098/rsta.2002.1142. Philos Trans A Math Phys Eng Sci. 2003. PMID: 12662457 Review.
-
Flotation surface chemistry of water-soluble salt minerals: from experimental results to new perspectives.Adv Colloid Interface Sci. 2022 Nov;309:102775. doi: 10.1016/j.cis.2022.102775. Epub 2022 Sep 16. Adv Colloid Interface Sci. 2022. PMID: 36152375 Review.
Cited by
-
Bioleaching of lithium from jadarite, spodumene, and lepidolite using Acidiothiobacillus ferrooxidans.Front Microbiol. 2024 Nov 13;15:1467408. doi: 10.3389/fmicb.2024.1467408. eCollection 2024. Front Microbiol. 2024. PMID: 39651346 Free PMC article.
References
-
- Elbeyli İ. Y. Production of Crystalline Boric Acid and Sodium Citrate from Borax Decahydrate. Hydrometallurgy 2015, 158, 19–26. 10.1016/j.hydromet.2015.09.022. - DOI
-
- Pavlovic-Zuvic P.; Parada-Frederick N.; Vergara-Edwards L.. Recovery of Potassium Chloride, Potassium Sulfate and Boric Acid from the Salar de Atacama Brines. In: Proceedings of the 66th International Symposium on Salts; May 1983; Toronto, Canada. Naples: Salt Institute, 1983; Vol. II; pp 381–387.
-
- Pavlovic-Zuvic P. La Industria Del Litio En Chile. Rev. Ing 2014, 209, 24–29.
-
- U.S. Geological Survey . Mineral Commodity Summaries 2021; U.S. Geological Survey, 2021, pp 36-37, 10.3133/mcs2021. - DOI
-
- Chong G.; Pueyo J. J.; Demergasso C. Los Yacimientos de Boratos de Chile. Rev. Geol. Chile 2000, 27, 99–119. 10.4067/s0716-02082000000100007. - DOI
LinkOut - more resources
Full Text Sources

