. 2023 Mar 16:14:1134478.
doi: 10.3389/fendo.2023.1134478. eCollection 2023.

EpiCRISPR targeted methylation of Arx gene initiates transient switch of mouse pancreatic alpha to insulin-producing cells

Affiliations

EpiCRISPR targeted methylation of Arx gene initiates transient switch of mouse pancreatic alpha to insulin-producing cells

Marija Đorđević et al. Front Endocrinol (Lausanne). .

Abstract

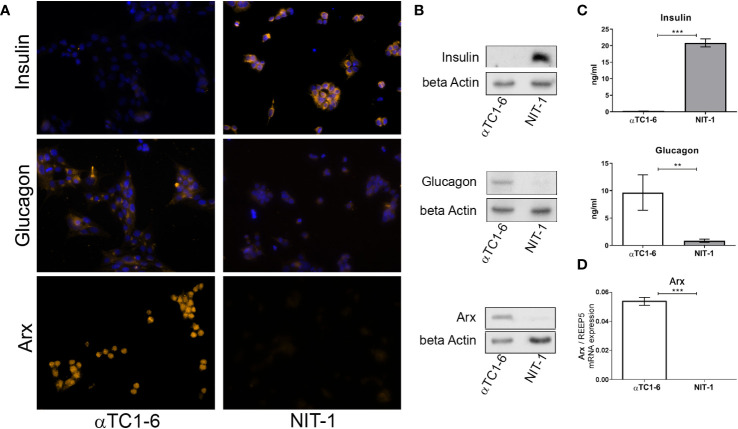
Introduction: Beta cell dysfunction by loss of beta cell identity, dedifferentiation, and the presence of polyhormonal cells are main characteristics of diabetes. The straightforward strategy for curing diabetes implies reestablishment of pancreatic beta cell function by beta cell replacement therapy. Aristaless-related homeobox (Arx) gene encodes protein which plays an important role in the development of pancreatic alpha cells and is a main target for changing alpha cell identity.

Results: In this study we used CRISPR/dCas9-based epigenetic tools for targeted hypermethylation of Arx gene promoter and its subsequent suppression in mouse pancreatic αTC1-6 cell line. Bisulfite sequencing and methylation profiling revealed that the dCas9-Dnmt3a3L-KRAB single chain fusion constructs (EpiCRISPR) was the most efficient. Epigenetic silencing of Arx expression was accompanied by an increase in transcription of the insulin gene (Ins2) mRNA on 5th and 7th post-transfection day, quantified by both RT-qPCR and RNA-seq. Insulin production and secretion was determined by immunocytochemistry and ELISA assay, respectively. Eventually, we were able to induce switch of approximately 1% of transiently transfected cells which were able to produce 35% more insulin than Mock transfected alpha cells.

Conclusion: In conclusion, we successfully triggered a direct, transient switch of pancreatic alpha to insulin-producing cells opening a future research on promising therapeutic avenue for diabetes management.

Keywords: Arx gene; CRISPR/dCas9; diabetes; epigenetic editing; pancreatic alpha cells; targeted DNA methylation.


Conflict of interest statement

The authors declare that the research was conducted in the absence of any commercial or financial relationships that could be construed as a potential conflict of interest.

Figures

Figure 1
Figure 1
Mouse pancreatic alpha and beta cell transcriptome analysis - characterization of a model system. (A) Principal Component Analysis (PCA) of RNA-seq data of an alpha-cell line (αTC1-6, N=2, blue) and a beta-cell line (NIT-1, N=2, orange) describing >99% of the transcriptional variability at the first principal component (N represents the number of biological replicas). (B) Log ratio vs. mean average (MA) plot of RNA-seq data displays gene-wise log2 fold change of alpha (N=2) vs. beta-cells (N=2) normalized-averaged counts against mean expression values. Significantly higher (N=654) and lower (N=1061) expressed genes in αTC1-6 vs. NIT-1 cells are highlighted in red and blue, respectively, and display a mean log2 CPM > 0 and a log2 fold change > 0.5 (FDR < 0.05). (C) Heatmaps and dendrogram showing the 1715 significantly differentially expressed genes between an alpha-cell line (αTC1-6, N=2) and a beta-cell line (NIT-1, N=2) (see B). Heatmap displays gene expression z-score in a color scale between blue and red and samples and genes are clustered by Euclidean distance. (D) Expression of selected genes with statistically significant different expression in αTC1-6 vs NIT-1 cells as key factors for maintaining cell identity. p-value: ***p ≤ 0.001.
Figure 2
Figure 2
Insulin and glucagon as the main functional cell-type-specific products. (A) Immunofluorescence analysis of αTC1-6 and NIT-1 cells with anti-insulin, anti-glucagon, and anti-Arx antibody (light orange fluorescence). Nuclei were stained with DAPI (blue fluorescence). DAPI was not added to cells labeled with anti-Arx antibody. (B) Protein expression of insulin, glucagon, and Arx in lysates isolated from αTC1-6 and NIT-1 cells were determined with immunoblot analysis using anti-insulin, anti-glucagon, anti-Arx, and anti-β-actin (loading control) antibodies. (C) The amount of secreted insulin and glucagon in cell culture media was measured by enzyme-linked immunosorbent assay (ELISA). (D) The relative expression level of Arx mRNA isolated from αTC1-6 and NIT-1 cells was determined by RT-qPCR analysis. The REEP5 mRNA level expression was used as an endogenous control. Data are displayed as mean ± SDs. The error bars denote SD from three biological replicates performed in technical duplicates. Significance among cell type samples was determined using an unpaired Students t-test, **p ≤ 0.01, ***p ≤ 0.001.
Figure 3
Figure 3
Presence of different epigenetic signatures in the Arx promoter of αTC1-6 and NIT-1 cell lines. (A) Schematic representation of the Arx genomic region on chr. X with the positions of primers used for DNA methylation analysis shown as purple lines, analyzed parts of the gene shown as dark red boxes, the part of Arx mRNA shown as the green box and the position of CpG island shown as the yellow box in the insert. Red vertical lines represent CpG sites in the Arx gene. The figure was created with the SnapGene. (B) The representative aligned melting curves and (C) the difference plots obtained by HRM analysis show positions of NIT-1 curves considering αTC1-6 cells as a 0% standard and commercially methylated mouse DNA standards assumed to be 100% methylated. (D) The column chart represents the relative level of DNA methylation in NIT-1 cells in two analyzed regions of the Arx gene compared to αTC1-6 cells methylation level (N=3). The results are expressed as means ± SDs. For determining statistical significance the one sample t-test was used, ***p ≤ 0.001. (E) ChIP-qPCR analysis of RNA pol II, H3K4me3, and H3K9me3 histone modification occupancy at the Arx promoter region (ChIP amplicon) in αTC1-6 and NIT-1 cell lines. ChIP was performed with antibodies against RNA pol II, H3K4me3 and H3K9me3 (N=3). The immunoprecipitated chromatin fragments were analyzed by quantitative PCR using primers for the Arx promoter sequence in αTC1-6 and NIT-1 cell lines. The positions of primers used for chromatin ChIP analysis for the Arx are represented as purple lines. The results are expressed as means ± SDs. The Kolmogorov-Smirnov test (with D-W-L P value) was used for determining the normality of the ChIP sample. The one sample t-test was used for determining statistical significance values with normal distribution. For data with non-normal distribution, the Wilcoxon Signed Paired test was applied, **p ≤ 0.01, ***p ≤ 0.001.
Figure 4
Figure 4
Targeted methylation of the Arx promoter in αTC1-6 cells induced by epigenetic editing tool. (A) The map shows the position of the four sgRNAs represented as red arrows which were used for transfection and targeting EpiCRISPR fusion construct. The Arx transcribed region is shown as a green box and the intron as a dashed line. (B) Schematic representation of used fusion constructs for targeted gene repression. The catalytically inactive dCas9 gene was fused to three different domains with a 28 amino acid linker containing NLS peptide. Not drawn to scale. (C) The map shows the part of the X chromosome with the Arx gene indicated as a grey box and with the position of analyzed parts (blue boxes) by bisulfite sequencing in the Arx gene. Red lines represent CpG sites in the Arx gene. (D) The targeted DNA bisulfite sequencing analysis represented by the heat map shows the methylation average per CpG site in the Arx promoter sequence. Rows in the heatmap denote separate αTC1-6 co-transfection experiments with one of three different fusion constructs for targeted gene repression in combination with four sgRNAs, while columns represent separate CpG sites in the analyzed region (red-methylated, blue-unmethylated CpG). (E) The fluorescence-activated cell sorting (FACS) results of transiently transfected αTC1-6 cells before and after cell sorting shows an enrichment of the proportion of fluorescent cells. (F) Representative fluorescent microscopy images showed the GFP expression level (green fluorescence) which corresponds to the high transfection efficiency of αTC1-6 cells on the 5th post-transfection day. Nuclei were stained with DAPI (blue fluorescence). (G) The relative Cas9 mRNA expression level in GFP+ sorted transfected cell population at 5th, 7th, 10th, 12th, and 15th days after transfection (N=3). GFP – green fluorescent protein; Mock transfected cells – cells transfected with a combination of pmaxGFP™ Vector, a plasmid for epigenome editing (dCas9-3a3L-KRAB), and empty gRNA vector; EpiC transfected cells - cells transfected with a combination of pmaxGFPVector, the plasmid for targeted gene repression and four sgRNAs for targeting Arx gene promoter (Arx sgRNA 1-4 vectors). (H) The relative mRNA expression level of Arx and Ins2 on the 5th post-transfection day was determined by RT-qPCR analysis (N=2). The REEP5 mRNA level expression was used as an endogenous control. The results are expressed as means ± SDs. The Kolmogorov-Smirnov test (with D-W-L P value) was used for determining the normality of the samples. The one sample t-test was used for determining statistical significance values with normal distribution. For data with non-normal distribution, the Wilcoxon Signed Rank test was applied, **p ≤ 0.01, ***p ≤ 0.001.
Figure 5
Figure 5
The induced targeted DNA methylation of the Arx promotor triggers Ins2 expression in αTC1-6 cells. (A) Schematic representation of a part of the Arx gene with the position of primers used for DNA methylation analysis (R1 and R2 amplicons); the CpG island; and four sgRNAs shown in the inset. Mock-transfected cells with 5% pmaxGFP, 20% dCas9-Dnmt3a3L-KRAB, 75% empty gRNA; EpiC-transfected cells with 5% pmaxGFP, 20% dCas9-Dnmt3a3L-KRAB, 75% all four sgRNAs. (B) Representative difference plots obtained from HRM analysis in two different regions of the Arx gene for the 5th and 7th day after transfection shows positions of NIT-1 and EpiC curves in three biological replicates using Mock transfected cells taken as a 0% standard and 100% methylated mouse standard. (C) The time scale of changes in DNA methylation level of R1 and R2 analyzed region in EpiC transfected cells relative to Mock transfected cells at 5, 7, 12, and 15th days after transfection. (D) The bar chart represents relative Arx and Ins2 mRNA expression levels at the 5th and 7th days post-transfection related to Mock transfected cells. Changes over time in Arx and Ins2 mRNA expression levels at 5, 7, 12, and 15th days after transfection are shown in the line graph (N=4). (E) Immunofluorescence analysis of Mock and EpiC transfected cells with anti-insulin antibody (light orange fluorescence) at several days after transfection. Nuclei were stained with DAPI (blue fluorescence). The statistical significance was determined using one sample t-test relative to Mock transfected cells for normally distributed values. The Wilcoxon Signed Rank test was applied for data with non-normal distribution. The error bars denote SD, **p ≤ 0.01, ***p<0.001.
Figure 6
Figure 6
Transcriptomic analysis of Mock and EpiC αTC1-6 cell at 5th post-transfection day. (A) PCA of RNA-seq data of αTC1-6 (N=2, orange), NIT-1 (N=2, blue), Mock (N=2, dark blue), and EpiC transfected cells (N=2, yellow), describing >95% of the transcriptional variability at the first principal component. (B) Heatmaps and dendrogram showing significantly differentially expressed genes between αTC1-6, NIT-1, Mock and EpiC transfected cells. Heatmap displays gene expression z-score in a color scale between blue and red and samples and genes are clustered by Euclidean distance. (C) MA plot of RNA-seq results displays differentially expressed genes of EpiC (N = 2) vs. Mock transfected cells (N = 2). Significantly up- (N = 357) and down-regulated (N = 266) genes are highlighted in red and blue, respectively, and display a log2 fold change > 0.5, p-value < 0.05 and mean log2 CPM > 0. (D) Box plot displays expression differences for Arx, Ins2, and Gcg mRNA expression levels using RNA-seq data. For Arx a one-sited and for the other genes two-sided tests were used. ns, not statistically significant.
Figure 7
Figure 7
The list of biological processes associated with genes differentially expressed in EpiC vs. Mock transfected cells on the 5th post-transfection day. (A) Up- and down-regulated gene in EpiC transfected cells versus Mock displaying log2 fold change and p-value: *p ≤ 0.05, **p ≤ 0.01, ***p ≤ 0.001, ****p ≤ 0.0001. (B) KEGG pathway analysis. (C) Gene expression changes (log2 fold change) of all expressed genes involved in Type II diabetes mellitus and Insulin secretion pathways. Significantly differentially expressed genes are highlighted in red (see Figure 6C ). (D) Box plot displays expression differences for Pax6, Pou3f4, Neurod-1, Nkx2-2, Nkx6-1 and Isl1 using RNA-seq data. Two-sided tests were used.
Figure 8
Figure 8
Expression changes in hormone secretion and beta cell-related genes in EpiC transfected αTC1-6 cells. (A) Immunofluorescence analysis of Mock and EpiC transfected cells with anti-glucagon antibody (light orange fluorescence) on the 5th and 7th day after transfection. Nuclei were stained with DAPI (blue fluorescence). (B) Glucagon secretion in cell culture media was measured by ELISA on the 5th and 7th day after transfection (N=4). (C) Relative mRNA expression level of Pax4, MafA and Slc2a2 on the 5th and 7th day as well as Pdx1, Pax6, Nkx2-2, Nkx6-1 on the 5th day after transfection related to Mock transfected cells (N=4). The REEP5 mRNA level expression was used as an endogenous control. (D) Glucose-stimulated insulin secretion measured by ELISA assay. The concentration of secreted insulin in cell culture media in αTC1-6 mixed with NIT-1 cell lines in different percentages (0-10%) was determined after adding 30 mM glucose in the KRB buffer. (E) Insulin secretion in αTC1-6 cell culture media was measured by ELISA assay on the 5th and 7th day after transfection (N=3). The one sample t-test was used for determining statistical significance, *p ≤ 0.05, **p ≤ 0.01, ***p ≤ 0.001.

References

    1. Demcollari TI, Cujba A-M, Sancho R. Phenotypic plasticity in the pancreas: New triggers, new players. Curr Opin Cell Biol (2017) 49:38–46. doi: 10.1016/j.ceb.2017.11.014 - DOI - PMC - PubMed
    1. Cavelti-Weder C, Li W, Zumsteg A, Stemann-Andersen M, Zhang Y, Yamada T, et al. Hyperglycaemia attenuates in vivo reprogramming of pancreatic exocrine cells to beta cells in mice. Diabetologia (2016) 59(3):522–32. doi: 10.1007/s00125-015-3838-7 - DOI - PMC - PubMed
    1. Lakey JRT, Burridge PW, Shapiro AMJ. Technical aspects of islet preparation and transplantation. Transpl Int (2003) 16(9):613–32. doi: 10.1111/j.1432-2277.2003.tb00361.x - DOI - PubMed
    1. Burke GW, 3rd, Vendrame F, Virdi SK, Ciancio G, Chen L, Ruiz P, et al. Lessons from pancreas transplantation in type 1 diabetes: Recurrence of islet autoimmunity. Curr Diabetes Rep (2015) 15(12):121. doi: 10.1007/s11892-015-0691-5 - DOI - PubMed
    1. Gross M. Regenerative medicine spoilt for choice. Curr Biol (2011) 21(7):R235–R7. doi: 10.1016/j.cub.2011.03.062 - DOI - PubMed

Publication types