. 2023 Mar 16:14:1115890.
doi: 10.3389/fendo.2023.1115890. eCollection 2023.

Integrative network-based analysis on multiple Gene Expression Omnibus datasets identifies novel immune molecular markers implicated in non-alcoholic steatohepatitis

Affiliations

Integrative network-based analysis on multiple Gene Expression Omnibus datasets identifies novel immune molecular markers implicated in non-alcoholic steatohepatitis

Jun-Jie Zhang et al. Front Endocrinol (Lausanne). .

Abstract

Introduction: Non-alcoholic steatohepatitis (NASH), an advanced subtype of non-alcoholic fatty liver disease (NAFLD), has becoming the most important aetiology for end-stage liver disease, such as cirrhosis and hepatocellular carcinoma. This study were designed to explore novel genes associated with NASH.

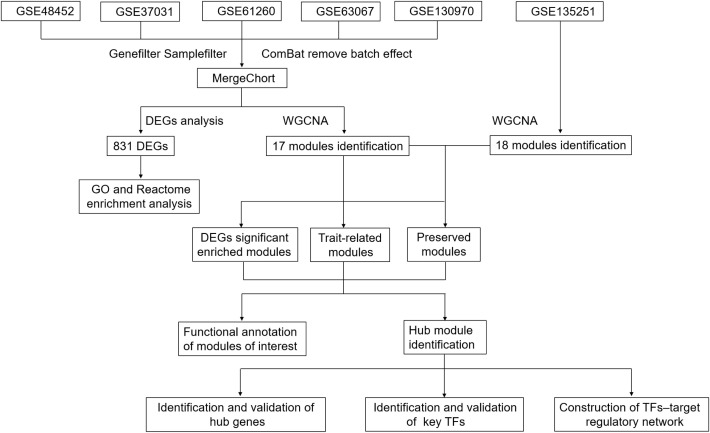
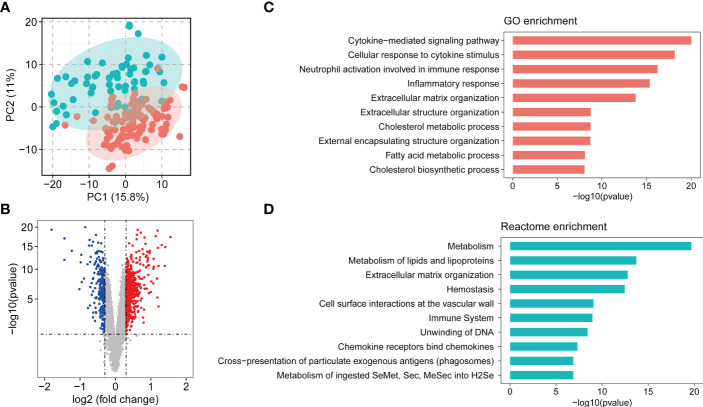
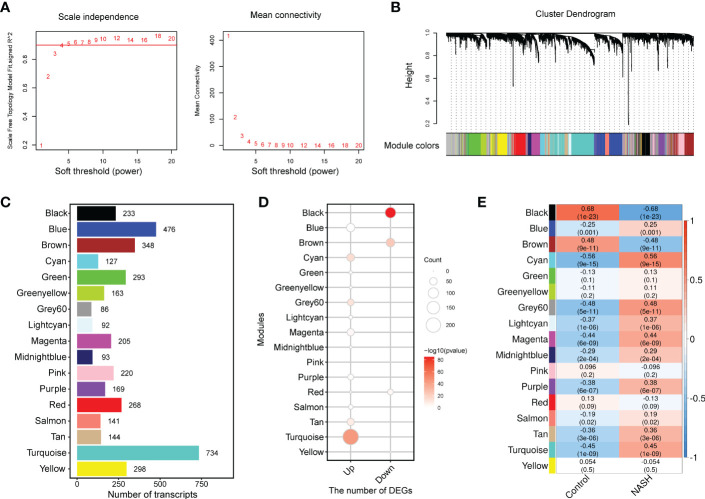
Methods: Here, five independent Gene Expression Omnibus (GEO) datasets were combined into a single cohort and analyzed using network biology approaches.

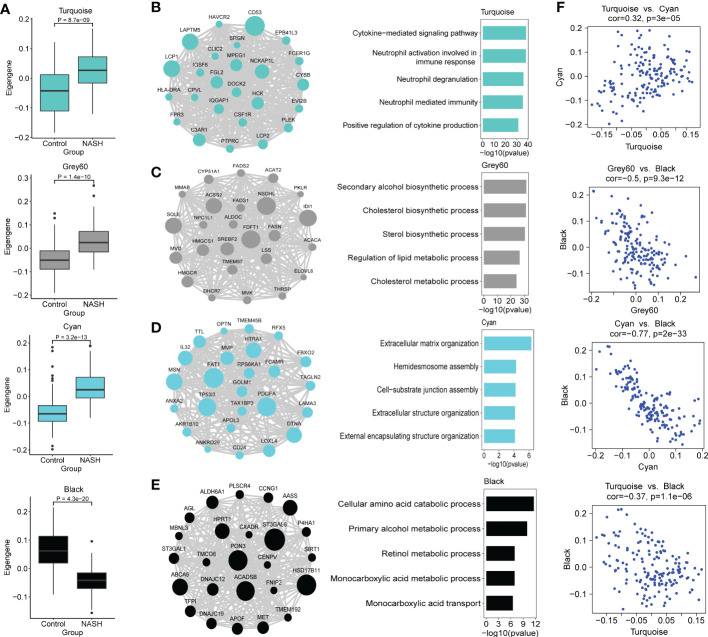
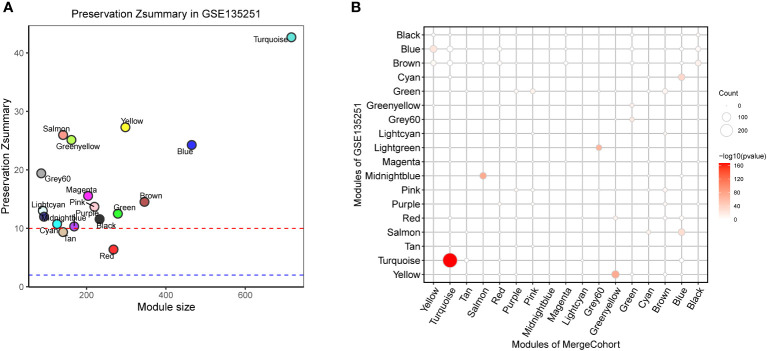
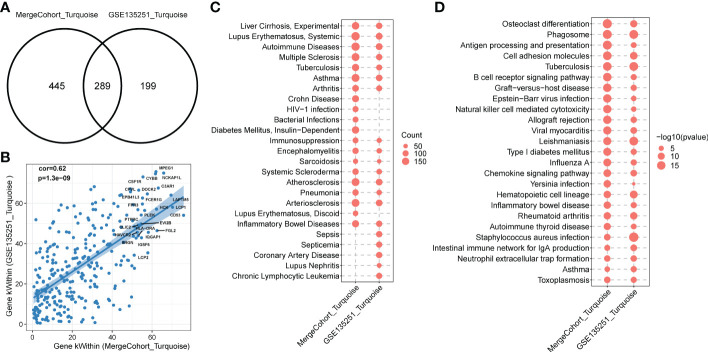
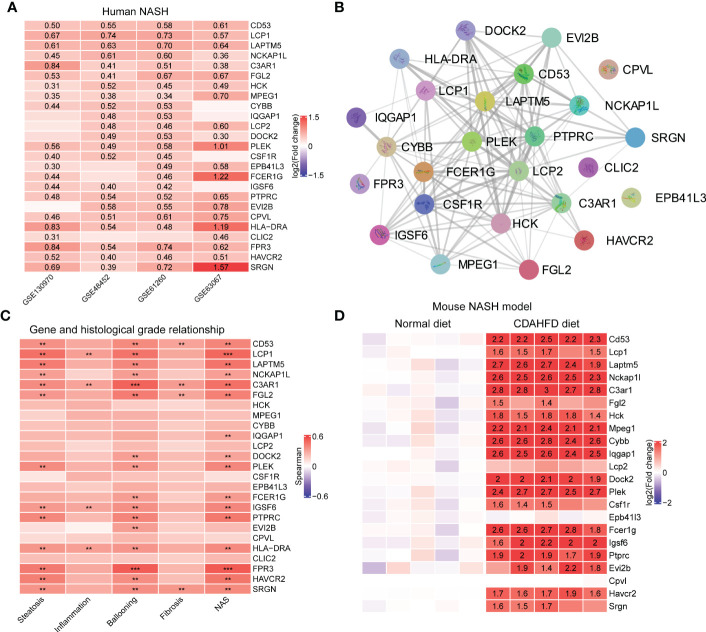
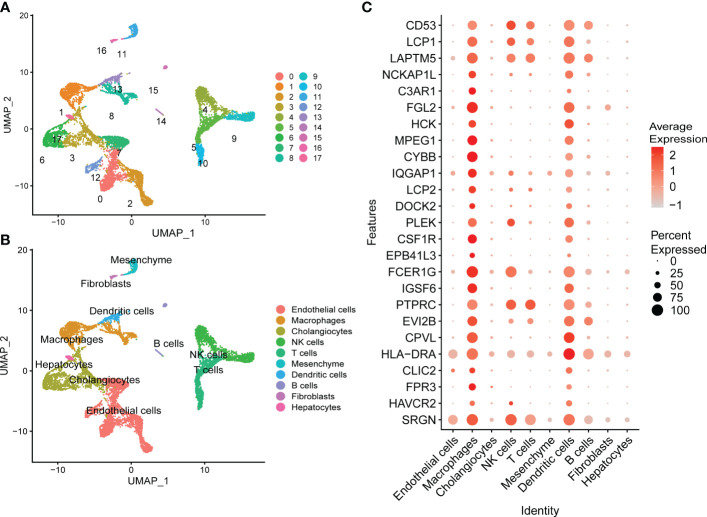
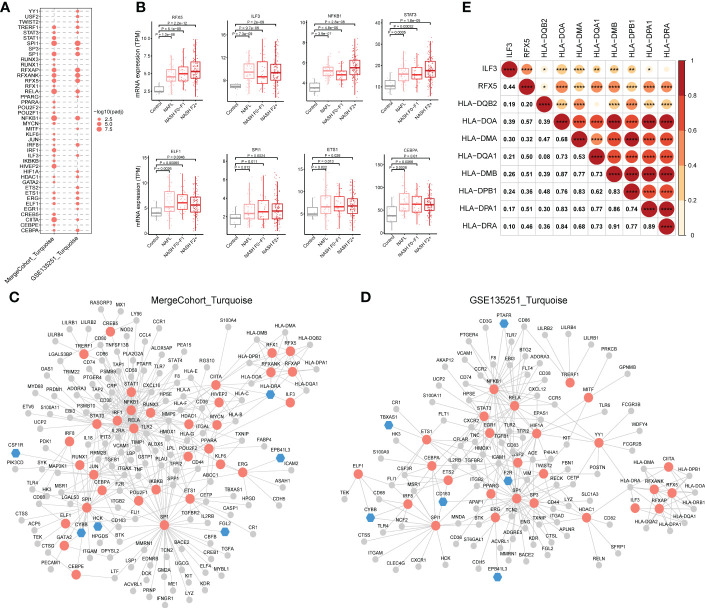
Results: 11 modules identified by weighted gene co-expression network analysis (WGCNA) showed significant association with the status of NASH. Further characterization of four gene modules of interest demonstrated that molecular pathology of NASH involves the upregulation of hub genes related to immune response, cholesterol and lipid metabolic process, extracellular matrix organization, and the downregulation of hub genes related to cellular amino acid catabolic, respectively. After DEGs enrichment analysis and module preservation analysis, the Turquoise module associated with immune response displayed a remarkably correlation with NASH status. Hub genes with high degree of connectivity in the module, including CD53, LCP1, LAPTM5, NCKAP1L, C3AR1, PLEK, FCER1G, HLA-DRA and SRGN were further verified in clinical samples and mouse model of NASH. Moreover, single-cell RNA-seq analysis showed that those key genes were expressed by distinct immune cells such as microphages, natural killer, dendritic, T and B cells. Finally, the potential transcription factors of Turquoise module were characterized, including NFKB1, STAT3, RFX5, ILF3, ELF1, SPI1, ETS1 and CEBPA, the expression of which increased with NASH progression.

Discussion: In conclusion, our integrative analysis will contribute to the understanding of NASH and may enable the development of potential biomarkers for NASH therapy.

Keywords: hub genes; immune response; non-alcoholic steatohepatitis; transcription factors; weighted gene co-expression network analysis.


Conflict of interest statement

The authors declare that the research was conducted in the absence of any commercial or financial relationships that could be construed as a potential conflict of interest.

Figures

Figure 1
Figure 1
Flowchart.
Figure 2
Figure 2
Overview of combining gene expression profiles in healthy controls and nonalcoholic steatohepatitis (NASH) patients. (A) Principle component plot of samples based on top 500 most variable gene expression from combining gene expression profiles (MergeCohort). NASH patients are marked in red; healthy controls are marked in green. (B) Volcano plot of differentially expressed genes (DEGs) between NASH patients and healthy controls. DEGs are listed in Supplemental Table S4 . 600 genes upregulated and 200 genes downregulated are shown in red and blue, respectively. (C) Top 10 enriched biological functions of DEGs determined by Gene Ontology (GO) enrichment analysis. (D) Top 10 enriched Reactome pathways of DEGs determined by Reactome pathway enrichment analysis.
Figure 3
Figure 3
WGCNA network and module identification. (A) Soft-thresholding calculation of MergeCohort. The left panel displays the scale-free fit index versus soft-thresholding power. The right panel shows the mean connectivity versus soft-thresholding power. Power 5 was selected, for which the fit index curve flattens out upon reaching a high value (> 0.9). (B) The Cluster dendrogram of co-expression network modules from WGCNA depending on a dissimilarity measure (1-TOM). The leaves in the tree represent genes and the colors in the horizontal bar indicate co-expression module determined by the dynamic tree cut algorithm. (C) Number of genes in each module. (D) Enrichment of upregulated and downregulated DEGs in each module. (E) Heatmap showing the association between module eigengenes (rows) and NASH disease status (column). Associated p values were computed using the cor.test R function. The color scale in the heat map represents the magnitude of the Pearson correlation coefficients. Number in each cell contained corresponding correlation coefficient and p value (in brackets). WGCNA, weighted gene correlation network analysis; TOM, topological overlap matrix.
Figure 4
Figure 4
Functional characterization of co-expression modules of interest identified by WGCNA. (A) Box and Whisker plots representing the expression of module eigengenes Turquoise, Grey60, Cyan, Black between NASH (n = 97) and healthy control (n = 67) samples. Data are presented as median with first and third quartiles as the box edges. Differences between group were estimated by Student’s t test. (B–E) The network of hub genes (module genes within the top 25 genes with the highest intromodular connectivity values (kWithin)) (left panel) and top GO terms (right panel) of the modules Turquoise (B), Grey60 (C), Cyan (D) and Black (E) are shown. In the network diagrams, node sizes correspond to kWithin in the module. For the bars plot, the bars in the GO enrichment results represent the -log10(pvalue). (F) Scatterplots of module eigengenes show positive correlation between Turquoise and Cyan, and negative correlation between Grey60, Cyan, Turquoise and Black, respectively.
Figure 5
Figure 5
Module preservation of MergeCohort in GSE135251 dataset. (A) Preservation Zsummary statistics of MergeCohort in GSE135251 dataset. Each point represents a module. Point color reflects the module color as used in Figures 3B–E of MergeCohort. Points are also labeled by the name of the module. The dashed blue and red lines indicate the rough thresholds for week (Z = 2) and strong (Z = 10) evidence of module preservation. (B) Overlaps of MergeCohort and GSE135251 modules. Each axis is labelled by the corresponding module name. The size of each dot represents the number of overlapping genes in the intersection of corresponding MergeCohort and GSE135251 modules while the color implies -log10 of the hypergeometric enrichment p value.
Figure 6
Figure 6
Functional enrichment of MergeCohort_Turquoise and GSE135251_Turquoise module. (A) Venn diagram displays number of genes overlapped between MergeCohort_Turquoise and GSE135251_Turquoise module. (B) Spearman’s correlation between the kWithin of common genes (n = 289) overlapped between each module. Top 25 hub genes with the highest kWithin from MergeCohort_Turquoise module are shown. (C) Dot-plot heatmap shows top 20 significantly enriched disease by genes in each module. The size of each dot represent the gene counts enriched in each disease term. (D) Dot-plot heatmap shows top 20 significantly enriched KEGG pathways by genes in each module. The size of each dot represents the -log10 of p value for each KEGG pathway term.
Figure 7
Figure 7
Validation of hub genes in MergeCohort_Turquoise module. (A) Heatmap shows the expression patterns of top 25 hub genes in human liver tissues according to four datasets (GSE130970, GSE48452, GSE61260 and GSE63067). The numbers in heatmap represent log2 value of fold change between NASH patients and healthy controls. (B) The protein-protein interactions among top 25 hub genes were retrieved by the STRING database. (C) Heatmap shows the Person correlation coefficients of top 25 hub genes and clinical parameters of NAFLD according to GSE130970 dataset. p values are overlaid on the heatmap (** p < 0.01 and *** p < 0.001). (D) Heatmap shows the expression patterns of top 25 hub genes in mouse liver tissue according to GSE120977 dataset. The numbers in heatmap represent log2 value of fold change between the CDAHFD and chow diet control group. CDAHFD, choline deficient L-amino acid defined high fat diet.
Figure 8
Figure 8
Assessment of the expression patterns of hub genes in MergeCohort_Turquoise module in different types of cells using publicly available healthy and cirrhotic scRNA-seq from dataset GSE136103. (A) UMAP visualization of different cell clusters from healthy (n = 2) and cirrhotic (n = 2) human livers. (B) UMAP visualization of cell types from healthy (n = 2) and cirrhotic (n = 2) human livers. Cells were annotated as endothelial cells, macrophages, cholangiocytes, NK cells, T cells, mesenchyme, dendritic cells, B cells, fibroblasts, and hepatocytes based on the expression of lineage markers. (C) Dot plot shows the expression patterns of top 25 hub genes in different types of liver cells. Size of the dot indicates proportion of the cell population that expresses each gene. Color represents level of expression. UMAP, uniform manifold approximation and projection.
Figure 9
Figure 9
Regulatory relationship between enriched transcription factors and their target genes in NASH-associated module. (A) Dot-plot heatmap shows enriched transcription factors in MergeCohort_Turquoise and GSE135251_Turquoise module. The size of each dot represents the -log10 of adjusted p value for each transcription factor. (B) Boxplots shows mRNA hepatic expression of the enriched transcription factors including RFX5, ILF3, NFKB1, STAT3, ELF1, SPI1, ETS1 and CEBPA according to GSE135251 dataset. The p value was calculated by Student’s t test. (C, D) The regulatory networks between enriched transcription factors and associated target genes in MergeCohort_Turquoise (C) and GSE135251_Turquoise module (D), respectively. Red color represents transcription factors, blue color represents target hub genes, grey color represents other target genes. (E) Pearson correlations for mRNA hepatic expression of transcription factors (RFX5 and ILF3) and associated target genes (HLA-DQB2, HLA-DOA, HLA-DMA, HLA-DQA1, HLA-DMB, HLA-DPB1, HLA-DPA1 and HLA-DRA) in GSE135251 dataset. * p < 0.05, ** p < 0.01, *** p < 0.001 and **** p < 0.0001.

References

    1. Younossi ZM, Koenig AB, Abdelatif D, Fazel Y, Henry L, Wymer M. Global epidemiology of nonalcoholic fatty liver disease-Meta-Analytic assessment of prevalence, incidence, and outcomes. Hepatology (2016) 64:73–84. doi: 10.1002/hep.28431 - DOI - PubMed
    1. Brunt EM. Pathology of nonalcoholic fatty liver disease. Nat Rev Gastroenterol Hepatol (2010) 7:195–203. doi: 10.1038/nrgastro.2010.21 - DOI - PubMed
    1. Williams CD, Stengel J, Asike MI, Torres DM, Shaw J, Contreras M, et al. Prevalence of nonalcoholic fatty liver disease and nonalcoholic steatohepatitis among a largely middle-aged population utilizing ultrasound and liver biopsy: A prospective study. Gastroenterology (2011) 140:124–31. doi: 10.1053/j.gastro.2010.09.038 - DOI - PubMed
    1. Anstee QM, Reeves HL, Kotsiliti E, Govaere O, Heikenwalder M. From NASH to HCC: Current concepts and future challenges. Nat Rev Gastroenterol Hepatol (2019) 16:411–28. doi: 10.1038/s41575-019-0145-7 - DOI - PubMed
    1. Chalasani N, Younossi Z, Lavine JE, Charlton M, Cusi K, Rinella M, et al. The diagnosis and management of nonalcoholic fatty liver disease: Practice guidance from the American association for the study of liver diseases. Hepatology (2018) 67:328–57. doi: 10.1002/hep.29367 - DOI - PubMed

Publication types