. 2023 Mar 16;26(4):106416.
doi: 10.1016/j.isci.2023.106416. eCollection 2023 Apr 21.

Wnt/β-catenin signaling induces axial elasticity patterns of Hydra extracellular matrix

Affiliations

Wnt/β-catenin signaling induces axial elasticity patterns of Hydra extracellular matrix

Mariam Veschgini et al. iScience. .

Abstract

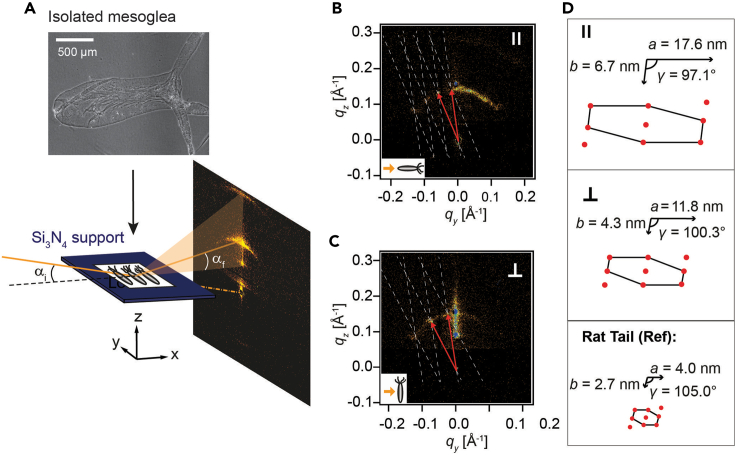
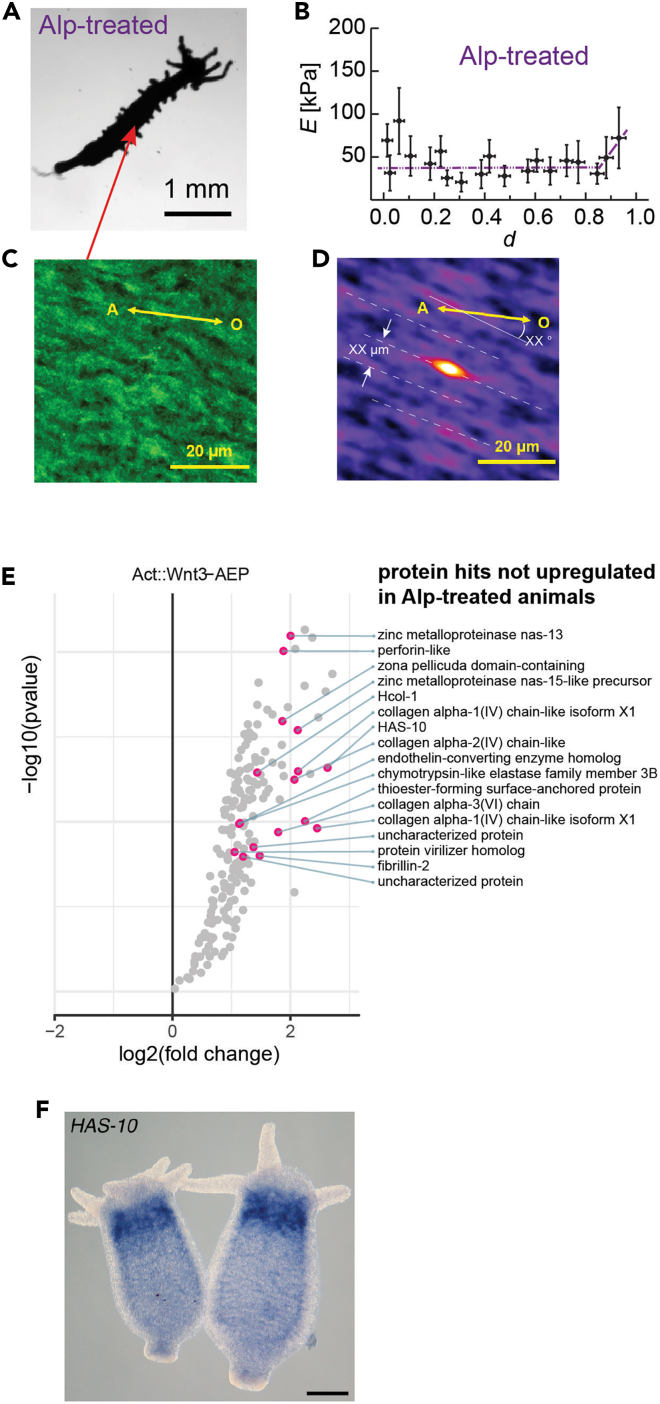
The extracellular matrix (ECM) plays crucial roles in animal development and diseases. Here, we report that Wnt/β-catenin signaling induces the ECM remodeling during Hydra axis formation. We determined the micro- and nanoscopic arrangement of fibrillar type I collagen along Hydra's body axis using high-resolution microscopy and X-ray scattering. Elasticity mapping of the ECM ex vivo revealed distinctive elasticity patterns along the body axis. A proteomic analysis of the ECM showed that these elasticity patterns correlate with a gradient-like distribution of metalloproteases along the body axis. Activation of the Wnt/β-catenin pathway in wild-type and transgenic animals alters these patterns toward low ECM elasticity patterns. This suggests a mechanism whereby high protease activity under control of Wnt/β-catenin signaling causes remodeling and softening of the ECM. This Wnt-dependent spatiotemporal coordination of biochemical and biomechanical cues in ECM formation was likely a central evolutionary innovation for animal tissue morphogenesis.

Keywords: Histology; Microscopic anatomy; Molecular biology; Zoology.


Conflict of interest statement

The authors declare that they have no competing interests.

Figures

None
Graphical abstract
Figure 1
Figure 1
Micrometer-scale orders of Hydra ECM (mesoglea) by autocorrelation analysis of high-resolution microscopy images (A and B) Confocal immunofluorescence image of a whole Hydra ECM stained with fibrillar type I collagen (Hcol-I) antibody in vivo (a) and ex vivo (b). (C, E, and G) Confocal images collected from 50 × 50 μm2 areas from the regions indicated by red arrows. (D, F, and H) Autocorrelation maps calculated from the confocal images. OA axis in each image is indicated by a yellow arrow. The characteristic features extracted from the analysis, such as unit cell length and angles, are indicated in each panel.
Figure 2
Figure 2
Nanometer-scale arrangement of HCol-I revealed by nano-GISAXS (A–C) Top left: phase-contrast microscopy image of an isolated mesoglea. Bottom: experimental setup of nano-GISAXS. Isolated mesoglea was placed on a Si3N4 window and illuminated by a nano-focused X-ray beam (diameter: 200 nm) at a grazing incidence angle αi = 0.46°. Scattering patterns obtained from mesoglea, whose body axis was positioned parallel (b) or perpendicular (c) to the beam (see inset yellow arrow). The reciprocal lattice is indicated in white, and the lattice vectors in red. (D) Lattice parameters in real space (a, b, γ) calculated from the directions parallel (top) and perpendicular (middle) to the major body axis. For comparison, the lattice parameters from the reference sample (collagen type I from rat tail tendon) are presented (bottom).
Figure 3
Figure 3
Elasticity mapping of Hydra mesoglea by AFM nano-indentation (A) A typical force (voltage)-distance curve (gray circles) of a mesoglea isolated from a freshly detached Hydra. Three contact point candidates (indicated by arrows) and the corresponding fits are presented for comparison. (B) The optimization of the fit by minimizing the mean sum of square residuals (SSR) during the marching of the contact point candidate. The optimal contact point (red) yields the bulk elastic modulus E = 29.7 kPa. (C) Phase-contrast microscopy image of a mesoglea isolated from a freshly detached Hydra. The relative position from the foot (d = 0) to mouth (d = 1.0) along the body axis is used for the normalization of spatial information. Scale bar: 500 μm. “Elasticity map” of Hydra mesoglea along the body axis. Data are presented as means and standard deviations out of 8 independent measurements.
Figure 4
Figure 4
Three representative elasticity phenotypes of Hydra mesoglea (n = 38) (A) Type A is characterized by a uniform, soft mesoglea. (B) Type B shows higher elastic moduli in peduncle and budding regions compared to the head region. (C) Type C looks similar to type B, but the elasticity in the peduncle region is distinctly lower. Data are presented as means and standard deviations. (D) Overlay of three representative elasticity patterns.
Figure 5
Figure 5
Effect of Wnt/β-catenin activation on elasticity pattern and protein-expression pattern (A) Light-microscopy image of a polyp continuously treated with GSK3β inhibitor, Alsterpaullone (Alp), at t = 3 days. (B) Elasticity pattern of mesoglea isolated from Alp-treated Hydra. Data are presented as means and standard deviations. The elastic moduli were low over the entire body column, which is clearly different from intact mesoglea (Figure 3). Immunofluorescence image. (C) and the corresponding autocorrelation map. (D) of Hydra Hcol-I after Alp treatment exhibiting a much weaker order compared to the control (Figure 1E). (E) Volcano plot of proteins upregulated in transgenic HyActP:Wnt3 polyps compared to wild-type AEP. The annotations show a significant enrichment of proteases and fibrillar mesoglea components including Hcol-I in the transgenic line that undergoes constant axis formation. The red dots denote enriched protein hits that are not upregulated in Alp-treated polyps compared to untreated controls. Table S1. The full list of proteins detected in the respective comparative analyses of the samples from wild-type AEP vs. HyActinP:HyWnt3 polyps and Alp-treated vs. DMSO-treated control polyps. (F) WISH experiment using an LNA probe shows upregulated collar-like expression of HAS-10 in gland cells of the upper gastric region of Hydra. Scale bar = 100 μm.
Figure 6
Figure 6
Spatiotemporal patterns of ECM elasticity and protease expression (A) Freshly detached Hydra (t = 0 days) possesses uniform, soft mesoglea (type A), associated with uniformly high protease expression level. (B) According to aging (t = 3 days), the downregulation in the budding region leads to the elevation of elastic moduli, resulting in type B/C patterns.

Similar articles

Cited by

References

    1. Bonnans C., Chou J., Werb Z. Remodelling the extracellular matrix in development and disease. Nat. Rev. Mol. Cell Biol. 2014;15:786–801. doi: 10.1038/nrm3904. - DOI - PMC - PubMed
    1. Chaudhuri O., Cooper-White J., Janmey P.A., Mooney D.J., Shenoy V.B. Effects of extracellular matrix viscoelasticity on cellular behaviour. Nature. 2020;584:535–546. doi: 10.1038/s41586-020-2612-2. - DOI - PMC - PubMed
    1. Dzamba B.J., DeSimone D.W. Extracellular matrix (ECM) and the sculpting of embryonic tissues. Curr. Top. Dev. Biol. 2018;130:245–274. doi: 10.1016/bs.ctdb.2018.03.006. - DOI - PubMed
    1. Kraus Y., Technau U. Gastrulation in the sea anemone Nematostella vectensis occurs by invagination and immigration: an ultrastructural study. Dev. Genes Evol. 2006;216:119–132. doi: 10.1007/s00427-005-0038-3. - DOI - PubMed
    1. Wallingford J.B., Fraser S.E., Harland R.M. Convergent extension: the molecular control of polarized cell movement during embryonic development. Dev. Cell. 2002;2:695–706. doi: 10.1016/S1534-5807(02)00197-1. - DOI - PubMed