. 2023 Mar 15:11:1077350.
doi: 10.3389/fcell.2023.1077350. eCollection 2023.

Salmonella enhances osteogenic differentiation in adipose-derived mesenchymal stem cells

Affiliations

Salmonella enhances osteogenic differentiation in adipose-derived mesenchymal stem cells

Nuradilla Mohamad-Fauzi et al. Front Cell Dev Biol. .

Abstract

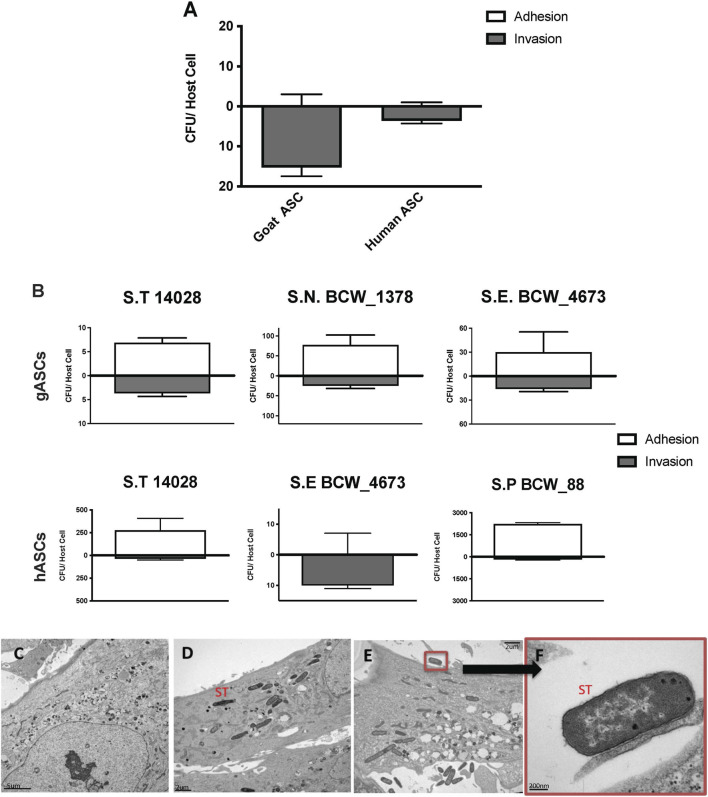
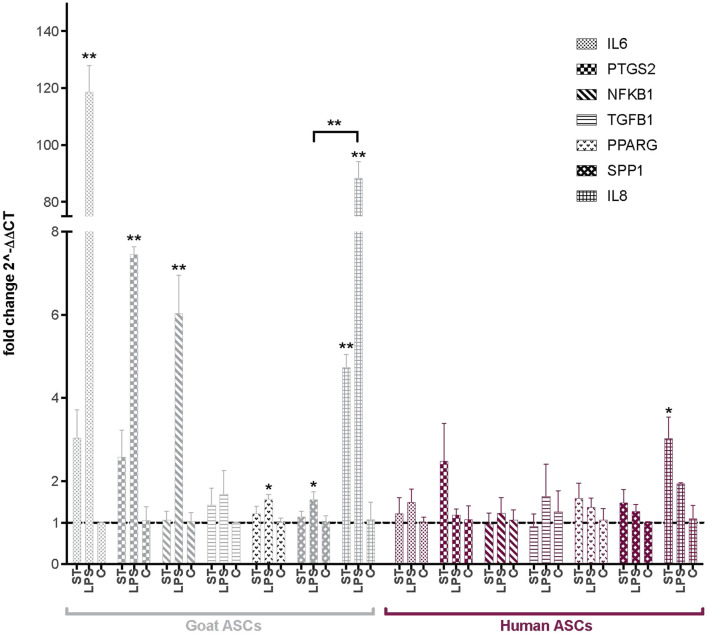
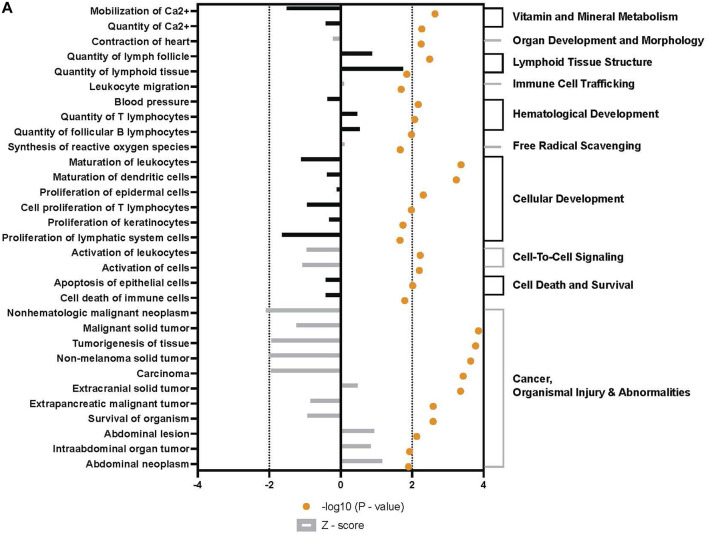
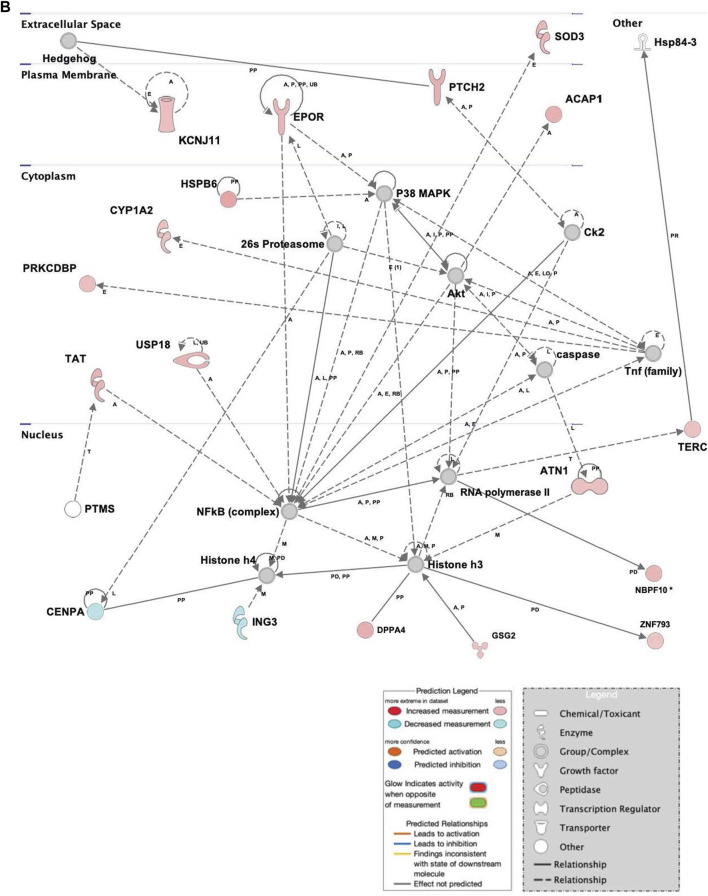
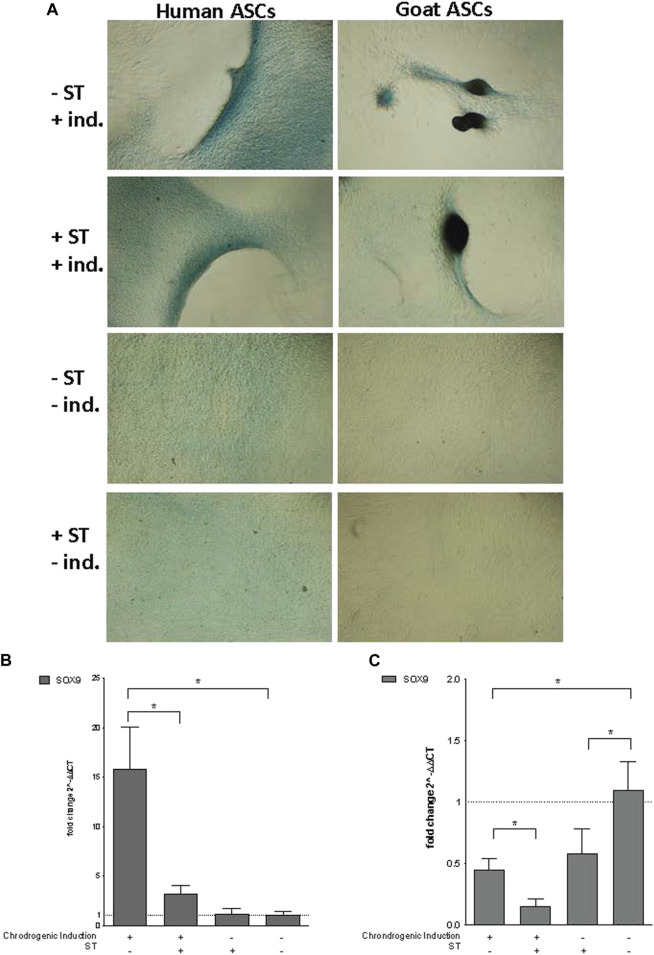
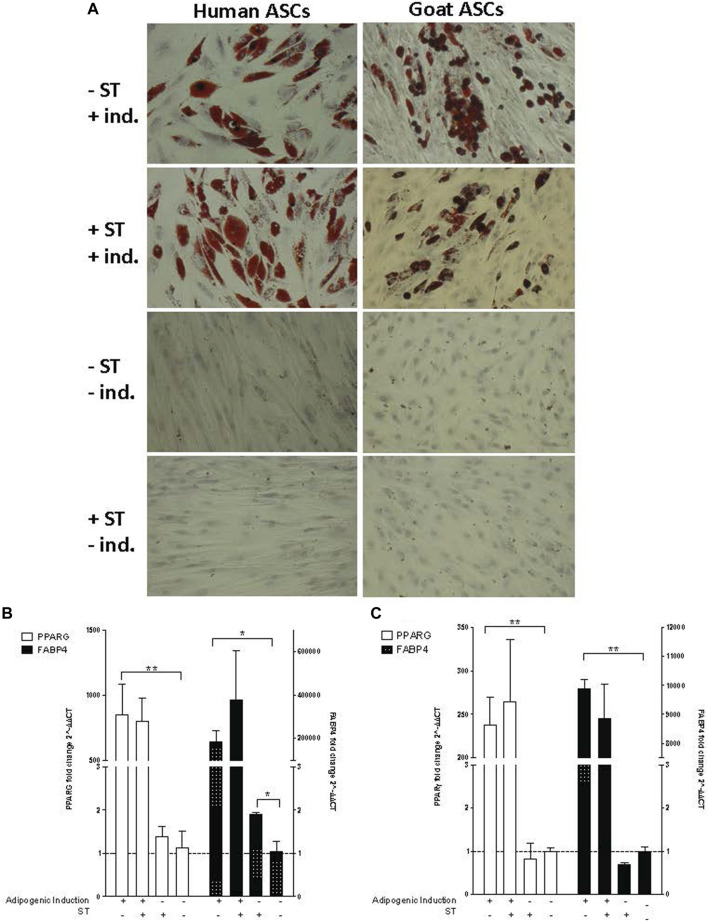
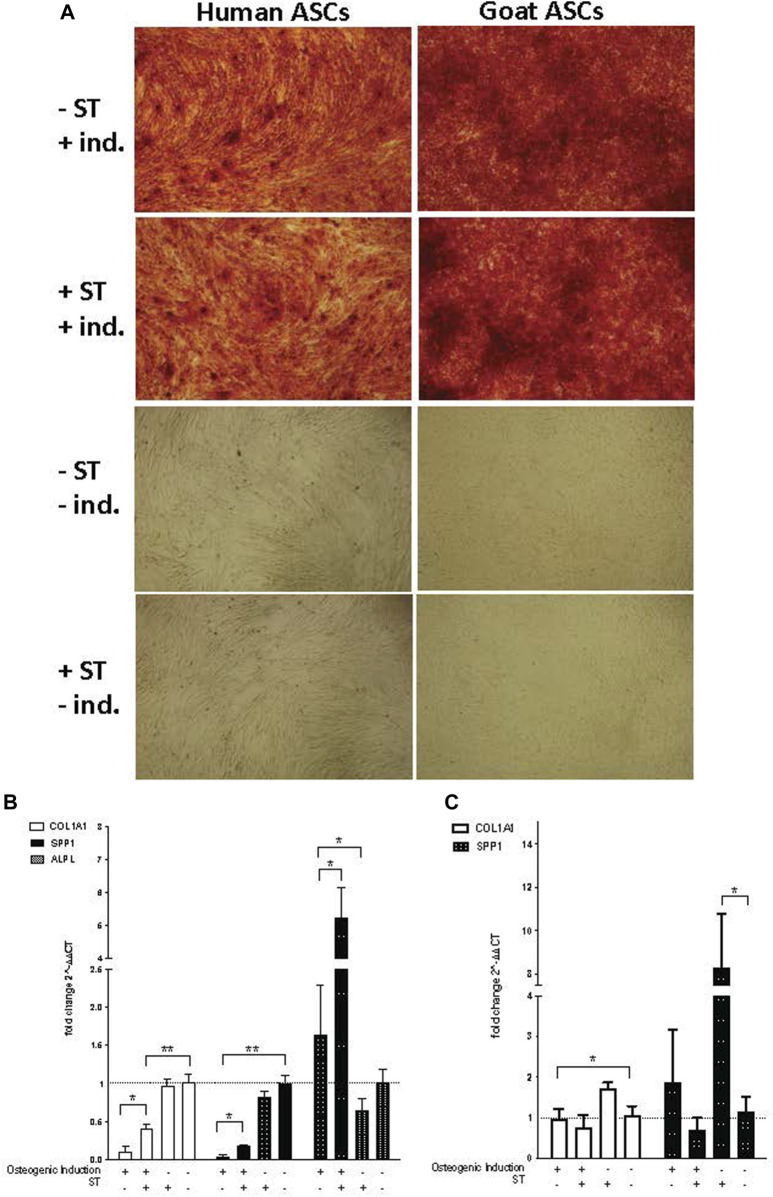
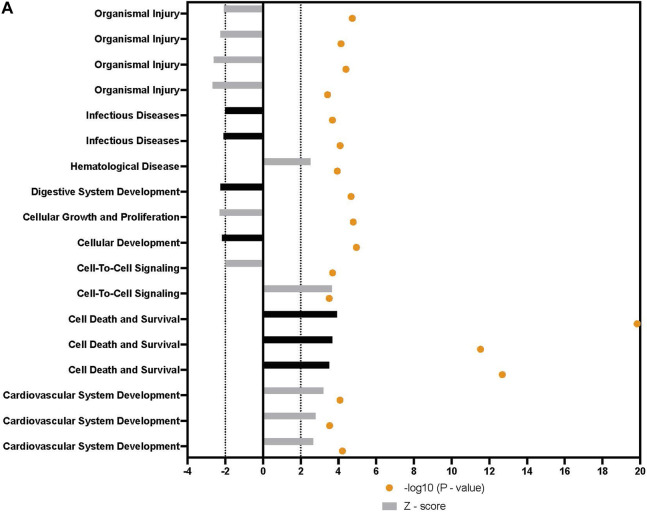
The potential of mesenchymal stem cells (MSCs) for tissue repair and regeneration has garnered great attention. While MSCs are likely to interact with microbes at sites of tissue damage and inflammation, like in the gastrointestinal system, the consequences of pathogenic association on MSC activities have yet to be elucidated. This study investigated the effects of pathogenic interaction on MSC trilineage differentiation paths and mechanisms using model intracellular pathogen Salmonella enterica ssp enterica serotype Typhimurium. The examination of key markers of differentiation, apoptosis, and immunomodulation demonstrated that Salmonella altered osteogenic and chondrogenic differentiation pathways in human and goat adipose-derived MSCs. Anti-apoptotic and pro-proliferative responses were also significantly upregulated (p < 0.05) in MSCs during Salmonella challenge. These results together indicate that Salmonella, and potentially other pathogenic bacteria, can induce pathways that influence both apoptotic response and functional differentiation trajectories in MSCs, highlighting that microbes have a potentially significant role as influencers of MSC physiology and immune activity.

Keywords: MSC; apoptosis; cell death; host/bacteria interactions; pathogenic and infectious disease.


Conflict of interest statement

The authors declare that the research was conducted in the absence of any commercial or financial relationships that could be construed as a potential conflict of interest.

Figures

FIGURE 1
FIGURE 1
Microbial Association with human and goat ASCs (A–F). ASCs presented a uniform pattern of Salmonella enterica ssp enterica serotype Typhimurium LT2 (ST) infection, the total associated bacteria were invaded, gASC show significantly higher invasion compared to human cells (A). ASCs susceptibility to invasion was not exclusive to ST, association patterns were microbe specific; 35%, 12% Salmonella enterica ssp enterica serotype Typhimurium 14,028, and 25%, 100% Salmonella enterica ssp enterica serotype Enteritidis (BCW_4673) were invaded in goat and human ASCs respectively (B). In gASCs, 35% Salmonella enterica ssp enterica serotype Newport (BCW_1378) and in hASCs, 7% of Salmonella enterica ssp enterica serotype Saint Paul (BCW_88) were invaded (B). Intracellular ST was observed by TEM 2 h post MSC co-incubation (D–F), consistent with control non-treated hASCs (C), ST infected cells showed no signs of cellular toxicity (D–F). ST adherence to hASC was observed at various sites (E–F).
FIGURE 2
FIGURE 2
Expression of immunomodulatory factors in ASCs post-microbial association. Quantitative PCR analysis of IL6, PTGS2, NFKB1, TGFB1, PPARG, SPP1, and IL8 expression in goat and human ASCs treated with ST or LPS. Data is presented as fold change (± SEM) in relative to expression levels in non-treated cells (“C”) (fold change ∼1, indicated by the dotted line). Statistical significance of p < 0.05 is denoted by an asterisk (*), and p < 0.01 denoted by two asterisks (**). Goat cell data is presented in gray and human cell data is presented in maroon.
FIGURE 3
FIGURE 3
Downstream trends analysis of differentially expressed genes in hASCs post microbial challenge. The IPA regulation z-score algorithm was used to identify biological functions expected to increase or decrease based on the gene expression changes described in our dataset. Predictions base on p-value and z-score; positive z-score implies an increase in the predicted function, a negative z-score a decrease (z-score ≥ 2 or ≤ −2 represented by black dotted lines). p-values ≤0.05 (orange dots determined by Fischer’s exact test), illustrate a significant association between a given biological function and genes differentially expressed in our dataset (p-value ≤0.05). p-values are presented as log-transformed. Shapes associated with each gene name and broad category indicate the general classification of the gene product, enzyme, growth factor, etc.
FIGURE 4
FIGURE 4
Network displays interactions between genes regulating cell signaling, cellular function and maintenance, and vitamin and mineral metabolism that were differentially expressed in hASCs treated for 60 min with S.T compared with untreated control. Upregulated genes are colored in shades of red, downregulated in shades of green (p-value ≤ 0.05). IPA inserted Genes in white because they are connected to this network; dashed and solid lines denote indirect and direct relationships between molecules. The IPA molecule activity predictor assessed the activity of molecules strongly connected to this network; blue and orange colored molecules are predicted to have decreased and increased activity, respectively. Shapes associated with each gene name and broad category indicate the general classification of the gene product, enzyme, growth factor, etc.
FIGURE 5
FIGURE 5
Chondrogenic induction. Representative images are shown in phase contrast at ×40 magnification. (A) Alcian Blue staining of chondrogenic differentiation in ASCs post-microbial association. Human and goat ASCs were cultured in chondrogenic differentiation medium for 14 days, and subsequently stained with Alcian Blue. Cellular condensation, as well ridge and micromass formations that stain positive were observed in human and goat ASCs induced for chondrogenesis, independent of S.T treatment. Some background staining was observed in S.T-treated and non-treated cells cultured in control medium, but cells remained in monolayer. Expression of chondrogenic markers post-microbial association was analyzed via quantitative PCR analysis of SOX9 expression in (B) human and (C) goat ASCs induced with chondrogenic differentiation medium and/or treated with S.T.
FIGURE 6
FIGURE 6
Adipogenic induction. Representative images are shown in bright field at ×200 magnification. (A) Oil Red O staining of adipogenic differentiation in ASCs post-microbial association. hASCs and gASCs were cultured in adipogenic induction medium for 21 days and stained with Oil Red O. Accumulation of cytoplasmic lipid droplets were observed in ASCs induced for adipogenesis, independent of S.T treatment. S.T-treated and non-treated ASCs cultured in control medium did not yield lipid-positive cells. Expression of adipogenic markers in ASCs post-microbial association was analyzed via quantitative PCR analysis of PPARγ and FABP4 expression in (B) human and (C) goat ASCs induced with adipogenic induction medium and/or treated with S.T. Data is presented as fold change (±SEM) relative to expression levels in non-treated, non-induced cells (fold change ∼1, indicated by the dotted line). Statistical significance of p < 0.05 is denoted by an asterisk (*), and p < 0.01 denoted by two asterisks (**).
FIGURE 7
FIGURE 7
Osteogenic induction. Representative images are shown in phase contrast at ×40 magnification. (A) Alizarin Red S staining of osteogenic differentiation in ASCs post-microbial association. hASCs were cultured in osteogenic differentiation medium for 14 days, whereas gASCs for 21 days and stained with Alizarin Red S. ASCs cultured in osteoinductive medium stained positive for calcium but did not stain when cultured in control medium, regardless of S.T treatment. Expression of osteogenic markers in ASCs post-microbial association were analyzed via quantitative PCR analysis of COL1A1, ALP and OPN gene expression in (B) human and (C) goat ASCs induced with osteogenic differentiation medium and/or treated.
FIGURE 8
FIGURE 8
Downstream trends analysis of differentially expressed genes in hASCs induced towards osteogenesis post microbial challenge. The IPA regulation z-score algorithm was used to identify biological functions expected to increase or decrease based on the gene expression changes observed in our dataset. Predictions base on p-value and z-score; positive z-score implies an increase in the predicted function, a negative z-score a decrease (z-score ≥ 2 or ≤ −2 represented by black dotted lines). p-values ≤0.05 (orange dots determined by Fischer’s exact test), illustrate a significant association between a given biological function and genes differentially expressed in our dataset (p-value ≤0.05). Shapes associated with each gene name and broad category indicate the general classification of the gene product, enzyme, growth factor, etc.
FIGURE 9
FIGURE 9
Network displays interactions between genes involved in cellular movement, hematological system development and function, and inflammatory response that were differentially expressed in hASCs induced towards an osteogenic lineage following S.T challenge. Upregulated genes are colored in shades of red, downregulated in shades of green. Genes in white were inserted by IPA because they are connected to this network; dashed and solid lines denote indirect and direct relationships between molecules. The IPA molecule activity predictor assessed the activity of molecules strongly connected to this network; blue and orange colored molecules are predicted to have decreased and increased activity, respectively. Shapes associated with each gene name and broad category indicate the general classification of the gene product, enzyme, growth factor, etc.

Similar articles

Cited by

References

    1. Adolphe C., Nieuwenhuis E., Villani R., Li Z. J., Kaur P., Hui C. C., et al. (2014). Patched 1 and patched 2 redundancy has a key role in regulating epidermal differentiation. J. Invest. Dermatol 134 (7), 1981–1990. 10.1038/jid.2014.63 - DOI - PubMed
    1. Akiyama H. (2008). Control of chondrogenesis by the transcription factor Sox9. Mod. Rheumatol. 18 (3), 213–219. 10.1007/s10165-008-0048-x - DOI - PubMed
    1. Ashkar S., Weber G. F., Panoutsakopoulou V., Sanchirico M. E., Jansson M., Zawaideh S., et al. (2000). Eta-1 (osteopontin): An early component of type-1 (cell-mediated) immunity. Science 287 (5454), 860–864. 10.1126/science.287.5454.860 - DOI - PubMed
    1. Bakhtiarizadeh M. R., Moradi-Shahrbabak M., Ebrahimie E. (2013). Underlying functional genomics of fat deposition in adipose tissue. Gene 521 (1), 122–128. 10.1016/j.gene.2013.03.045 - DOI - PubMed
    1. Balaji S., Keswani S. G., Crombleholme T. M. (2012). The role of mesenchymal stem cells in the regenerative wound healing phenotype. Adv. Wound Care (New Rochelle) 1 (4), 159–165. 10.1089/wound.2012.0361 - DOI - PMC - PubMed