CircPVT1 promotes ER-positive breast tumorigenesis and drug resistance by targeting ESR1 and MAVS
- PMID: 37009655
- PMCID: PMC10183818
- DOI: 10.15252/embj.2022112408
CircPVT1 promotes ER-positive breast tumorigenesis and drug resistance by targeting ESR1 and MAVS
Abstract
The molecular mechanisms underlying estrogen receptor (ER)-positive breast carcinogenesis and endocrine therapy resistance remain incompletely understood. Here, we report that circPVT1, a circular RNA generated from the lncRNA PVT1, is highly expressed in ERα-positive breast cancer cell lines and tumor samples and is functionally important in promoting ERα-positive breast tumorigenesis and endocrine therapy resistance. CircPVT1 acts as a competing endogenous RNA (ceRNA) to sponge miR-181a-2-3p, promoting the expression of ESR1 and downstream ERα-target genes and breast cancer cell growth. Furthermore, circPVT1 directly interacts with MAVS protein to disrupt the RIGI-MAVS complex formation, inhibiting type I interferon (IFN) signaling pathway and anti-tumor immunity. Anti-sense oligonucleotide (ASO)-targeting circPVT1 inhibits ERα-positive breast cancer cell and tumor growth, re-sensitizing tamoxifen-resistant ERα-positive breast cancer cells to tamoxifen treatment. Taken together, our data demonstrated that circPVT1 can work through both ceRNA and protein scaffolding mechanisms to promote cancer. Thus, circPVT1 may serve as a diagnostic biomarker and therapeutic target for ERα-positive breast cancer in the clinic.
Keywords: ERα; MAVS; anti-tumor immunity; breast cancer; circPVT1.
© 2023 The Authors. Published under the terms of the CC BY NC ND 4.0 license.
Conflict of interest statement
The authors declare that they have no conflict of interest.
Figures
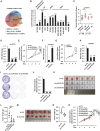
- A
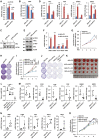
The overlapping between circRNAs predicted by three different tools, CIRI2, find_circ, and CIRCexplorer2, is shown by Venn diagram (back splicing junction (BSJ) reads ≥ 2).
- B
RNA samples extracted from normal breast epithelial cell, MCF10A, and different subtypes of breast cancer cell lines as indicated were subjected to RT‐qPCR analysis to examine the expression of circPVT1 (n = 3 biological replicates, ± s.e.m., ns: non‐significant, *P < 0.05, **P < 0.01, ***P < 0.001 by two‐tailed Student's t‐test).
- C
RNA samples extracted from 28 pairs of ER‐positive (ER+) breast tumor and adjacent normal tissues and 14 pairs of ER‐negative (ER−) breast tumor and adjacent normal tissues were subjected to RT‐qPCR analysis to examine the expression of circPVT1 (± s.e.m., *P < 0.05, **P < 0.01 by two‐tailed Student's t‐test).
- D, E
MCF7 cells transfected with control siRNA (si‐CTL) or two independent siRNAs specifically targeting circPVT1 (si‐circPVT1#1 and si‐circPVT1#2) were subjected to RNA extraction and RT‐qPCR analysis to examine the expression of circPVT1 (D) and cell proliferation assay (E) (n = 3 biological replicates, ± s.e.m., ***P < 0.001, day 4 by two‐tailed Student's t‐test for cell proliferation assay).
- F, G
MCF7 cells were transfected with control vector or vector expressing circPVT1 followed by RT‐qPCR to examine the expression of circPVT1 (F) and cell proliferation assay (G) (n = 3 biological replicates, ± s.e.m., ***P < 0.001, day 4 by two‐tailed Student's t‐test for cell proliferation assay).
- H, I
MCF7 cells were infected with control shRNA (sh‐CTL), or two independent shRNAs specifically targeting circPVT1 (sh‐circPVT1#1 and sh‐circPVT1#2) were subjected to RNA extraction and RT‐qPCR analysis to examine the expression of circPVT1 (H) and colony formation assay (I) (n = 3 biological replicates, ± s.e.m., ***P < 0.001 by two‐tailed Student's t‐test).
- J
Quantification of the crystal violet dye as shown in (I) (n = 3 biological replicates, ± s.e.m., ***P < 0.001 by two‐tailed Student's t‐test).
- K
MCF7 cells infected with sh‐CTL, sh‐circPVT1#1, or sh‐circPVT1#2 were injected subcutaneously into female BALB/C nude mice for xenograft experiments.
- L
The weight of tumors in (K) is shown (n = 6, ± s.e.m., **P < 0.01 by two‐tailed Student's t‐test).
- M
4T1 cells infected with sh‐CTL or sh‐circPvt1 were injected subcutaneously into female BALB/C mice for allograft experiments.
- N
The weight of tumors in (M) is shown (n = 6, ± s.e.m., **P < 0.01 by two‐tailed Student's t‐test).
- O
Tamoxifen‐resistant MCF7 cells transfected with si‐CTL, si‐circPVT1#1, or si‐circPVT1#2 were treated with or without tamoxifen (Tam, 5 μM, 72 h) followed by cell proliferation assay (n = 3 biological replicates, ± s.e.m., ns: non‐significant, *P < 0.05, **P < 0.01, day 4 by two‐tailed Student's t‐test).
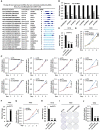
- A
The genomic location, parent gene, and schematic representation of the 20 circRNAs that were commonly predicted by CIRI2, find_circ, and CIRCexplorer2 to be the top 40 with the largest number of BSJ reads. CircRNAs are highlighted in light blue.
- B, C
MCF7 cells were transfected with control siRNA (si‐CTL) or siRNA specifically targeting circRNAs as indicated followed by RNA extraction and RT‐qPCR analysis to examine the expression of corresponding circRNA (B) and cell proliferation assay (C) (n = 3 biological replicates, ± s.e.m., ns: non‐significant, *P < 0.05, ***P < 0.001, day 4 by two‐tailed Student's t‐test for cell proliferation assay).
- D, E
T47D cells transfected with control siRNA (si‐CTL) or two independent siRNAs specifically targeting circPVT1 (si‐circPVT1#1 and si‐circPVT1#2) were subjected to RNA extraction and RT‐qPCR analysis to examine the expression of circPVT1 (D) and cell proliferation assay (E) (n = 3 biological replicates, ± s.e.m., ***P < 0.001, day 4 by two‐tailed Student's t‐test for cell proliferation assay).
- F, G
T47D cells were transfected with control vector or vector expressing circPVT1 followed by RT‐qPCR analysis to examine the expression of circPVT1 (F) and cell proliferation assay (G) (n = 3 biological replicates, ± s.e.m., ***P < 0.001, day 4 by two‐tailed Student's t‐test for cell proliferation assay).
- H, I
T47D cells were infected with sh‐CTL or two independent shRNAs specifically targeting circPVT1 (sh‐circPVT1#1 and sh‐circPVT1#2) were subjected to RNA extraction and RT‐qPCR analysis to examine the expression of circPVT1 (H) and colony formation assay (I) (n = 3 biological replicates, ± s.e.m., ***P < 0.001 by two‐tailed Student's t‐test).
- J
Quantification of the crystal violet dye as shown in (I) (n = 3 biological replicates, ± s.e.m., ***P < 0.001 by two‐tailed Student's t‐test).
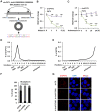
- A
RNA sample from MCF7 cells was subjected to reverse transcription, and standard PCR was performed by using divergent primer sets flanking the junction region of circPVT1, followed by Sanger sequencing. Sequence flanking junction region is shown. Junction site is highlighted in light blue. Sanger sequencing histogram is shown at the bottom. D1: divergent primer 1; D2: divergent primer 2.
- B
Total RNAs extracted from MCF7 cells were incubated with or without RNase R (10 units/μg RNA) at 37°C for duration as indicated, followed by RT‐qPCR analysis to examine the expression of PVT1 or circPVT1 (n = 3 biological replicates, ± s.e.m., ns: non‐significant, **P < 0.01, ***P < 0.001 by two‐tailed Student's t‐test).
- C
MCF7 cells were treated with Actinomycin D (10 g/ml) for duration as indicated, followed by RT‐qPCR analysis to examine the expression of PVT1 or circPVT1 (n = 3 biological replicates, ± s.e.m., ns: non‐significant, **P < 0.01, ***P < 0.001 by two‐tailed Student's t‐test).
- D, E
MCF7 cells were subjected to polysome profiling assay, and the resultant fractions were subjected to RNA exaction and RT‐qPCR analysis to examine the expression of circPVT1 (D) and ACTIN (E). Fractions 1–3: free RNA (unbound with ribosome); Fraction 4: 40S (40S ribosomal subunit); Fractions 5 and 6: 60S (60S ribosomal subunit); Fractions 7–9: monosome; Fractions 10–15: polysome.
- F
MCF7 cells were subjected to cellular fractionation followed by RNA extraction and RT‐qPCR analysis to quantify the amount of circRNA in both nucleus and cytosol of the cells. ACTIN and U6 snoRNA were served as purity control for cytosolic and nuclear fractions, respectively (n = 3 biological replicates, ± s.e.m.).
- G
MCF7 cells transfected with si‐CTL, si‐circPVT1#1, or si‐circPVT1#2 were subjected to RNA‐FISH analysis using probe specifically targeting circPVT1. Red: circPVT1; Blue: DAPI. Scale bar, 5 μm.
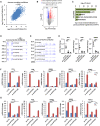
- A, B
MCF7 cells were transfected with control siRNA (si‐CTL) or two individual siRNAs specific against circPVT1 (si‐circPVT1#1 and si‐circPVT1#2) followed by RNA‐seq. The correlation between the effects of the two si‐circPVT1s on the whole transcriptome is shown (Pearson correlation coefficient = 0.615) (A). Genes that are positively and negatively regulated by circPVT1 are shown by volcano plot (FDR < 0.05, FC > 1.5) (B).
- C
The five most enriched hallmark terms for genes positively regulated by circPVT1 are shown.
- D, E
UCSC genome browser views of RNA‐seq as described in (A) for TFF1 (D) and GREB1 (E) are shown.
- F
MCF7 cells transfected with si‐CTL, si‐circPVT1#1, or si‐circPVT1#2 were treated with or without estrogen (E2, 10−7 M, 6 h) followed by RNA extraction and RT‐qPCR analysis to examine the expression of genes as indicated (n = 3 biological replicates, ± s.e.m., *P < 0.05, **P < 0.01, ***P < 0.001 by two‐tailed Student's t‐test).
- G
MCF7 cells infected with sh‐CTL, sh‐circPVT1#1, or sh‐circPVT1#2 were treated with or without estrogen (E2, 10−7 M, 6 h) followed by RNA extraction and RT‐qPCR analysis to examine the expression of genes as indicated (n = 3 biological replicates, ± s.e.m., **P < 0.01, ***P < 0.001 by two‐tailed Student's t‐test).
- H
Tumor samples as described in Fig 1K were subjected to RNA extraction and RT‐qPCR analysis to examine the expression of genes as indicated (n = 6 biological replicates, ± s.e.m., ***P < 0.001 by two‐tailed Student's t‐test).
- A
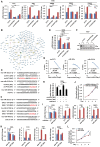
T47D cells were transfected with control siRNA (si‐CTL) or two independent siRNAs specifically targeting circPVT1 (si‐circPVT1#1 and si‐circPVT1#2) followed by RT‐qPCR analysis to examine the expression of genes as indicated (n = 3 biological replicates, ± s.e.m., **P < 0.01, ***P < 0.001).
- B
CeRNA network containing circPVT1, miRNAs, and circPVT1 positively regulated genes is shown.
- C
The sequence match between miR‐181a‐2‐3p, miR‐6715b‐5p, or miR‐449b‐3p and linear sequence of circPVT1 (circPVT1 (WT)) or circPVT1 mutant form with the potential miR‐181a‐2‐3p or miR‐6715b‐5p binding site mutated (circPVT1 (MT)) is shown.
- D
The sequence match between miR‐181a‐2‐3p, miR‐6715b‐5p, or miR‐449b‐3p and 3′ UTR of ESR1 (ESR1 3′ UTR (WT)) or the mutant form with the potential miR‐181a‐2‐3p or miR‐6715b‐5p binding site mutated (ESR1 3′ UTR (WT)) is shown.
- E, F
T47D cells transfected with si‐CTL, si‐circPVT1#1, or si‐circPVT1#2 and treated with or without estrogen (E2, 10−7 M, 6 h) were subjected to RT‐qPCR analysis (E) to examine the expression of ESR1 and immunoblotting analysis (F) using antibodies as indicated (n = 3 biological replicates, ± s.e.m., *P < 0.05, **P < 0.01 by two‐tailed Student's t‐test).
- G
The standard curves for copy number analysis of molecules as indicated are shown. Two‐fold serial dilutions of reference standard were first performed, and Ct value from qPCR analysis versus the dilution factor was plotted, fitting the data to a straight line.
- H
MCF7 cells transfected with or without circPVT1(WT) or circPVT1(MT) in the presence or absence of miR‐181a‐2‐3p mimic were subjected to RT‐qPCR analysis to examine the expression of ESR1 (n = 3 biological replicates, ± s.e.m., ns: non‐significant, *P < 0.05 by two‐tailed Student's t‐test).
- I
MCF7 transfected with control inhibitor or miR‐181a‐2‐3p inhibitor was treated with or without estrogen (E2, 10−7 M, 6 h), followed by RT‐qPCR analysis to examine the expression of genes as indicated (n = 3 biological replicates, ± s.e.m., ns: non‐significant, *P < 0.05 by two‐tailed Student's t‐test).
- J
MCF7 transfected with control inhibitor or miR‐181a‐2‐3p inhibitor was subjected to cell proliferation assay (n = 3 biological replicates, ± s.e.m., ns: non‐significant, day 4 by two‐tailed Student's t‐test).
- K
MCF7 transfected with control mimic or miR‐181a‐2‐3p mimic was treated with or without estrogen (E2, 10−7 M, 6 h), followed by RT‐qPCR analysis to examine the expression of genes as indicated (n = 3 biological replicates, ± s.e.m., ns: non‐significant, *P < 0.05, **P < 0.01, by two‐tailed Student's t‐test).
- L
MCF7 transfected with control mimic or miR‐181a‐2‐3p mimic was subjected to cell proliferation assay (n = 3 biological replicates, ± s.e.m., ***P < 0.001, day 4 by two‐tailed Student's t‐test).
- A
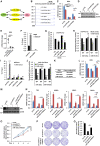
The three miRNAs, miR‐449b‐3p, miR‐181a‐2‐3p, and miR‐6715b‐5p that can bind to both circPVT1 and ESR1 predicted by ceRNA network analysis are shown.
- B
UCSC genome browser views of RNA‐seq as described in Fig 3A for ESR1 are shown.
- C, D
MCF7 cells transfected with control siRNA (si‐CTL) or siRNAs specifically targeting circPVT1 (si‐circPVT1#1 and si‐circPVT1#2) were treated with or without estrogen (E2, 10−7 M, 6 h) followed by RT‐qPCR analysis (C) and immunoblotting analysis (D) to examine the expression of ERα (n = 3 biological replicates, ± s.e.m., **P < 0.01, ***P < 0.001 by two‐tailed Student's t‐test).
- E
Tumor samples as described in Fig 1K were subjected to RNA extraction and RT‐qPCR analysis to examine the expression of ESR1 (n = 6 biological replicates, ± s.e.m., ***P < 0.001 by two‐tailed Student's t‐test).
- F
RNA immunoprecipitation (RIP) was performed in MCF7 cells by using control IgG or anti‐AGO2 antibody followed by RT‐qPCR analysis to examine the binding of circPVT1 and U6 snoRNA (n = 3 biological replicates, ± s.e.m., ns: non‐significant, ***P < 0.001 by two‐tailed Student's t‐test).
- G
Full‐length, linear sequence of circPVT1 was cloned into psiCHECK2 luciferase reporter vector (circPVT1‐luc), which were then transfected into HEK293T cells with control (CTL), miR‐181a‐2‐3p, miR‐449b‐3p, or miR‐6715b‐5p mimic followed by luciferase activity measurement (n = 3 biological replicates, ± s.e.m., *P < 0.05 by two‐tailed Student's t‐test).
- H
Wild‐type circPVT1‐luc (circPVT1 (WT)‐luc) and its mutant form with the potential miR‐181a‐2‐3p or miR‐6715b‐5p binding site mutated (circPVT1 (MT)‐luc) were transfected into HEK293T cells with or without CTL, miR‐181a‐2‐3p, or miR‐6715b‐5p mimic followed by luciferase activity measurement (n = 3 biological replicates, ± s.e.m., ns: non‐significant, **P < 0.01 by two‐tailed Student's t‐test).
- I
Oligonucleotide pull‐down assay was performed by incubating MCF7 cell lysates with sense or anti‐sense oligonucleotide‐targeting circPVT1 followed by RT‐qPCR analysis to detect the associated RNA as indicated (n = 3 biological replicates, ± s.e.m., ns: non‐significant, *P < 0.05, ***P < 0.001 by two‐tailed Student's t‐test).
- J
The 3′ untranslated region (UTR) of ESR1 (ESR1 (WT)‐luc) and its mutant form with the miR‐181a‐2‐3p or miR‐6715b‐5p binding site mutated (ESR1 (MT)‐luc) were cloned into psiCHECK2 luciferase reporter vector, which were then transfected with or without CTL, miR‐181a‐2‐3p, or miR‐6715b‐5p mimic into HEK293T cells followed by luciferase activity measurement (n = 3 biological replicates, ± s.e.m., ns: non‐significant, ***P < 0.001 by two‐tailed Student's t‐test).
- K
MCF7 cells were subjected to copy number analysis for genes as indicated. Copy number was calculated based on the standard curves as shown in Fig EV3G.
- L–N
MCF7 cells transfected with si‐CTL or si‐circPVT1 in the presence or absence of miR‐181a‐2‐3p inhibitor were subjected to RT‐qPCR analysis (L, N) to examine the expression of genes as indicated and immunoblotting analysis (M) using antibodies as indicated (n = 3 biological replicates, ± s.e.m., **P < 0.01, ***P < 0.001 by two‐tailed Student's t‐test).
- O
MCF7 cells transfected with si‐CTL or si‐circPVT1 in the presence or absence of miR‐181a‐2‐3p inhibitor were subjected to cell proliferation assay (n = 3 biological replicates, ± s.e.m., ns: non‐significant, **P < 0.01, day 4 by two‐tailed Student's t‐test).
- P
MCF7 cells that were infected with control shRNA (sh‐CTL) or shRNAs specifically targeting circPVT1 (sh‐circPVT1) in the presence or absence of miR‐181a‐2‐3p inhibitor were subjected to colony formation assay.
- Q
Quantification of the crystal violet dye as shown in (P) (n = 3 biological replicates, ± s.e.m., **P < 0.01 by two‐tailed Student's t‐test).
- A
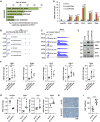
The five most enriched hallmark terms for genes negatively regulated by circPVT1 are shown.
- B, C
UCSC genome browser views of RNA‐seq as described in Fig 3A for CCL5 (B) and ISG15 (C) are shown.
- D, E
MCF7 cells were transfected with control siRNA (si‐CTL) or two individual siRNAs specific against circPVT1 (si‐circPVT1#1 and si‐circPVT1#2) were subjected to RT‐qPCR analysis (D) to examine the expression of genes as indicated and immunoblotting analysis (E) using antibodies as indicated (n = 3 biological replicates, ± s.e.m., **P < 0.01, ***P < 0.001 by two‐tailed Student's t‐test).
- F
Tumor samples as described in Fig 1K were subjected to RT‐qPCR analysis to examine the expression of genes as indicated (n = 6 biological replicates, ± s.e.m., *P < 0.05, **P < 0.01, ***P < 0.001 by two‐tailed Student's t‐test).
- G, H
Tumor samples as described in Fig 1M were subjected to RNA extraction and RT‐qPCR analysis (G) to examine the expression of genes as indicated and immunohistochemistry analysis (H) using anti‐CD8 antibody. Dark brown staining indicates CD8‐positive cell. Scale bar, 100 μm (n = 6 biological replicates, ± s.e.m., *P < 0.05, **P < 0.01, ***P < 0.001 by two‐tailed Student's t‐test).
- I
The quantification of CD8‐positive cells as described in (H) is shown (n = 3 biological replicates, mean ± s.e.m., ***P < 0.001 by two‐tailed Student's t‐test).

- A–D
T47D (A, B) and HCC1937 (C, D) cells transfected with control siRNA (si‐CTL) or two independent siRNAs specifically targeting circPVT1 (si‐circPVT1#1 and si‐circPVT1#2) were subjected to immunoblotting analysis (A, C) using antibodies as indicated and RT‐qPCR analysis (B, D) to examine the expression of genes as indicated (n = 3 biological replicates, ± s.e.m., *P < 0.05, **P < 0.01, ***P < 0.001 by two‐tailed Student's t‐test).
- E, F
4T1 cells infected with control shRNA (sh‐CTL) or shRNA specifically targeting circPvt1 (sh‐circPvt1) were subjected to immunoblotting analysis (E) using antibodies as indicated and RT‐qPCR analysis (F) to examine the expression of genes as indicated (n = 3 biological replicates, ± s.e.m., *P < 0.05, **P < 0.01, ***P < 0.001 by two‐tailed Student's t‐test).

- A–D
MCF7 cells infected with sh‐CTL or shRNAs specifically targeting STING (sh‐STING) (A), MAVS (sh‐MAVS) (B), MDA5 (sh‐MDA5) (C), or RIGI (sh‐RIGI) (D) were subjected to immunoblotting analysis using antibodies as indicated.
- E, F
RIP analysis was performed in MCF7 cells by using control IgG or anti‐RIGI antibody followed by immunoblotting analysis to examine RIGI (E) or RT‐qPCR analysis to examine the binding of RIGI with circPVT1 and 7SK snRNA (F) (n = 3 biological replicates, ± s.e.m., ns: non‐significant by two‐tailed Student's t‐test).
- A
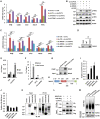
MCF7 cells infected with control shRNA (sh‐CTL) or shRNAs specifically targeting MAVS (sh‐MAVS) or STING (sh‐MAVS) were transfected with control siRNA (si‐CTL) or siRNA specifically targeting circPVT1 (si‐circPVT1) followed by RT‐qPCR analysis to examine the expression of genes as indicated (n = 3 biological replicates, ± s.e.m., ns: non‐significant, *P < 0.05, **P < 0.01, ***P < 0.001 by two‐tailed Student's t‐test).
- B, C
MCF7 cells infected with sh‐CTL, sh‐MAVS, sh‐MDA5, or sh‐RIGI were transfected with si‐CTL or si‐circPVT1 followed by immunoblotting analysis (B) using antibodies as indicated and RT‐qPCR analysis (C) to examine the expression of genes as indicated (n = 3 biological replicates, ± s.e.m., ns: non‐significant, *P < 0.05, **P < 0.01, ***P < 0.001 by two‐tailed Student's t‐test).
- D, E
RNA immunoprecipitation (RIP) was performed in MCF7 by using control IgG or anti‐MAVS antibody followed by immunoblotting analysis (D) using antibodies as indicated and RT‐qPCR analysis (E) to examine the binding of MAVS with circPVT1 and 7SK snRNA (n = 3 biological replicates, ± s.e.m., ***P < 0.001 by two‐tailed Student's t‐test).
- F, G
ChIRP analysis was performed in MCF7 cells with sense or anti‐sense probe specifically targeting the junction region of circPVT1 followed by RT‐qPCR analysis (F) to examine the RNA molecules being pulled down as indicated and immunoblotting analysis (G) to examine the interaction between MAVS and circPVT1 (n = 3 biological replicates, ± s.e.m., ns: non‐significant, **P < 0.01 by two‐tailed Student's t‐test).
- H
Schematic representation of MAVS protein is shown. CARD: caspase activation and recruitment domain; PRO: proline‐rich domain; TM: transmembrane domain; NTD: amino‐terminal domain; CTD: carboxyl‐terminal domain.
- I–K
HEK293T cells transfected with HA‐tagged MAVS‐FL, MAVS‐NTD, or MAVS‐CTD were subjected to RIP using anti‐HA antibody followed by RT‐qPCR analysis to examine the binding of circPVT1 (I) and 18 s rRNA (J) or immunoblotting analysis (K) using antibodies as indicated (n = 3 biological replicates, ± s.e.m., *P < 0.05, **P < 0.01 by two‐tailed Student's t‐test). Asterisks indicate the predicted size of the corresponding proteins.
- L
HEK293T cells transfected with HA‐tagged MAVS and Flag‐tagged RIGI in the presence or absence of circPVT1 were subjected to immunoprecipitation (IP) with anti‐Flag M2 agarose followed by immunoblotting analysis using antibodies as indicated.
- M
MCF7 cells transfected with si‐CTL, si‐circPVT1#1, or si‐circPVT1#2 were subjected to SDD‐AGE and SDS‐PAGE analysis using antibodies as indicated.
- A–F
MCF7 cells transfected with control ASO (ASO‐CTL) or ASO specifically targeting circPVT1 (ASO‐circPVT1) were subjected to RT‐qPCR analysis (A, B, D, F) to examine the expression of genes as indicated and immunoblotting analysis (C, E) using antibodies as indicated (n = 3 biological replicates, ± s.e.m., *P < 0.05, **P < 0.01, ***P < 0.001 by two‐tailed Student's t‐test).
- G, H
Cells as described in (A) were subjected to cell proliferation (G) and colony formation assay (H) (n = 3 biological replicates, ± s.e.m., **P < 0.01, day 4 by two‐tailed Student's t‐test).
- I, J
MCF7 cells were treated with ASO‐CTL, ASO‐circPVT1 (50 nM), or fulvestrant (ICI, 1 μM) for duration as indicated followed by cell proliferation assay (I) and colony formation (J) (n = 3 biological replicates, ± s.e.m., **P < 0.01, ***P < 0.001, day 4 by two‐tailed Student's t‐test).
- K, L
MCF7 cells were injected subcutaneously into female BALB/C nude mice, randomized, and then treated with estrogen in the presence of fulvestrant (ICI, 5 mg per dose, weekly) and/or ASO‐circPVT1 (5 nm per dose, every 3 days). Tumors were then excised, photographed (K), and weighted (L) 4 weeks after subcutaneous injection (n = 6, ± s.e.m., ***P < 0.001 by two‐tailed Student's t‐test).
- M, N
Tumor samples as described in (K) were subjected to RNA extraction and RT‐qPCR analysis to examine the expression of genes as indicated (n = 6 biological replicates, ± s.e.m., *P < 0.05, **P < 0.01, ***P < 0.001 by two‐tailed Student's t‐test).
- O
Tamoxifen‐resistant MCF7 cells transfected with ASO‐CTL or ASO‐circPVT1 and treated with or without tamoxifen (Tam, 5 μM) were subjected to cell proliferation assay (n = 3 biological replicates, ± s.e.m., ns: non‐significant, *P < 0.05, **P < 0.01, day 4 by two‐tailed Student's t‐test).

- A
Quantification of the crystal violet dye as shown in Fig 7H (n = 3 biological replicates, ± s.e.m., ***P < 0.001 by two‐tailed Student's t‐test).
- B
Quantification of the crystal violet dye as shown in Fig 7J (n = 3 biological replicates, ± s.e.m., ***P < 0.001 by two‐tailed Student's t‐test).
- C
The growth curve of tumors as shown in Fig 7K (n = 6, ± s.e.m., ***P < 0.001, two‐way ANOVA).

References
-
- Ablasser A, Hur S (2020) Regulation of cGAS‐ and RLR‐mediated immunity to nucleic acids. Nat Immunol 21: 17–29 - PubMed
-
- Ashwal‐Fluss R, Meyer M, Pamudurti NR, Ivanov A, Bartok O, Hanan M, Evantal N, Memczak S, Rajewsky N, Kadener S (2014) circRNA biogenesis competes with pre‐mRNA splicing. Mol Cell 56: 55–66 - PubMed
Publication types
MeSH terms
Substances
Associated data
- Actions
LinkOut - more resources
Full Text Sources
Other Literature Sources
Medical
Molecular Biology Databases
Miscellaneous

