

LINC00493-encoded microprotein SMIM26 exerts anti-metastatic activity in renal cell carcinoma
- PMID: 37009826
- PMCID: PMC10240204
- DOI: 10.15252/embr.202256282
LINC00493-encoded microprotein SMIM26 exerts anti-metastatic activity in renal cell carcinoma
Abstract
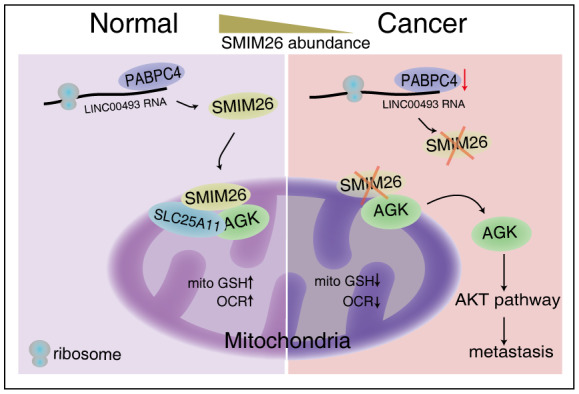
Human microproteins encoded by long non-coding RNAs (lncRNA) have been increasingly discovered, however, complete functional characterization of these emerging proteins is scattered. Here, we show that LINC00493-encoded SMIM26, an understudied microprotein localized in mitochondria, is tendentiously downregulated in clear cell renal cell carcinoma (ccRCC) and correlated with poor overall survival. LINC00493 is recognized by RNA-binding protein PABPC4 and transferred to ribosomes for translation of a 95-amino-acid protein SMIM26. SMIM26, but not LINC00493, suppresses ccRCC growth and metastatic lung colonization by interacting with acylglycerol kinase (AGK) and glutathione transport regulator SLC25A11 via its N-terminus. This interaction increases the mitochondrial localization of AGK and subsequently inhibits AGK-mediated AKT phosphorylation. Moreover, the formation of the SMIM26-AGK-SCL25A11 complex maintains mitochondrial glutathione import and respiratory efficiency, which is abrogated by AGK overexpression or SLC25A11 knockdown. This study functionally characterizes the LINC00493-encoded microprotein SMIM26 and establishes its anti-metastatic role in ccRCC, and therefore illuminates the importance of hidden proteins in human cancers.
Keywords: SMIM26; clear cell renal cell carcinoma; hidden proteins; metastasis; microproteins.
© 2023 The Authors.
Conflict of interest statement
The authors declare that they have no conflict of interest.
Figures
- A
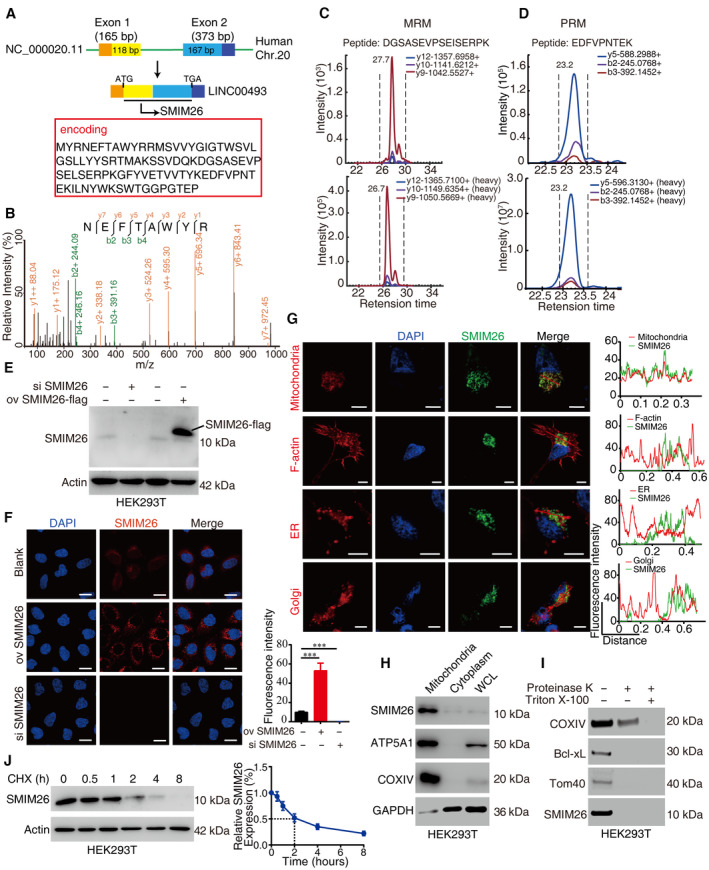
Schematic representation of SMIM26 translated from LINC00493 located in Chr.20. The SMIM26 comprises the end of exon 1 and the head of exon 2.
- B
The SMIM26 unique peptide was identified by shotgun mass spectrometry in HEK293T cells.
- C
MRM mass spectrometry verification of the unique peptide (heavy) of SMIM26 in HEK293T cells.
- D
PRM mass spectrometry verification of the unique peptide (heavy) of SMIM26 in HEK293T cells.
- E
Immunoblotting verification of the SMIM26 in HEK293T with overexpression or knockdown of SMIM26 by using SMIM26‐specific antibody.
- F
Immunofluorescence staining of SMIM26 with anti‐SMIM26 antibody in the cell with overexpression or knockdown of SMIM26. Nuclei were stained with DAPI (blue), and SMIM26 staining intensity (red) was quantified. Data are representative of three biological replicates. Unpaired two‐tailed Student's t‐test, ***P < 0.001; Bar, SEM; Scale bar, 20 μm.
- G
Immunofluorescence detected subcellular localization of SMIM26 (green) with mitochondria, F‐actin, ER, and Golgi. Nuclei were stained with DAPI (blue), and the co‐localization between red (mitochondria, F‐actin, ER, and Golgi) and green (SMIM26) was measured. Scale bar, 10 μm. The co‐localization of SMIM26 with mitochondria, F‐actin, ER, and Golgi in cells was measured by fluorescence intensity analysis with ImageJ software. The red line of statistical analysis centers on the co‐location of SMIM26 and indicates cell organelle.
- H, I
Mitochondria were purified and SMIM26 was enriched in mitochondria fractions (H), SMIM26 is a mitochondrial outer membrane protein as detected by proteinase K and Triton X‐100 assay in HEK293T cells (I).
- J
The degradation half‐life of SMIM26 was detected in HEK293T. Three biological replicates. Data are shown as mean ± SEM.
- A
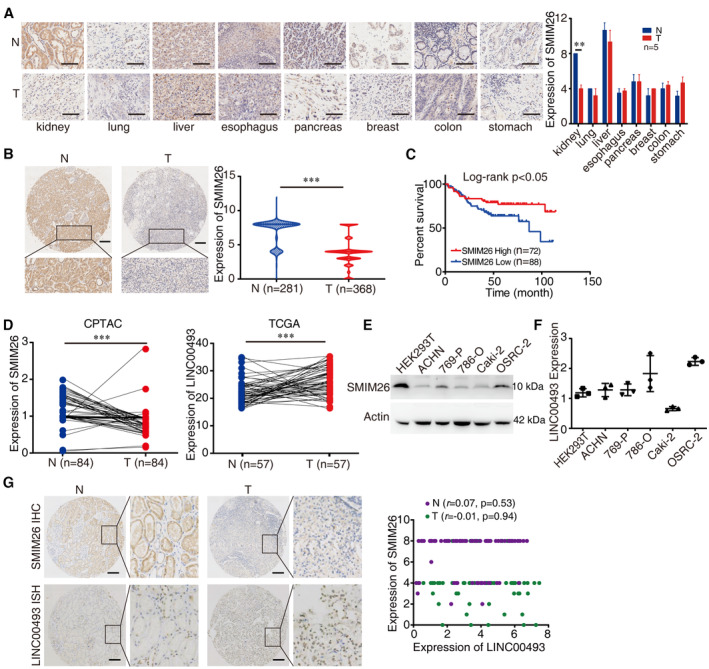
Representative immunohistochemistry (IHC) images of SMIM26 protein level in multiple types of tumoral tissues (T) and adjacent non‐tumorous tissues (N), showing that SMIM26 has significantly decreased expression in kidney cancer only. Mann–Whitney test, **P < 0.01; n = 5; Bar, SEM; Scale bar, 100 μm.
- B
Representative IHC images of SMIM26 protein levels in 368 ccRCC tissues (T) and 281 non‐tumorous renal tissues (N). Mann–Whitney test, ***P < 0.001; Scale bar, 200 μm.
- C
A Kaplan–Meier survival analysis of ccRCC patients with high or low expression levels of SMIM26 (P < 0.05, log‐rank test).
- D
The expression of SMIM26 proteins level (left) and RNA level (right) in paired ccRCC and adjacent non‐tumor tissues were analyzed by CPTAC and TCGA databases, respectively. Mann–Whitney test, ***P < 0.001.
- E, F
The protein level (E) and RNA level (F) of SMIM26 were detected in five ccRCC cell lines by western blotting and qRT–PCR. Data are shown as mean ± SEM of three biological replicates.
- G
The protein level of SMIM26 (up) and RNA level of LINC00493 (down) in ccRCC tissues (T) and their adjacent non‐tumoral tissues (N) were detected by IHC staining and RNA in situ hybridization (ISH) staining. The right scatter plot shows no significant correlation between SMIM26 protein expression and LINC00493 RNA expression in ccRCC tissues (green dots, P = 0.94) and adjacent non‐tumorous renal tissues (purple dots, P = 0.53). n = 72. Scale bar, 200 μm.
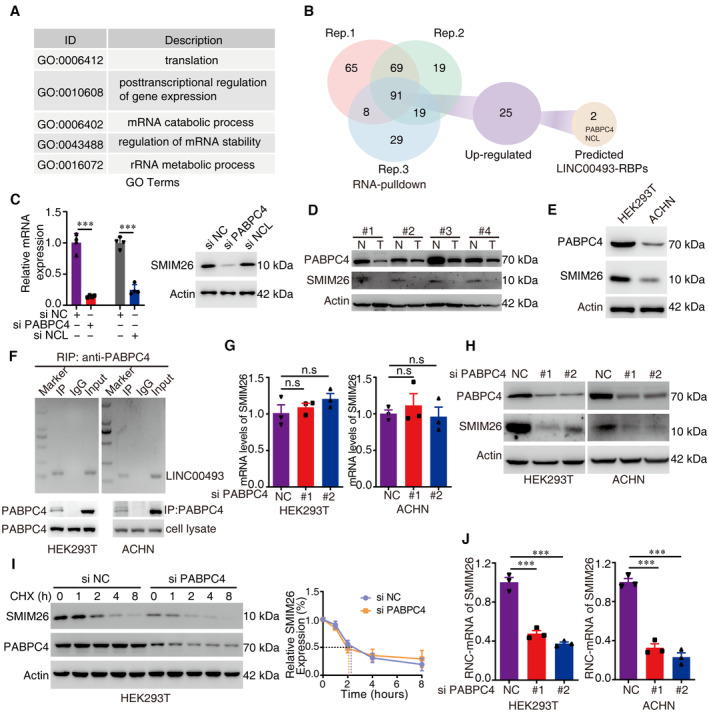
Gene ontology analysis showed that LINC00493‐binding proteins were most enriched in translation‐related pathways.
RNA‐binding proteins of LINC00493 were identified by RNA pulldown coupled with SILAC‐MS. A total of 91 LINC00493‐binding proteins were identified, 25 proteins of which were upregulated in HEK293T compared with ACHN cells, and 2 reliable LINC00493‐binding proteins were further presented by using protein–RNA interactions software.
Silenced PABPC4 rather than NCL decreased SMIM26. The left histogram shows the level of PABPC4 and NCL, data are shown as mean ± SEM of four biological replicates. Unpaired two‐tailed Student's t‐test, ***P < 0.001.
The expression of PABPC4 and SMIM26 in ccRCC tissues compared with adjacent non‐tumor tissues was detected by western blotting.
The expression of PABPC4 and SMIM26 was downregulated in ACHN cells compared with HKE293T cells.
RIP assay showing a strong binding of LINC00493 with PABPC4 in HEK293T and ACHN cells.
RNA levels of SMIM26 were determined by qRT–PCR in PABPC4 knockdown cells. Data are shown as mean ± SEM of three biological replicates. Unpaired two‐tailed Student's t‐test. n.s, non‐significant. Bars, SEM.
Western blotting validation of SMIM26 expression in cells upon knockdown of PABPC4.
Knocking down PABPC4 could not significantly alter the degradation half‐life of SMIM26 protein. Data are shown as mean ± SEM of three biological replicates.
RNC of SMIM26 was detected in HEK293T and ACHN cells transfected with anti‐PABPC4 siRNAs. Unpaired two‐tailed Student's t‐test, ***P < 0.001. Data are shown as mean ± SEM of three biological replicates.
- A
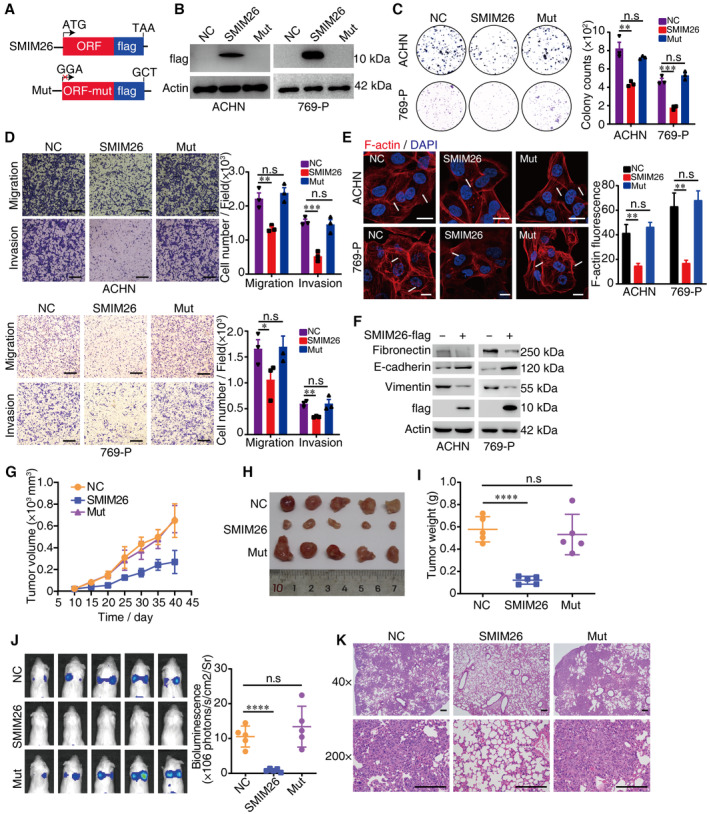
Two vectors including SMIM26‐flag (SMIM26) and SMIM26‐mut‐flag (Mut) were constructed. For the mutation, start codon ATG was mutated to GGA and stop codon TAA was mutated to GCT to abolish the protein expression from LINC00493.
- B
Immunoblotting validation of SMIM26 expression using anti‐flag antibody in both ACHN and 769‐P cells transfected with indicated constructs.
- C
Clonogenic assays were performed to test the colony formation ability of both ccRCC cells transfected with indicated constructs. Unpaired two‐tailed Student's t‐test, **P < 0.01, ***P < 0.001. n.s, non‐significant. Data are shown as mean ± SEM of three biological replicates.
- D
Transwell assays were used to test the migration and invasion abilities of both ccRCC cells transfected with indicated constructs. Unpaired two‐tailed Student's t‐test, *P < 0.05, **P < 0.01, ***P < 0.001. n.s, non‐significant. Data are shown as mean ± SEM of three biological replicates. Scale bar, 600 μm.
- E
Immunofluorescence staining of F‐actin (red) in ACHN and 769‐P cells transfected with indicated constructs. Nuclei were stained with DAPI (blue). The intensity of F‐actin fluorescence was statistically plotted. Unpaired two‐tailed Student's t‐test, **P < 0.01, n.s, non‐significant. Data are shown as mean ± SEM of three biological replicates. Scale bar, 20 μm.
- F
Western blotting showed that mesenchymal marker of vimentin and fibronectin was decreased, and E‐cadherin was increased in SMIM26‐overexpressing cells.
- G–I
Xenograft mouse model using control or SMIM26‐overexpressing ACHN cells. Analyses of tumor growth (G), tumor volume (H), and tumor weight (I) are shown. Data are shown as mean ± SD of five mice per group. Unpaired two‐tailed Student's t‐test, ****P < 0.0001. n.s, non‐significant.
- J
NOD‐SCID mice were transplanted with ACHN‐luci cells with or without overexpression of SMIM26 via tail vein injection, respectively. Bioluminescent was visualized 5 weeks later by using an IVIS 200 Imaging System. Data are shown as mean ± SD of five mice per group. Unpaired two‐tailed Student's t‐test, ****P < 0.0001. n.s, non‐significant.
- K
Hematoxylin and eosin (H&E) staining of pulmonary metastases in the mouse model. Scale bar, 200 μm.
- A
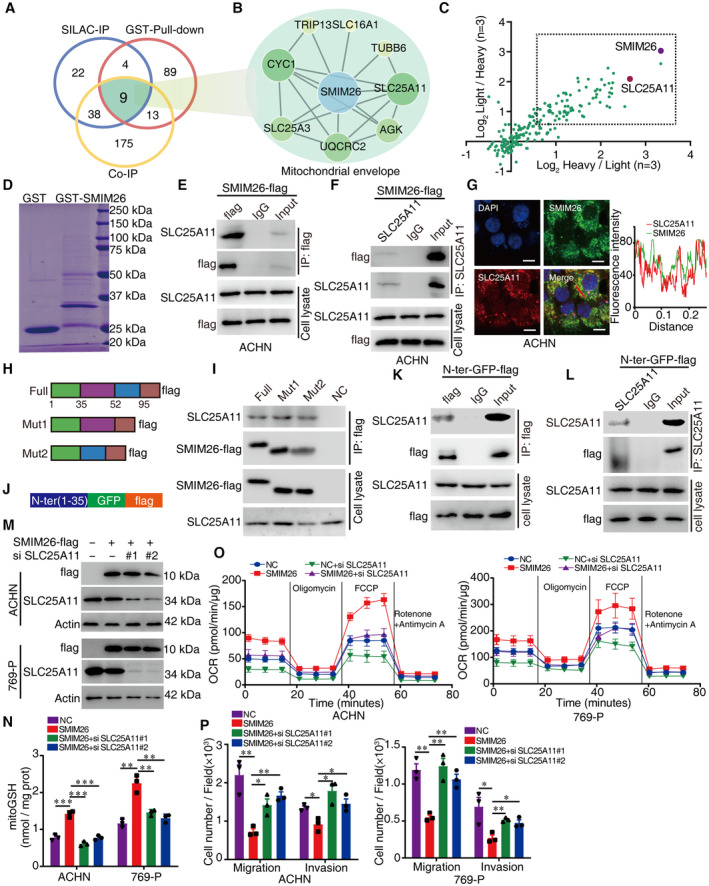
The Venn diagram showing the overlap of SMIM26‐binding proteins identified by three strategies including SILAC‐IP, Co‐IP, and GST pulldown; 9 candidate proteins were co‐identified.
- B
Eight binding partners of SMIM26 associated with PPI network were established.
- C
The candidate binding proteins of SMIM26 were plotted according to H/L and L/H ratios by SILAC‐CoIP MS.
- D
GST pulldown of the binding proteins of SMIM26.
- E, F
Co‐IP assays were performed to detect the interaction between SMIM26 and SLC25A11. Lysates from ACHN cells expressing SMIM26‐flag were co‐immunoprecipitated by anti‐flag antibody (E) and anti‐SLC25A11 antibody (F), respectively, SMIM26 and SLC25A11 were detected by western blotting.
- G
Co‐localization of SMIM26 (green) with SLC25A11 (red) in ACHN was determined by immunofluorescence. Nuclei were stained with DAPI (blue). Scale bar, 10 μm. The red line of statistical analysis centers on the co‐location of SMIM26 and SLC25A11.
- H
Diagram of SMIM26 wild‐type and domain deletion mutation constructs.
- I
The indicated flag‐tagged wild‐type and mutants of SMIM26 were transfected into HEK293T cells, SMIM26‐flag complexes were Co‐IP by anti‐flag antibody, and SLC25A11 and SMIM26‐flag were then detected.
- J
Diagram of GFP‐flag fusion constructs with the N‐ter domain of SMIM26 (1–35 aa).
- K, L
N‐ter domain of SMIM26 fused with GFP‐flag interacted with SLC25A11. The N‐ter SMIM26‐GFP‐flag construct was transfected into HEK293T cells, co‐immunoprecipitation was performed by using anti‐flag antibody (K) and anti‐SLC25A11 antibody (L).
- M
ACHN and 769‐P cells were transfected with SMIM26‐flag and si‐SLC25A11 as indicated, SMIM26 and SLC25A11 were detected by western blotting.
- N
The mitoGSH level of ACHN and 769‐P cells with indicated treatment was detected. Unpaired two‐tailed Student's t‐test, **P < 0.01, ***P < 0.001. Data are shown as mean ± SEM of three biological replicates.
- O
Oxygen consumption rate profile was monitored in cells with indicated treatment by using a Seahorse XF24 analyzer. The metabolic inhibitors were injected at different time points, as indicated. Data are shown as mean ± SD of three biological replicates.
- P
Transwell assays were used to test the migration and invasion abilities of both ccRCC cells with indicated treatment. Unpaired two‐tailed Student's t‐test, *P < 0.05, **P < 0.01. Data are shown as mean ± SEM of three biological replicates.
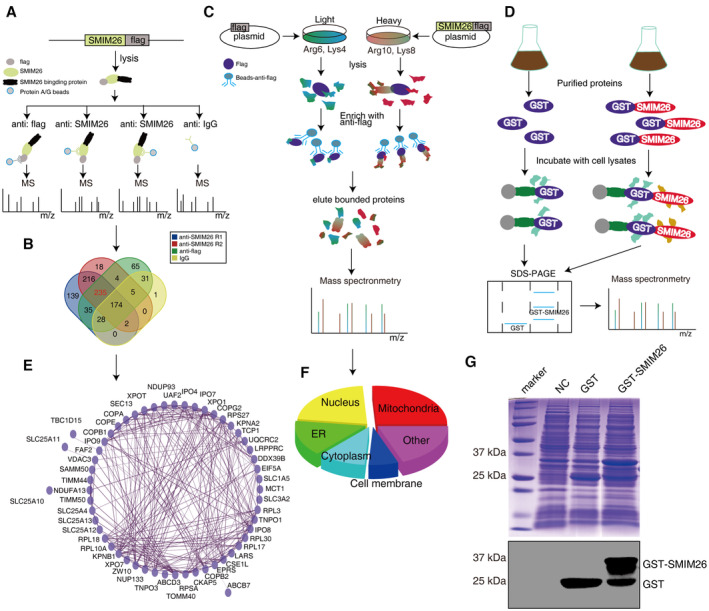
The diagram depicting the workflow of identifying SMIM26‐interacting proteins. The SMIM26‐flag plasmid was transfected into HEK293T cells, anti‐flag and anti‐SMIM26 antibodies were used for immunoprecipitation, and anti‐IgG was used as the control; the immunoprecipitated proteins were identified by mass spectrometry.
Venn diagram showing 235 proteins potentially interacted with SMIM26.
SILAC‐CoIP was used to identify SMIM26‐interacting proteins. HEK293T cells cultured in heavy medium (Arg10 and Lys8) or light medium (Arg6 and Lys4) were transfected with control plasmid or SMIM26‐flag plasmid, respectively. After anti‐flag antibody was used for immunoprecipitation, lysates were mixed and subjected to mass spectrometric analysis.
The diagram showing the workflow of GST pulldown. GST and GST‐SMIM26 expression were induced by IPTG and purified in prokaryotic cells BL21, then subjected to pulldown experiments with cell lysates, and the products were subjected to mass spectrometric analysis.
The PPI network of SMIM26 was constructed by Cytoscape software.
GO analysis (cellular components) of SMIM26 interacting proteins was shown in the pie chart.
Coomassie blue staining showing the expression of GST‐SMIM26 protein in BL21 cells was successfully induced by IPTG.
- A, B
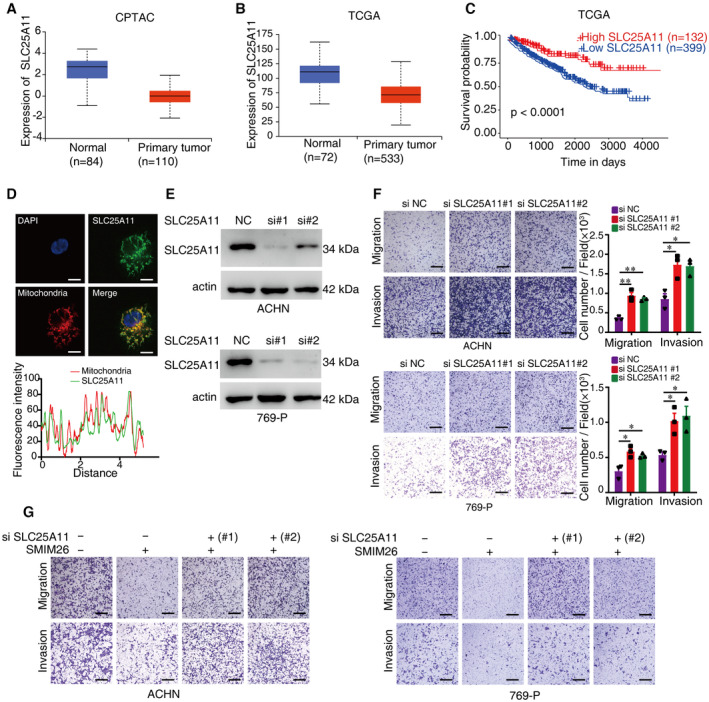
The comparisons of SLC25A11 expression in ccRCC tissue and normal tissue from CPTAC (A) and TCGA databases (B). The central lines reflect the median, and the bottom and top of the box represent the first and third quartiles, respectively. The whiskers reflect the min‐to‐max distribution of expression.
- C
The TCGA database depicts that the low expression of SLC25A11 is associated with a poor prognosis of ccRCC patients.
- D
Immunofluorescence of SLC25A11 (green) and mitochondria (red) in ACHN cells. Nuclei were stained with DAPI (blue). Scale bar, 10 μm.
- E
Immunoblotting validation of the knockdown effect of SLC25A11 in ACHN and 769‐P cells.
- F
Migration and invasion abilities of ACHN and 769‐P cells with or without knockdown of SLC25A11 were detected by transwell assays. Unpaired two‐tailed Student's t‐test, *P < 0.05, **P < 0.01. Scale bar, 600 μm. Data are shown as mean ± SEM of three biological replicates.
- G
Transwell assays were used to test the migration and invasion abilities of both ccRCC cells with indicated treatment. Scale bar, 600 μm.
- A, B
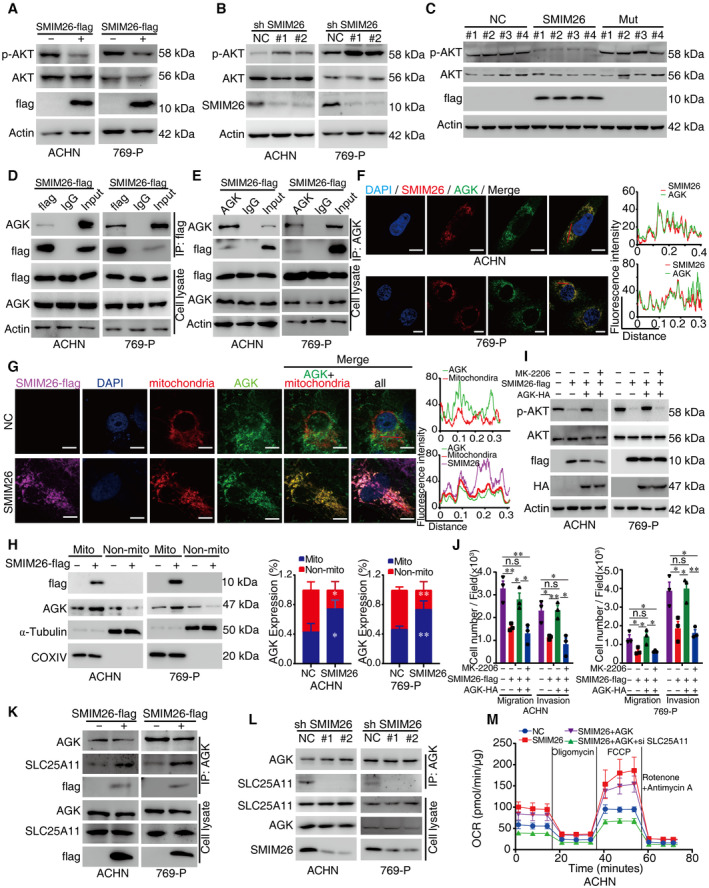
Immunoblotting validation of the p‐AKT at Ser473 expression in ACHN and 769‐P cells with overexpression (A) or knockdown (B) of SMIM26 compared with their corresponding control.
- C
Western blotting validation of the p‐AKT at Ser473 expression in xenograft tumor samples.
- D
Co‐IP assays were performed to detect the interaction between SMIM26 and AGK in ACHN and 769‐P cells expressing SMIM26‐flag. Lysates were co‐immunoprecipitated by anti‐flag antibody.
- E
Co‐IP assays were performed to detect the interaction between SMIM26 and AGK in ACHN and 769‐P cells expressing SMIM26‐flag. Lysates were co‐immunoprecipitated by anti‐AGK antibody.
- F
Subcellular localization of SMIM26 and AGK was determined by immunofluorescence in ACHN and 769‐P cells. Red, flag‐SMIM26; Green, AGK; Blue, nuclei stained with DAPI. Scale bar, 20 μm. The red line of statistical analysis centers on the co‐location of SMIM26 (red) and AGK (green).
- G
Immunofluorescence of SMIM26 (purple), AGK (green), and mitochondrial (red) in ACHN cells with or without overexpression of SMIM26. Scale bar, 10 μm. Fluorescence intensity analysis of co‐localization of AGK and mitochondria in cells treated with control or SMIM26. ImageJ software was used to analyze the fluorescence co‐localization. The red line of statistical analysis centers on the co‐location of AGK and mitochondria.
- H
Immunoblotting validation of AGK enriched in purified mitochondria from ACHN and 769‐P cells with or without the overexpression of SMIM26. Data are representative of three biological replicates. Two‐way ANOVA, *P < 0.05, **P < 0.01. Bars, SEM;
- I, J
AKT inhibitor of MK‐2206 dramatically abrogated the AGK‐mediated promotion of the phosphorylation of AKT (I) and cell migration and invasion (J). Unpaired two‐tailed Student's t‐test, *P < 0.05, **P < 0.01. n.s, non‐significant. Data are shown as mean ± SEM of three biological replicates.
- K, L
The interaction of AGK and SLC25A11 was determined by immunoblotting in ACHN and 769‐P cells with control or SMIM26 overexpressing (K), and control or SMIM26 knockdown (L).
- M
Oxygen consumption rate profile was monitored in ACHN cells with indicated treatment by using a Seahorse XF24 analyzer. The metabolic inhibitors were injected at different time points, as indicated. Data are shown as mean ± SD of three biological replicates.
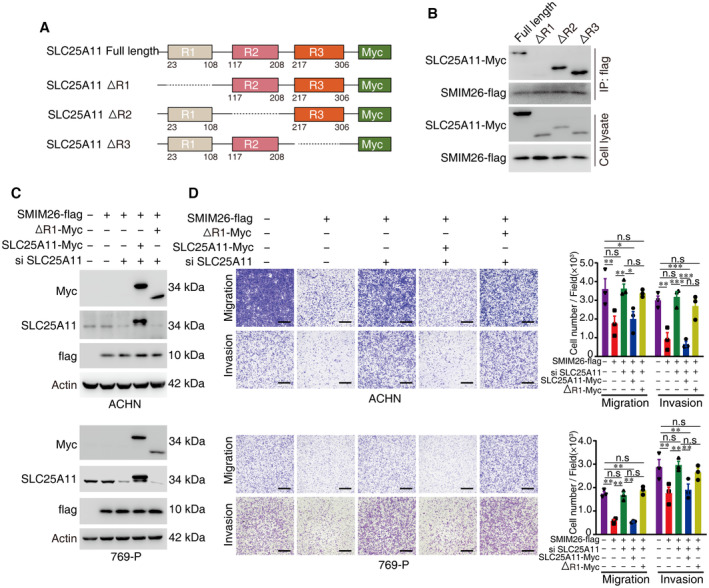
Diagram of SLC25A11 wild‐type and domain deletion mutation constructs.
The indicated Myc‐tagged wild‐type and mutants of SLC25A11 were transfected with SMIM26‐flag into HEK293T cells, and SMIM26‐flag complexes were Co‐IP by anti‐flag antibody, truncated SLC25A11 and SMIM26‐flag were then detected.
Overexpression of wild‐type and R1‐domain deleted truncated SLC25A11 with SMIM26‐flag in endogenously SLC25A11 knockdown ccRCC cells.
Overexpression of wild‐type SLC25A11 but not R1‐domain deleted SLC25A11 in endogenous SLC25A11 knockdown ccRCC cells can restore the SMIM26‐mediated inhibition of migration and invasion. Two‐way ANOVA, *P < 0.05, **P < 0.01, ***P < 0.001. n.s, non‐significant. Scale bar, 600 μm. Data are shown as mean ± SEM of three biological replicates.
- A
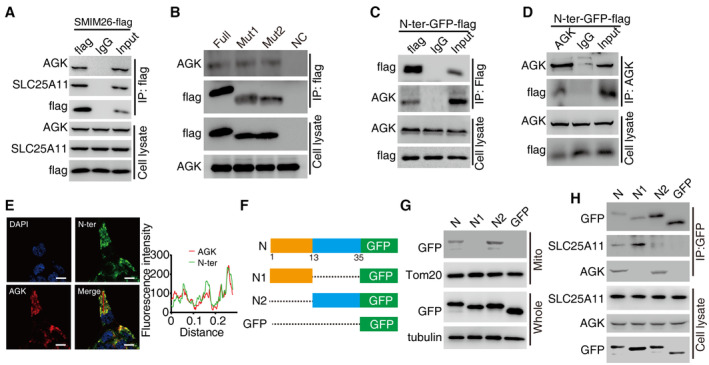
CoIP assays were used to verify the interaction between exogenous SMIM26 and endogenous AGK in xenograft tumor samples.
- B
The indicated flag‐tagged wild‐type and mutants of SMIM26 were transfected into HEK293T cells, and SMIM26‐flag complexes were Co‐IP by anti‐flag antibody, and AGK and SMIM26‐flag were then detected.
- C, D
N‐ter domain of SMIM26 fused with GFP‐flag interacted with AGK. The N‐ter SMIM26‐GFP‐flag construct was transfected into HEK293T cells, and co‐immunoprecipitation was performed by using anti‐flag antibody (C) and anti‐AGK antibody (D).
- E
Immunofluorescence of N‐ter SMIM26 (green) co‐localized with AGK (red) in ACHN cells. Nuclei were stained with DAPI (blue). Scale bar, 10 μm. The red line of statistical analysis centers on the co‐location of AGK (red) and N‐ter of SMIM26 (green).
- F
Diagram of truncated N‐ter SMIM26.
- G
CoIP assays indicated that N‐ter of SMIM26 missing transmembrane domain (N1) lost the function of interaction with AGK, but retained the ability to bind SLC25A11.
- H
Subcellular fractionation assay indicated that N‐ter of SMIM26 missing transmembrane domain (N1) lost the function of translocation to mitochondria.
- A
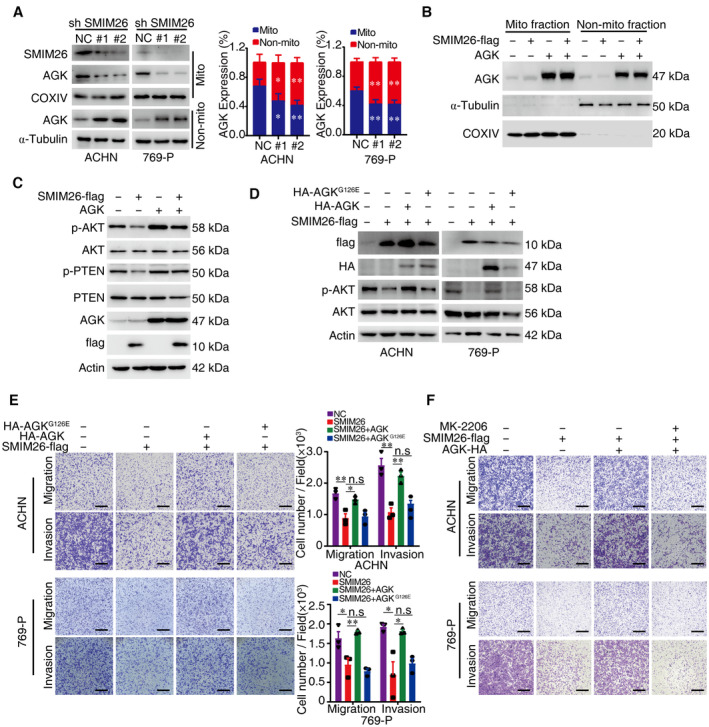
Cellular fractionation experiments showed that silencing SMIM26 noticeably decreased the expression level of mitochondrial AGK in ACHN and 769‐P cells. Data are representative of three biological replicates. Two‐way ANOVA, *P < 0.05, **P < 0.01. Bars, SEM.
- B
Overexpression of AGK increased the mitochondrial and non‐mitochondrial AGK levels in ACHN cells.
- C
Overexpression of AGK abrogated the SMIM26‐mediated suppression of the phosphorylation of PTEN at Thr382/383 and AKT at Ser473 in ACHN cells.
- D, E
AGK, but not AGKG126E, rescues the anti‐cancer effect of SMIM26. ACHN and 769‐P cells were transfected with SMIM26 and/or AGK or AGKG126E as indicated. The p‐AKT expression was determined by western blotting assay (D), and their migration and invasion abilities were detected by transwell assays (E). Two‐way ANOVA, *P < 0.05, **P < 0.01. n.s, non‐significant. Scale bar, 600 μm. Data are shown as mean ± SEM of three biological replicates.
- F
Transwell assays were used to test migration and invasion abilities of both ccRCC cells with indicated treatment. Scale bar, 600 μm.
References
-
- Buffet A, Morin A, Castro‐Vega LJ, Habarou F, Lussey‐Lepoutre C, Letouze E, Lefebvre H, Guilhem I, Haissaguerre M, Raingeard I et al (2018) Germline mutations in the mitochondrial 2‐Oxoglutarate/malate carrier SLC25A11 gene confer a predisposition to metastatic Paragangliomas. Cancer Res 78: 1914–1922 - PubMed
Publication types
MeSH terms
Substances
LinkOut - more resources
Full Text Sources
Other Literature Sources
Medical
Molecular Biology Databases
