. 2023 Jun 19;32(13):2192-2204.
doi: 10.1093/hmg/ddad048.

Pathogenic SCN2A variants cause early-stage dysfunction in patient-derived neurons

Affiliations

Pathogenic SCN2A variants cause early-stage dysfunction in patient-derived neurons

R Asadollahi et al. Hum Mol Genet. .

Abstract

Pathogenic heterozygous variants in SCN2A, which encodes the neuronal sodium channel NaV1.2, cause different types of epilepsy or intellectual disability (ID)/autism without seizures. Previous studies using mouse models or heterologous systems suggest that NaV1.2 channel gain-of-function typically causes epilepsy, whereas loss-of-function leads to ID/autism. How altered channel biophysics translate into patient neurons remains unknown. Here, we investigated iPSC-derived early-stage cortical neurons from ID patients harboring diverse pathogenic SCN2A variants [p.(Leu611Valfs*35); p.(Arg937Cys); p.(Trp1716*)] and compared them with neurons from an epileptic encephalopathy (EE) patient [p.(Glu1803Gly)] and controls. ID neurons consistently expressed lower NaV1.2 protein levels. In neurons with the frameshift variant, NaV1.2 mRNA and protein levels were reduced by ~ 50%, suggesting nonsense-mediated decay and haploinsufficiency. In other ID neurons, only protein levels were reduced implying NaV1.2 instability. Electrophysiological analysis revealed decreased sodium current density and impaired action potential (AP) firing in ID neurons, consistent with reduced NaV1.2 levels. In contrast, epilepsy neurons displayed no change in NaV1.2 levels or sodium current density, but impaired sodium channel inactivation. Single-cell transcriptomics identified dysregulation of distinct molecular pathways including inhibition of oxidative phosphorylation in neurons with SCN2A haploinsufficiency and activation of calcium signaling and neurotransmission in epilepsy neurons. Together, our patient iPSC-derived neurons reveal characteristic sodium channel dysfunction consistent with biophysical changes previously observed in heterologous systems. Additionally, our model links the channel dysfunction in ID to reduced NaV1.2 levels and uncovers impaired AP firing in early-stage neurons. The altered molecular pathways may reflect a homeostatic response to NaV1.2 dysfunction and can guide further investigations.


Figures

Figure 1
Figure 1
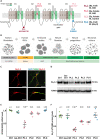
Effect of SCN2A pathogenic variants on SCN2A/NaV1.2 expression can be assessed in hiPSC-derived neurons. (A) Schematic representation of NaV1.2 channel including four repeat domains (D1–D4) each containing six membrane-spanning segments (S1–6). S4 acts as the channel’s voltage sensor and S5–S6 create the channel’s pore. Variants detected in our patients and their characteristics are shown on the right [p.(Leu611Valfs*35); p.(Arg937Cys); p.(Trp1716*); p.(Glu1803Gly)]. (B) Schematic overview of the protocol to generate hiPSC-derived neurons. Supplementary factors in the figure include ascorbic acid, cAMP, BDNF, GDNF and laminin (see Materials and Methods). (C) Immunofluorescence staining of our hiPSC-derived neurons suggesting the distribution of NaV1.2 along the neurites and a polarized expression pattern near the soma. (D) NaV1.2 protein expression in neuronal cultures of patients and controls shown by WB. (E) Quantitative RT-PCR, and (F) WB quantification showing a clear reduction of SCN2A/NaV1.2 in neurons of Pt.1 harboring the frameshift variant, and WB revealing statistically significant reduction of NaV1.2 in neurons of Pt.2 and Pt.3 compared with controls (two differentiations from two iPSC clones). Error bars represent SEM. AM-II, AmnioMAX-II; EE, epileptic encephalopathy; ID, intellectual disability; NIM, neural induction medium; Pt., patient; ULAP, ultra-low attachment plate; y, year.
Figure 2
Figure 2
SCN2A pathogenic variants differentially affect sodium currents and channel gating in 8-week-old hiPSC-derived neurons. (A). Schematic of electrophysiological experiments. hiPSC-derived neurons were analyzed after 8 weeks in culture. (B) Example image of a neuron during patch-clamp recording. (C) Example whole-cell voltage-clamp recording. Top: voltage command. Bottom: whole-cell currents recorded from a representative neuron. Inset: inward currents on enlarged time scale. (D) Sodium current density versus voltage for Ctrl, iso-Ctrl and Pts. 1–4 (color-coded). Lines are means, and the shaded area represents SEM. For comparison, control data are replotted in gray in each graph. (E) Maximum sodium current density was significantly reduced in Pts. 1–3 with ID-causing SCN2A variants (Kruskal–Wallis: χ2 (5) = 28.95, p = 2.4E−5, η2 = 0.19). Results of post hoc Dunn’s test with Bonferroni–Holm correction are indicated. (F) Voltage protocol to study Na+ channel fast inactivation and example currents from Ctrl and Pt.4. (G) Left: time constant of fast inactivation plotted versus voltage for controls and patients. Lines are means with shaded area representing ± SEM. Right: time constant of fast inactivation at 0 mV was increased in Pt.4 (Kruskal–Wallis: χ2 (5) = 21.56, p = 0.001, η2 = 0.3; results from post hoc Dunn’s test with Bonferroni–Holm correction are indicated). (H) Top: voltage protocols to probe voltage-dependence of sodium current activation and inactivation in nucleated patches from neurons. Sodium currents were isolated by blocking voltage-gated potassium and calcium channels. Bottom: normalized activation and inactivation for control and Pt.4 versus voltage. Data are means with error bars denoting SEM; lines are sigmoidal fits, and midpoints values of activation and inactivation are indicated. (I) Left: midpoint (V1/2) of activation was not significantly different between control and Pt.4. Right: V1/2 of inactivation was significantly increased in Pt.4.
Figure 3
Figure 3
SCN2A pathogenic variants differentially affect action potential firing in 8-week-old hiPSC-derived neurons. (A) Top: schematic of recordings from hiPSC-derived neurons. Middle: step current injection protocol. Bottom: Example voltages recorded from a neuron in current-clamp mode. (B) Example voltage responses to positive current injections in different patient-derived neurons. (C) Neurons from patients with ID-causing SCN2A variants fired fewer APs (Kruskal–Wallis: χ2(5) = 55.6, p = 9.84E−11, η2 = 0.37). Results of post hoc Dunn’s test with Bonferroni–Holm correction are indicated. (D) Neurons from ID patients displayed no or abortive AP firing more frequently than controls (Chi-square: χ2(15) = 62.0, p = 1.14E−7, Cramer’s V = 0.32). Results of post hoc Fisher’s exact test with Bonferroni–Holm correction are indicated. (E) UMAP plot of electrophysiological data labeled for hiPSC line (left) or using HDBSCAN clustering result (right). Control cells and EE neurons tend to cluster separately from ID neurons. (F) Effects of SCN2A variants were studied in a mouse layer 5 pyramidal cell compartmental model (see Materials and Methods). Left: shape of the reconstructed neuron based on (46). Right: action potential as well as sodium current traces. (G) Membrane voltage in response to 2.2-nA current injections (duration, 100 ms) for different levels of NaV1.2 conductance (100, 50 and 0%) and the Glu1803Gly variant (Pt.4 with a depolarizing shift of NaV1.2 inactivation). (H) Number of APs per 100-ms current injection for different levels of NaV1.2 conductance and Glu1803Gly. Reducing NaV1.2 conductance decreases neuronal excitability, whereas the Glu1803Gly variant has little effect.
Figure 4
Figure 4
Expression profile of MAP2-positive cells in 8-week-old neuronal cultures discriminates between patients and controls. (A) t-SNE plot of MAP2 expression in neuronal cultures from patients (Pts. 1–4, from one iPSC clone each), KDM3B+/ mutant (from one iPSC clone), isogenic line and controls (Ctrl from two iPSC clones, C01 and C02). Each dot represents a cell in the neuronal culture, and shades of color correspond to the expression level of the neuronal marker, MAP2, present in 65–85% of the cells showing the predominant cell type in the neuronal cultures. (B) Pseudobulk heatmap of the most variable 2000 genes in the MAP2-positive cells of neuronal cultures from patients and controls. Threshold for standard deviation of log2 signal across samples was 1.09. Discriminative clustering of SCN2A patients, controls and KDM3B+/ mutant samples is evident.
Figure 5
Figure 5
Significant differentially expressed genes (DEGs) render to distinguishing signaling pathways (activated and inhibited) in mutant hiPSC-derived neurons. (A) Number of DEGs versus each control (error bars represent SEM) and (B) percentage of DEGs consistently observed versus all controls (see Materials and Methods) with adjusted (a) P-value < 0.05 in neurons of SCN2A-patients and the KDM3B+/ mutant. (C) Heatmap table of significantly affected pathways (inhibited or activated) in neurons of Pts. 1–4 and the KDM3B+/ mutant, and the corresponding z-score calculated by IPA. Notably, synaptogenesis, calcium and synaptic LTP signaling pathways were specifically activated in epilepsy patient neurons.

References

    1. Hu, W., Tian, C., Li, T., Yang, M., Hou, H. and Shu, Y. (2009) Distinct contributions of Nav1.6 and Nav1.2 in action potential initiation and backpropagation. Nat. Neurosci., 12, 996–1002. - PubMed
    1. Martínez-Hernández, J., Ballesteros-Merino, C., Fernández-Alacid, L., Nicolau, J.C., Aguado, C. and Luján, R. (2013) Polarised localisation of the voltage-gated Sodium Channel Nav1.2 in cerebellar granule cells. Cerebellum, 12, 16–26. - PubMed
    1. Vacher, H., Mohapatra, D.P. and Trimmer, J.S. (2008) Localization and targeting of voltage-dependent ion channels in mammalian central neurons. Physiol. Rev., 88, 1407–1447. - PMC - PubMed
    1. Sanders, S.J., Campbell, A.J., Cottrell, J.R., Moller, R.S., Wagner, F.F., Auldridge, A.L., Bernier, R.A., Catterall, W.A., Chung, W.K., Empfield, J.R. et al. (2018) Progress in understanding and treating SCN2A-mediated disorders. Trends Neurosci., 41, 442–456. - PMC - PubMed
    1. Spratt, P.W.E., Ben-Shalom, R., Keeshen, C.M., Burke, K.J., Clarkson, R.L., Sanders, S.J. and Bender, K.J. (2019) The autism-associated gene Scn2a contributes to dendritic excitability and synaptic function in the prefrontal cortex. Neuron, 103, 673–685.e5. - PMC - PubMed

Publication types

MeSH terms