. 2023 May 1;155(5):e202213212.
doi: 10.1085/jgp.202213212. Epub 2023 Apr 3.

Depolarization-induced bursts of miniature synaptic currents in individual synapses of developing cerebellum

Affiliations

Depolarization-induced bursts of miniature synaptic currents in individual synapses of developing cerebellum

Bastien Le Guellec et al. J Gen Physiol. .

Abstract

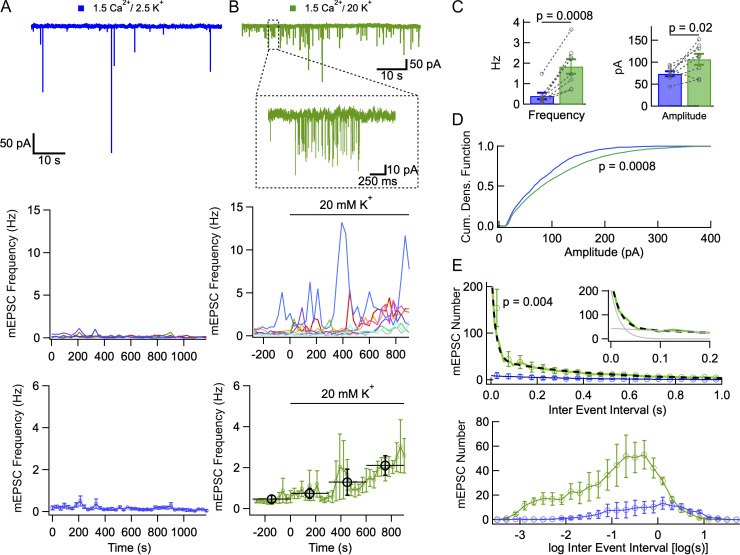
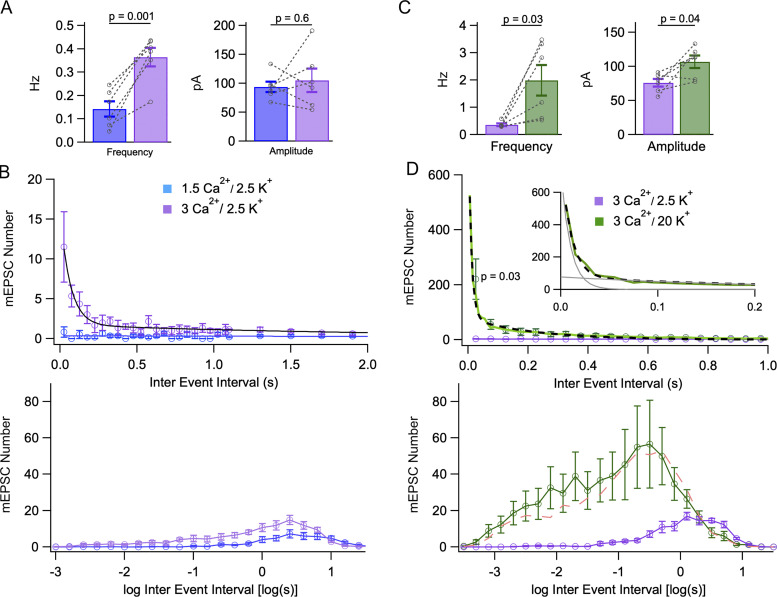
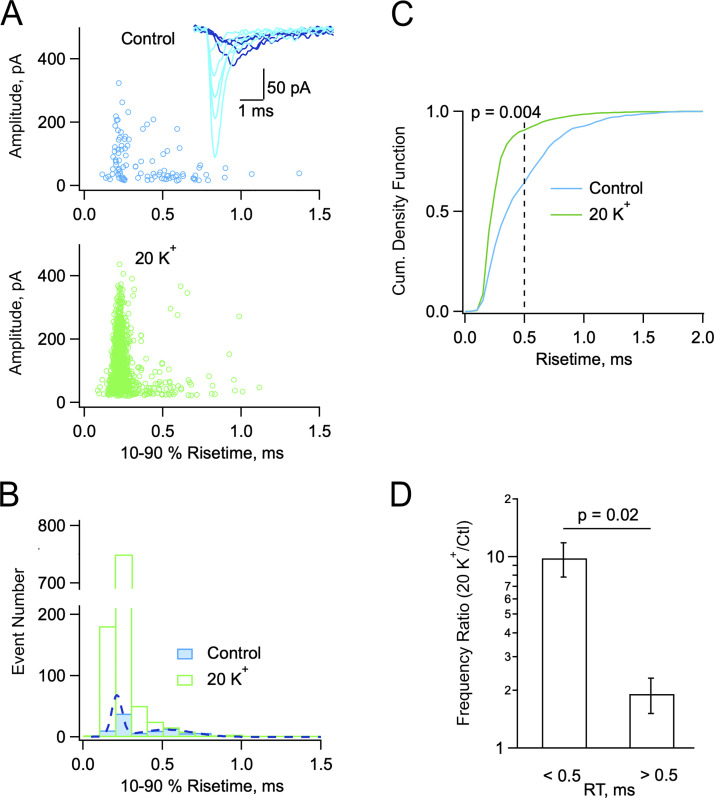
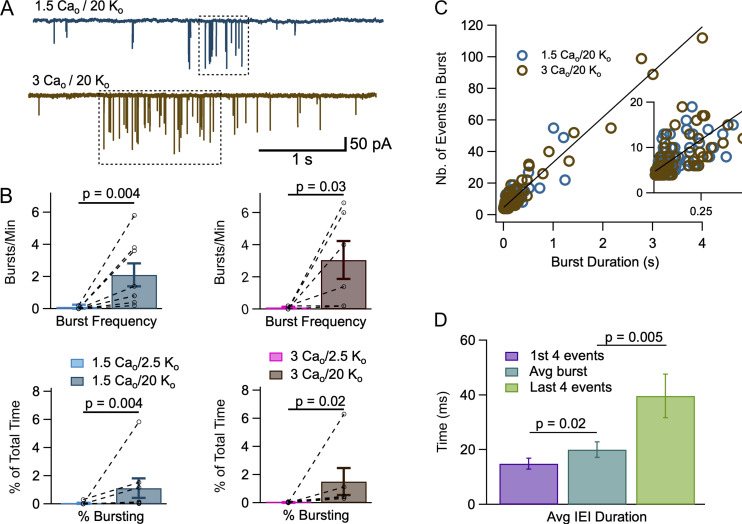
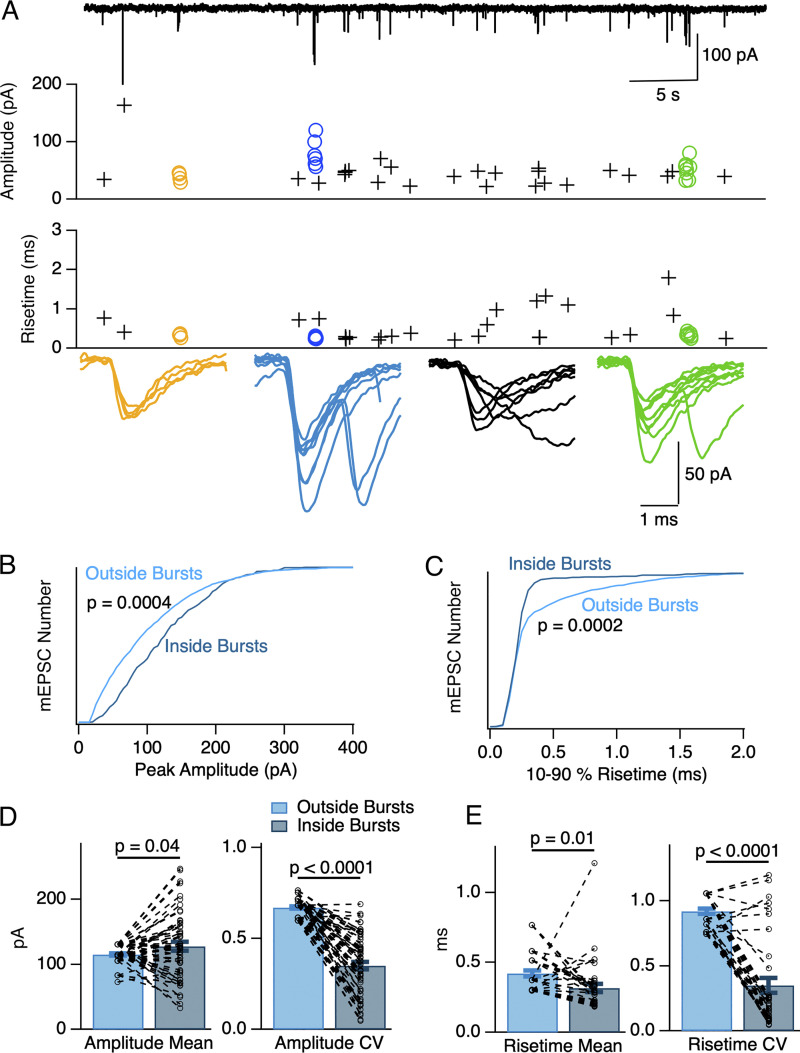
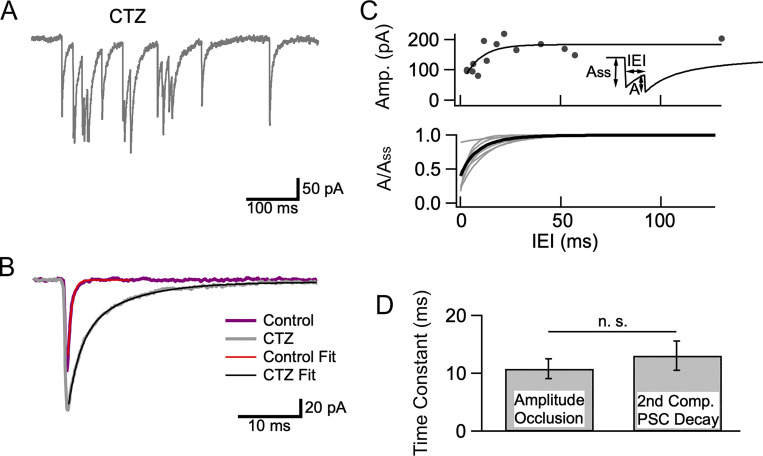
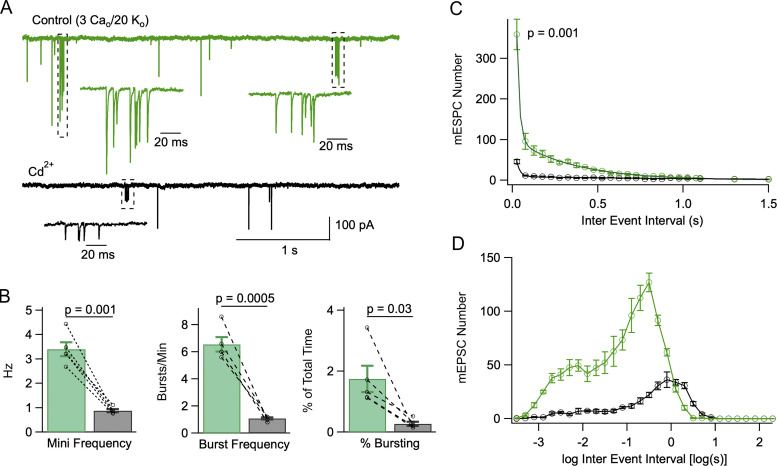
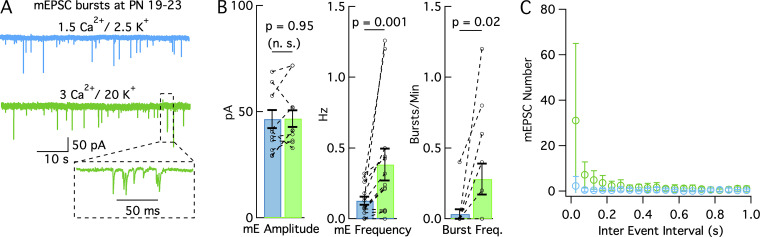
In central synapses, spontaneous transmitter release observed in the absence of action potential firing is often considered as a random process lacking time or space specificity. However, when studying miniature glutamatergic currents at cerebellar synapses between parallel fibers and molecular layer interneurons, we found that these currents were sometimes organized in bursts of events occurring at high frequency (about 30 Hz). Bursts displayed homogeneous quantal size amplitudes. Furthermore, in the presence of the desensitization inhibitor cyclothiazide, successive events within a burst displayed quantal amplitude occlusion. Based on these findings, we conclude that bursts originate in individual synapses. Bursts were enhanced by increasing either the external potassium concentration or the external calcium concentration, and they were strongly inhibited when blocking voltage-gated calcium channels by cadmium. Bursts were prevalent in elevated potassium concentration during the formation of the molecular layer but were infrequent later in development. Since postsynaptic AMPA receptors are largely calcium permeant in developing parallel fiber-interneuron synapses, we propose that bursts involve presynaptic calcium transients implicating presynaptic voltage-gated calcium channels, together with postsynaptic calcium transients implicating postsynaptic AMPA receptors. These simultaneous pre- and postsynaptic calcium transients may contribute to the formation and/or stabilization of synaptic connections.


Conflict of interest statement

Disclosures: The authors declare no competing interests exist.

Figures

Figure 1.
Figure 1.
Increasing the external K+ concentration elicits mEPSC bursts. (A) mEPSCs under control conditions (1.5 mM Cao, 2.5 mM Ko saline, containing tetrodotoxin, gabazine, and APV). Upper: Example trace. Middle: mEPSC frequency remains small and stable over a period of 20 min (time bins: 30 s duration). Lower: Mean mEPSC frequency ± SEM, over 30 s long time bins. (B) Effect of elevating Ko. Upper: Example trace in 20 mM Ko, with individual mEPSC burst enlarged. Middle: mEPSC frequency shows large, slow fluctuations in individual recordings, and large cell-to-cell variability. Time 0 marks the transition to the higher Ko. Lower: Plotting mean mEPSC frequency as a function of time (error bars: ± SEM) reveals a slow increase in the higher Ko solution (green: 30 s bins; black: 5 min bins). (C) Summary plots comparing mEPSC frequencies and amplitudes in 2.5 mM Ko (blue) and 10–15 min after switching to 20 mM Ko (green). (D) Cumulative amplitude distributions for 2.5 mM Ko and 20 mM Ko, showing a stronger contribution of large amplitude events in 20 mM Ko. (E) IEI histograms in 2.5 mM Ko and in 20 mM Ko. Histograms reflect 5 min long data taken either in control saline (blue), or 10–15 min after switching to 20 mM Ko (green). The upper plot uses linear coordinates. Circles and associated error bars are calculated for 50 ms bins. For 20 mM Ko data, data are displayed with 10 ms resolution up to 100 ms to highlight the initial part of the histogram (green trace). In 2.5 mM Ko, the interval distribution displays a single exponential component (blue trace) with initial amplitude 9 events/50 ms bin and time constant 370 ms. In 20 mM Ko, IEI distribution is fitted with a double exponential (black dots), where the fast component has an amplitude of 204 events/50 ms bin and a time constant of 18 ms, and the slow component has an amplitude of 44 events/50 ms bin and a time constant of 393 ms (inset: fit of the initial part of the histogram with fast and slow exponential components in gray). The lower plot shows the same data with logarithmic abscissa (bins: 0.2 log unit). P values indicate paired t tests for cell data in C, Kolmogorov-Smirnov test in D, and Wilcoxon signed-rank test for first 50 ms bin in E. Dotted lines link individual cell data together in C. Number of independent experiments: n = 4 cells from 2 animals in A; n = 8 cells from 4 animals in B–E.
Figure 2.
Figure 2.
Effects of external Ca2+ concentration on mEPSC bursts. (A) Summary data showing a significant mean mEPSC frequency increase and no significant mean amplitude change when increasing Cao from 1.5 to 3 mM. (B) Increasing Cao from 1.5 to 3 mM elicits bursting. Upper: IEI distributions shift from monoexponential in control conditions (1.5 mM Cao, blue; circles: experimental; continuous line: exponential fit with initial amplitude 0.34 event/bin, and time constant 8.5 s) to biexponential 10–15 min after shifting to 3 mM Cao (purple; fast component: amplitude 14 events/bin, time constant 66 ms; slow component: amplitude 1.7 event/bin, time constant 2.4 s). Bin durations are 50 ms up to 1.1 s, and 200 ms (with appropriate ordinate scaling) thereafter. Lower: Same data presented with logarithmic abscissa axis (bins: 0.2 log units). (C) Summary data showing a significant mean mEPSC frequency increase and a significant mean amplitude increase when raising Ko from 2.5 to 20 mM (3 mM Cao in both solutions). (D) Analysis of bursts elicited by elevating Ko, starting with 3 mM Cao. IEI histograms are displayed in linear (upper graph, with 50 ms bins) and logarithmic (lower graph, with 0.2 log unit bins) coordinates. Upper: In 20 mM Ko, the distribution follows a biexponential curve (black dots) with a fast component (amplitude 725 events/50 ms bin, time constant 10 ms) and a slow component (amplitude 78 events/50 ms bin, time constant 220 ms). Histogram resolution is enhanced to 10 ms/bin in the 0–100 ms range to better document the fast component (green line). Inset: fit of the initial part of the histogram with fast and slow exponential components in gray. Lower: The 3 Cao/20 Ko distribution (green) is clearly distinct from the 3 Cao/2.5 Ko distribution over a wide range of interval durations (purple), but it is not significantly different from the 1.5 Cao/20 Ko distribution (dashed red, from Fig. 1). Results are shown as mean ± SEM for n = 6 experiments from 4 animals comparing 1.5 Cao and 3 mM Cao (A and B), and n = 6 other experiments from 5 animals comparing 3 Cao/2.5 Ko with 3 Cao/20 Ko (C and D). P values indicate the results of paired t tests for cell data in A and C, and of Wilcoxon signed-rank test for first 50 ms bin in D. Dotted lines link individual cell data together in A and C.
Figure 3.
Figure 3.
mEPSCs display two populations with differential sensitivities to Ko. (A and B) Exemplar experiment illustrating two groups of mEPSCs in control (blue: 2 Cao/2.5 Ko) and in high Ko (green: 2 Cao/20 Ko). (A) Plot of peak amplitude versus 10–90% risetime for individual mEPSCs in control (above) and in 20 Ko (below; 300 s recording duration in each case). Insert: Superimposed representative mEPSCs in control (light blue: fast rising; deep blue: slow rising). (B) Corresponding risetime histograms with double Gaussian fit to the control data (dots). (C) Cumulative risetime histograms from a group of five cells as in A and B. The control histrogram displays a major component with risetimes <0.5 ms and a minor component with risetimes >0.5 ms. In elevated Ko the weight of the <0.5 ms component is greatly enhanced (P = 0.004, Kolmogorov-Smirnov test). (D) Comparison of frequency ratios (20 Ko vs. control) for the two mEPSCs components (P = 0.02, paired t test). Number of independent experiments: n = 5 from 4 animals (C and D), one of which is illustrated in A and B.
Figure 4.
Figure 4.
Individual mEPSC bursts in high Ko. (A) Individual mEPSC bursts (dotted boxes) were identified as explained in Materials and methods in recordings obtained in 1.5 Cao/20 Ko (upper trace) and in 3 Cao/20 Ko (lower trace). (B) Comparison of burst frequency (number of bursts per minute: upper panels) and burst occurrence (the percentage of recording time when a burst was observed: lower panel) in 2.5 Ko and in 20 Ko solutions (left: 1.5 Cao; right: 3 Cao). Dashed lines link results of individual experiments together. (C) A plot of the number of mEPSCs inside a burst as a function of burst duration (blue: 1.5 Cao/20 Ko; brown: 3 Cao/20 Ko) reveals a linear relationship. The slope of the regression line corresponds to an intraburst mEPSC frequency of 28.6 Hz. It intersects the ordinate axis at an initial value of 4.6 events. The relation shown is for all blue and brown points; separate regression lines for blue and brown points were almost identical to the line shown. (D) Comparison of mEPSC IEIs for the first four events in a burst (purple), for the entire burst (blue), and for the last four events in a burst (green). Mean values between the three groups are significantly different, showing a gradual frequency adaptation during a burst. P values represent the results of Wilcoxon signed-rank tests in B, and of paired t tests in D. Number of independent experiments: n = 8 cells from 6 animals in B, left; n = 6 cells from 5 animals in B, right; n = 14 bursts from 7 cells taken from 6 animals in D.
Figure 5.
Figure 5.
Different mEPSC characteristics inside and outside bursts. (A) A 50 s long recording in 1.5 Cao/20 Ko (upper trace) containing three bursts (yellow, blue, and green symbols). Within each burst, mEPSCs display homogeneous peak amplitude values (upper plot) as well as homogeneous and low risetime values (lower plot). Superimposed synchronized mEPSCs are shown below for each burst. In contrast to mEPSCs inside bursts, mEPSCs outside bursts display variable peak amplitude and risetime values (crosses). A plot of seven superimposed consecutive mEPSCs (black) occurring between the blue and the green burst is shown in addition to the burst traces. (B and C) Normalized cumulative histograms from six cells as in A showing larger peak amplitudes for mEPSCs inside bursts compared to mEPSCs outside bursts (P = 0.0004, B), and faster mEPSC risetimes for mEPSCs inside bursts compared to mEPSCs outside bursts (P = 0.0002, C; Kolmogorov-Smirnov test). (D and E) Individual burst analysis of the same data. D, left: mEPSCs inside bursts (dark blue) had on average a higher peak amplitude than mEPSCs outside bursts (light blue; paired t test: P = 0.04). Dotted lines link together results for individual bursts to corresponding non-bursting events data in the same recording. D, right: mEPSCs inside bursts have a lower peak amplitude CV than mEPSCs outside bursts (paired t test: P = 2 × 10⁻²¹). E, left: mEPSCs inside bursts had on average a lower 10–90% risetime than mEPSCs outside bursts (paired t test: P = 0.01). E, right: mEPSCs inside bursts have a lower risetime CV than mEPSCs outside bursts (paired t test: P = 1 × 10⁻¹¹). Number of independent experiments: n = 6 cells from 5 animals in B–E.
Figure 6.
Figure 6.
mEPSC amplitude occlusion in CTZ. (A) Example of a burst recorded in 3 Cao/20 Ko in the presence of CTZ (100 μM). (B) Superimposed average recordings of mEPSCs under control condition (purple; time constant of decay 0.6 ms) and after addition of CTZ (gray) showing slower, biphasic decay in CTZ (fast component time constant 1.9 ms; slow component time constant 8.0 ms; % slow component 53%). (C) Upper: Amplitude occlusion analysis (A as a function of IEI, see insert) for a burst in CTZ, showing a drop of peak amplitudes at short IEIs. An exponential fit to the data describes the recovery kinetics of mEPSC amplitudes. Extrapolation of this exponential to an interval duration of 0 provides an estimate of 75% receptor occupancy at mEPSC peak, while the time constant of recovery is 8.5 ms. Lower: Fits of normalized A(IEI) plots as in the upper plot for seven bursts (gray), with average in black. (D) Similarity between the kinetics of receptor deactivation (given by the time constant of the second component of mEPSC decay; n = 13 mEPSCs from 5 recordings) and those of amplitude occlusion recovery (n = 7 bursts from 6 recordings) indicates that mEPSC occlusion is driven by receptor deactivation.
Figure 7.
Figure 7.
Cd2+ blocks mEPSC bursts. (A) A recording in control solution (3 Cao/20 Ko) displaying two bursts (green; dotted areas and expanded traces below), and after addition of 100 μM Cd2+ (black trace, containing one burst). (B) Summary data showing that Cd2+ reduces overall mEPSC frequency (left), burst frequency (center), and percentage time of bursting (right). (C and D) Comparison of IEI histograms in linear (C; bin size: 50 ms) and logarithmic (D; bin size: 0.2 log unit) coordinates before and after addition of 100 μM Cd2+ (n = 5 cells). P values represent the results of paired t tests for mEPSC frequency, burst frequency, and percent bursting time in Cd2+ vs. control in B, and that of a paired-test comparison between the first 50 ms bin of IEI histograms in Cd2+ vs. control (C). Data obtained from n = 5 cells from 4 animals.
Figure 8.
Figure 8.
mEPSC bursts are infrequent at PN 19–23 d. mEPSCs were examined in control conditions and in elevated K0/Ca0 at PN 19–23 d instead of PN 13–16 d. (A) Example recordings in 1.5 Ca0/2.5 K0 solution (blue) and in 3 Ca0/20 K0 solution (green) from the same cell obtained from a 19-d-old rat. During total recording times of 3 min in each solution, no burst was obtained in control, and a single burst was obtained in 3 Ca0/20 K0 solution (inset). (B) Peak mEPSC amplitude (left), mEPSC frequency (center), and mEPSC burst frequency (right) in the two solutions (blue: 1.5 Ca0/2.5 K0; green: 3 Ca0/20 K0). P values represent the results of paired t test for mEPSC amplitudes (left), and of Wilcoxon signed-rank test for mEPSC frequency and burst frequency (center and right). (C) Inter-event histograms in 1.5 Ca0/2.5 K0 solution (blue) and in 3 Ca0/20 K0 solution (green; data normalized to a recording duration of 300 s as in Figs. 1, 2, and 7). The fast time constant component of the 3 Ca0/20 K0 histogram at PN 19–23 d has a small mean amplitude and a high variability compared with corresponding PN 13–16 d data (Figs. 1, 2, and 7). Data are from n = 12 cells from 5 animals in B left, and from n = 13 cells from 5 animals in B center/right and in C.

References

    1. Abenavoli, A., Forti L., Bossi M., Bergamaschi A., Villa A., and Malgaroli A.. 2002. Multimodal quantal release at individual hippocampal synapses: Evidence for no lateral inhibition. J. Neurosci. 22:6336–6346. 10.1523/JNEUROSCI.22-15-06336.2002 - DOI - PMC - PubMed
    1. Abrahamsson, T., Cathala L., Matsui K., Shigemoto R., and Digregorio D.A.. 2012. Thin dendrites of cerebellar interneurons confer sublinear synaptic integration and a gradient of short-term plasticity. Neuron. 73:1159–1172. 10.1016/j.neuron.2012.01.027 - DOI - PubMed
    1. Altman, J. 1972. Postnatal development of the cerebellar cortex in the rat, I, II, III. J. Comp. Neurol. 145:353–514. 10.1002/cne.901450305 - DOI - PubMed
    1. Andreae, L.C., and Burrone J.. 2018. The role of spontaneous neurotransmission in synapse and circuit development. J. Neurosci. Res. 96:354–359. 10.1002/jnr.24154 - DOI - PMC - PubMed
    1. Auger, C., and Marty A.. 1997. Heterogeneity of functional synaptic parameters among single release sites. Neuron. 19:139–150. 10.1016/S0896-6273(00)80354-2 - DOI - PubMed

Publication types

MeSH terms