. 2023 Aug;35(8):e14589.
doi: 10.1111/nmo.14589. Epub 2023 Apr 3.

Paracrine relationship between incretin hormones and endogenous 5-hydroxytryptamine in the small and large intestine

Affiliations

Paracrine relationship between incretin hormones and endogenous 5-hydroxytryptamine in the small and large intestine

Iain R Tough et al. Neurogastroenterol Motil. 2023 Aug.

Abstract

Background: Enterochromaffin (EC) cell-derived 5-hydroxytryptamine (5-HT) is a mediator of toxin-induced reflexes, initiating emesis via vagal and central 5-HT3 receptors. The amine is also involved in gastrointestinal (GI) reflexes that are prosecretory and promotile, and recently 5-HT's roles in chemosensation in the distal bowel have been described. We set out to establish the efficacy of 5-HT signaling, local 5-HT levels and pharmacology in discrete regions of the mouse small and large intestine. We also investigated the inter-relationships between incretin hormones, glucagon-like peptide-1 (GLP-1) and gastric inhibitory polypeptide (GIP) and endogenous 5-HT in mucosal and motility assays.

Methods: Adult mouse GI mucosae were mounted in Ussing chambers and area-specific studies were performed to establish the 5-HT3 and 5-HT4 pharmacology, the sidedness of responses, and the inter-relationships between incretins and endogenous 5-HT. Natural fecal pellet transit in vitro and full-length GI transit in vivo were also measured.

Key results: We observed the greatest level of tonic and exogenous 5-HT-induced ion transport and highest levels of 5-HT in ascending colon mucosa. Here both 5-HT3 and 5-HT4 receptors were involved but elsewhere in the GI tract epithelial basolateral 5-HT4 receptors mediate 5-HT's prosecretory effect. Exendin-4 and GIP induced 5-HT release in the ascending colon, while L cell-derived PYY also contributed to GIP mucosal effects in the descending colon. Both peptides slowed colonic transit.

Conclusions & inferences: We provide functional evidence for paracrine interplay between 5-HT, GLP-1 and GIP, particularly in the colonic mucosal region. Basolateral epithelial 5-HT4 receptors mediated both 5-HT and incretin mucosal responses in healthy colon.

Keywords: 5-hydroxytryptamine; enterochromaffin cells; gastric inhibitory polypeptide; glucagon-like peptide-1; motility; mucosal ion transport.


Conflict of interest statement

The authors declare that they have no competing interests.

Figures

FIGURE 1
FIGURE 1
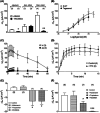
Mucosal 5‐HT responses and 5‐HT4 tonic activities in different areas of the mouse GI tract. 5‐HT (1 μM) responses after vehicle (DMSO, 0.01%) or 5‐HT4 antagonist (RS39604, 1 μM) addition to mucosa from, in (A) different GI regions and, in (B) the ascending colon where a combination of RS39604 and the 5‐HT3 antagonist, tropisetron (Trop, 100 nM) or tetrodotoxin (TTX, 100 nM) were added prior to 5‐HT. In (C) the effect of RS39604 (1 μM) or vehicle alone on basal I sc levels reveals significant tonic 5‐HT4 activity in 4 of the 5 GI areas. (D) TTX pretreatment reveals sensitivity of tropisetron, but not RS39604 tonic inhibition of basal I sc levels in ascending colon. Significant differences compared with respective controls are shown as: *p < 0.05, **p < 0.01, ***p < 0.001 using Student's t‐test (in A, C and D) or one‐way ANOVA with Dunnett's post‐test (in B). Bars are the mean ± 1 SEM from n = 5–6, as shown.
FIGURE 2
FIGURE 2
Tegaserod responses in three different GI regions (A) and 5‐HT pharmacology in mouse descending colon mucosa (B–F). In (A) tegaserod (1 μM) responses are inhibited by 5‐HT4 antagonist RS39406 (1 μM) in jejunum and descending colon, but not the ascending colon. In (B) concentration‐response relationships for basolateral 5‐HT or tegaserod in descending colon mucosa. In (C) time‐course comparison of basolateral (bl) versus apical (ap) 5‐HT (1 μM, added at t = 0 min) responses, in (D) basolateral 5‐HT responses are TTX (100 nM) insensitive. In (E) the effects of different 5‐HT receptor antagonists (each at 1 μM) on basal I sc in descending colon mucosa are shown, and in (F) subsequent 5‐HT (1 μM) responses. Bars are the mean ± 1 SEM from n numbers shown in parenthesis. Significant differences compared with respective controls (*p < 0.05, **p < 0.01, ***p < 0.001) utilized Student's t‐test (A–D) or one‐way ANOVA with Dunnett's post‐test (in E and F).
FIGURE 3
FIGURE 3
Expression of GLP1R and GIPR in EC cells (in A–D) and peptide‐induced 5‐HT release (in E–H). In situ hybridization for GLP1R (A and C) or GIP‐R (B and D) and TPH1 expression in proximal small intestine (A and B) and colon (C and D) mucosae. Blue arrows indicate TPH1 positive EC cells and red arrows indicate peptide receptor‐positive EC cells. Co‐localisation is observed in both GI regions for TPH1 and GLP1R (A and C), as well as between TPH1 and the GIPR in the colon (in D), but not between TPH1 and GIPR in the proximal small intestine (in B). Scale bars: 30 μm. Real‐time amperometric measurement of 5‐HT release from ex vivo duodenum (E and G) and ascending (proximal) colon (F and H) stimulated with GLP‐1 agonist: exendin‐4 (Ex4) (E, F) or hGIP (G, H) at the concentrations shown. Bars are the mean + 1SEM (n = 4 throughout) and statistical differences; *p < 0.05, **p < 0.01, ***p < 0.001 using repeated measures 2‐way ANOVA with Tukey's post‐test.
FIGURE 4
FIGURE 4
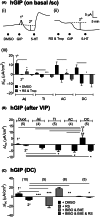
5‐HT content (A), tonic activities (B) and subsequent exendin‐4 responses in different regions of the mouse GI tract (C). In (A) mucosal 5‐HT levels were established using HPLC‐ECD. Values are the mean + 1SEM (n = 4). Duod, duodenum; Jej, jejunum; Ile, ileum; Caec, caecum; AC, ascending colon; and DC, descending colon. In (B), tonic 5‐HT3 and 5‐HT4 activity revealed using a combination of 5‐HT3 and 5‐HT4 antagonists (1 μM RS39406 and 100 nM tropisetron: RS & Trop) added basolaterally. In (C), subsequent exendin‐4 (Ex 4, 100 nM) responses were partially inhibited by RS and Trop. Bars are the mean ± 1 SEM, from numbers in parenthesis. Significant differences compared to vehicle controls (0.1% DMSO) are shown (*p < 0.05, ***p < 0.001) using Student's t‐test.
FIGURE 5
FIGURE 5
Mucosal hGIP signaling under basal (A) and VIP‐stimulated (B and C) conditions. In (A) example traces showing biphasic hGIP (100 nM) responses in (i) vehicle‐treated colon mucosa and, (ii) following 5‐HT antagonists (RS39604, 1 μM) and tropisetron (100 nM, RS & Trop) in ascending colon mucosa. In (iii) pooled data showing the 1° and 2° components of the hGIP I sc response in different GI regions (jejunum [Jej], terminal ileum [TI], ascending colon [AC] and descending colon [DC]) and their sensitivity to RS & Trop (n = 6). In (B), hGIP responses (100 nM) after pretreatment with the secretagogue, VIP (10 nM) were biphasic (1° and 2° components) in different GI regions, particularly so in descending colon (DC). In (C), the descending colon hGIP 1° response is abolished by 1 μM RS39406 (+RS) while the hGIP 2° response is PYY‐Y1 and Y2‐mediated (abolished by 300 nM BIBO3304 and 1 μM BIIE0246; + BIBO & BIIE). All three blockers RS39406, BIBO3304 and BIIE0246 (+ BIBO & BIIE & RS) abolished the biphasic hGIP response. Bars are the mean ± 1 SEM, and significant differences compared with vehicle (0.1% DMSO) controls are shown (*p < 0.05, ***p < 0.001; used Student's t‐test here). In B and C (where n numbers are shown in parenthesis) significant differences compared to respective controls are shown (*p < 0.05, **p < 0.01, ***p < 0.001) using one‐way ANOVA with Dunnett's post‐test.
FIGURE 6
FIGURE 6
Natural fecal pellet transit in WT (in A) and PYY−/− (in B–D) colons in vitro. In A and B similar sensitivities to 5‐HT or the 5‐HT4 antagonist RS39604 (at concentrations shown) increase or decrease motility, respectively. In (C), the effects of vehicle (controls) or exendin‐4 (+Ex4, 100 nM), hGIP (+GIP, 100 nM), the GLP‐1 blocker exendin (9–39) (+9–39, 1 μM) alone or with the 5‐HT3 and 5‐HT4 antagonists (1 μM RS39604 and 100 nM tropisetron: +Trop&RS) on transit over a 20 min period. In D (note the different y axis), the anti‐motile effects over a 40 min period to Ex4 or hGIP (alone, at the same concentrations used in C) or after Ex (9–39) alone (+9–39) or with tropisetron and RS39604. Each bar is the mean + 1 SEM from n numbers shown in parenthesis. Statistical differences from vehicle controls are as shown (*p < 0.05, **p < 0.01; ***p < 0.001) using one‐way ANOVA with Dunnett's post‐test.
FIGURE 7
FIGURE 7
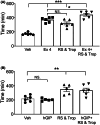
Total GI tract transit time is enhanced by GLP‐1R activation or by 5‐HT3 and 5‐HT4 blockers, but is unchanged by hGIP. Oral administration of carmine red enabled full‐length GI transit time to be measured after i.p. injection of GLP‐1R (Ex‐4, in A) or GIPR agonist (hGIP, in B). In (A), exendin‐4 (Ex‐4: 3 μg/kg), or hGIP (in B, at 30 μg/kg), or the combination of 5‐HT3 antagonist, tropisetron (Trop: 1 mg/kg i.p.) and 5‐HT4 antagonist, RS39604 (300 μg/kg i.p.) were administered ± either peptide. Bars are the means ±1 SEM from n = 6 mice throughout. NS. denotes non‐significance, while statistical differences are shown as; *p < 0.05, **p < 0.01, ***p < 0.001 (using 1 way ANOVA with Tukey's post‐test).
FIGURE 8
FIGURE 8
A schematic showing local 5‐HT, GLP‐1 and circulating GIP signaling in mouse colonic mucosa. Responses mediated via enterochromaffin (EC) cell 5‐HT, and L cell derived peptides, PYY and GLP‐1 are summarized. PYY (in green) and GLP‐1 (blue) mechanisms with GIP (black) and their respective receptors (blocked by selective antagonists, as shown). The I sc changes we observed result predominantly from changes in epithelial electrogenic Cl secretion, mediated primarily via cAMP‐sensitive CFTR located on apical membranes (orange barrels). Modulation of submucosal neuron activities are included as indicated by our functional studies.

References

    1. Gershon MD. 5‐Hydroxytryptamine (serotonin) in the gastrointestinal tract. Curr Opin Endocrinol Diabetes Obes. 2013;20:14‐21. - PMC - PubMed
    1. Sundler F, Ekblad E, Hakanson R. Localisation and colocalization of gastrointestinal peptides. Handb Exp Pharmacol. 1993;106:1‐28.
    1. Koo A, Fothergill LJ, Kuramoto H, Furness JB. 5‐HT containing enteroendocrine cells characterised by morphologies, patterns of hormone co‐expression and relationships with nerve fibres in the mouse gastrointestinal tract. Histochem Cell Biol. 2021;155:623‐636. - PubMed
    1. Mawe GM, Hoffman JM. Serotonin signalling in the gut – functions, dysfunctions and therapeutic targets. Nat Rev Gastroenterol Hepatol. 2013;10:473‐486. - PMC - PubMed
    1. Gwynne RM, Bornstein JC. Luminal 5‐HT4 receptors – a successful target for prokinetic actions. Neurogastroenterol Motil. 2019;31:e13708. - PubMed

Publication types