. 2023 Jun 2;22(6):1734-1746.
doi: 10.1021/acs.jproteome.2c00780. Epub 2023 Apr 3.

High-Throughput Venomics

Affiliations

High-Throughput Venomics

Julien Slagboom et al. J Proteome Res. .

Abstract

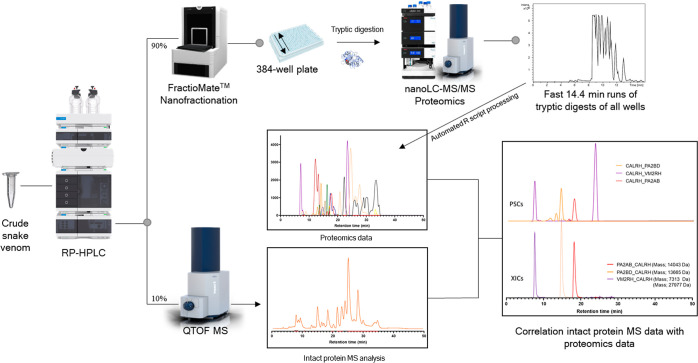
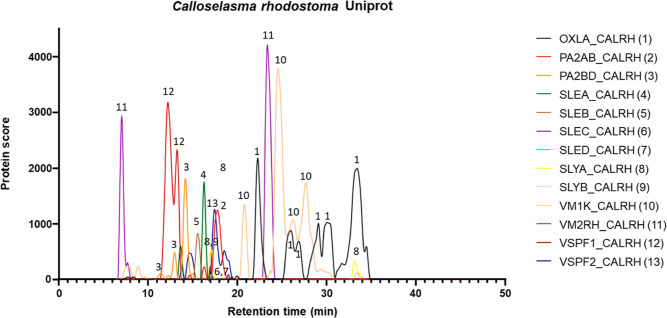
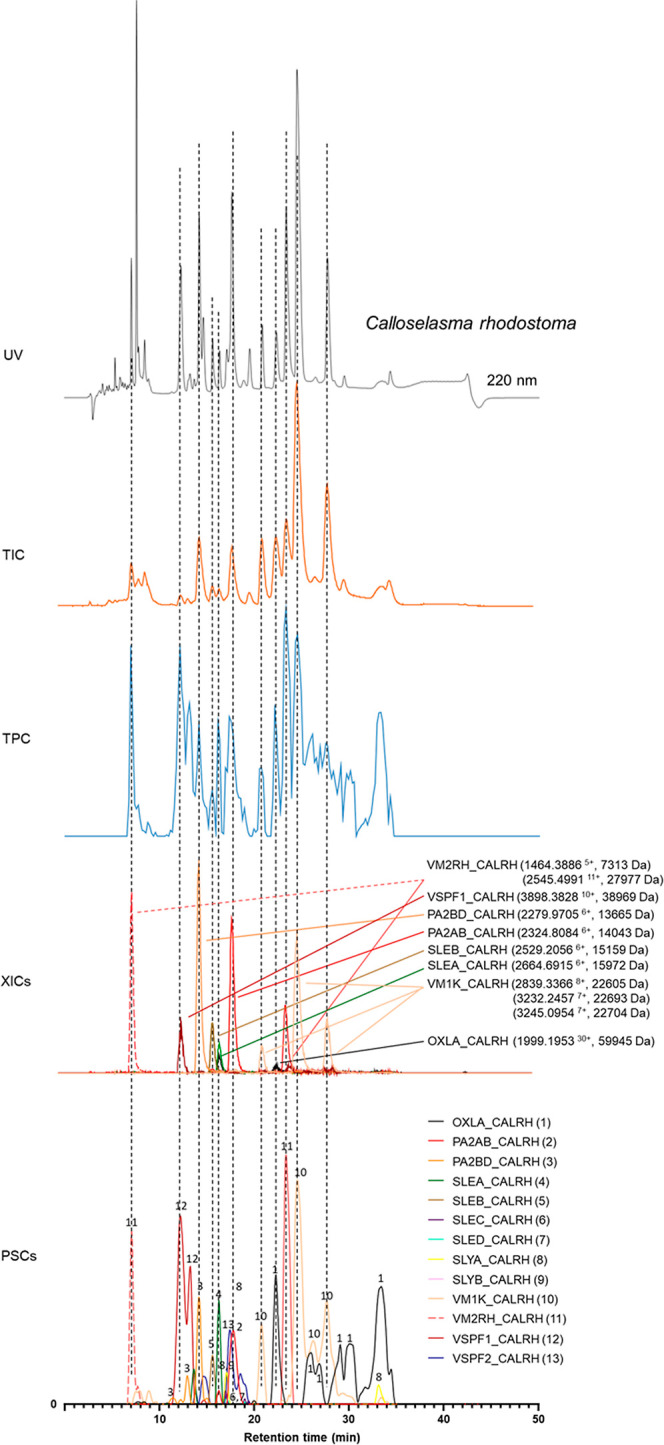
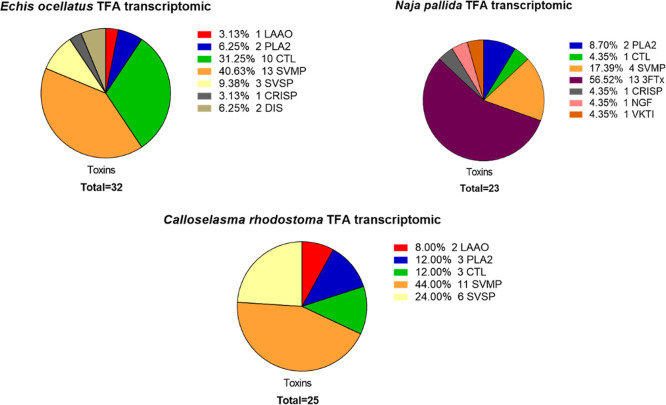
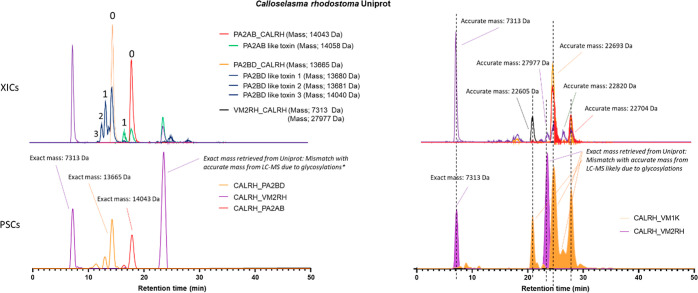
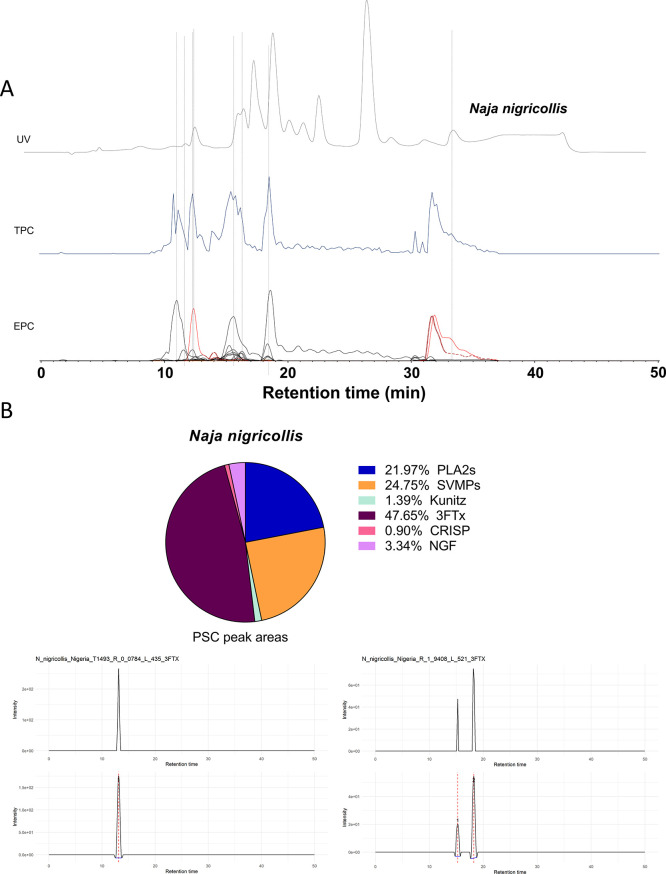
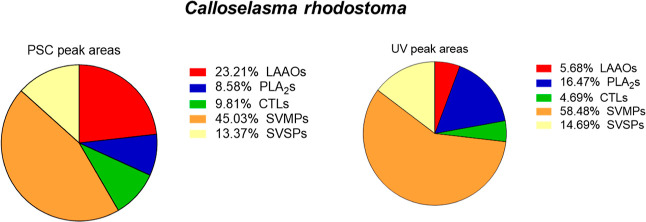
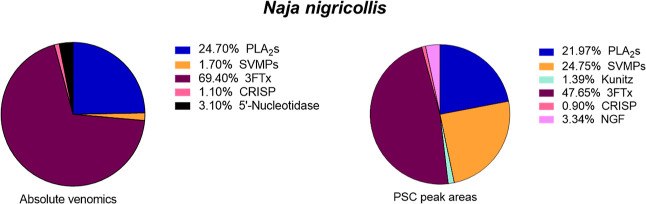
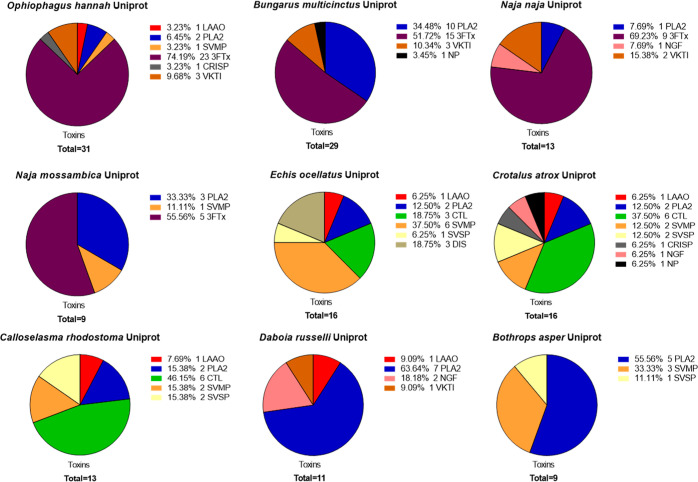
In this study, we present high-throughput (HT) venomics, a novel analytical strategy capable of performing a full proteomic analysis of a snake venom within 3 days. This methodology comprises a combination of RP-HPLC-nanofractionation analytics, mass spectrometry analysis, automated in-solution tryptic digestion, and high-throughput proteomics. In-house written scripts were developed to process all the obtained proteomics data by first compiling all Mascot search results for a single venom into a single Excel sheet. Then, a second script plots each of the identified toxins in so-called Protein Score Chromatograms (PSCs). For this, for each toxin, identified protein scores are plotted on the y-axis versus retention times of adjacent series of wells in which a toxin was fractionated on the x-axis. These PSCs allow correlation with parallel acquired intact toxin MS data. This same script integrates the PSC peaks from these chromatograms for semiquantitation purposes. This new HT venomics strategy was performed on venoms from diverse medically important biting species; Calloselasma rhodostoma, Echis ocellatus, Naja pallida, Bothrops asper, Bungarus multicinctus, Crotalus atrox, Daboia russelii, Naja naja, Naja nigricollis, Naja mossambica, and Ophiophagus hannah. Our data suggest that high-throughput venomics represents a valuable new analytical tool for increasing the throughput by which we can define venom variation and should greatly aid in the future development of new snakebite treatments by defining toxin composition.

Keywords: RP-HPLC; fractionation; high-throughput; high-throughput proteomics; mass spectrometry; proteomics; venomics; venoms.


Conflict of interest statement

The authors declare no competing financial interest.

Figures

Figure 1
Figure 1
Graphical overview of the high-throughput venomics workflow. First, snake venom was subjected to nanofractionation analytics, which involves liquid chromatographic separation of venom toxins followed by a flow split of 10% to mass spectrometry (MS) for intact toxin analysis and 90% to parallel high-resolution fractionation of the separated venom toxins on to a 384-well plate. After vacuum-centrifugation of the well plate to evaporate the eluents, a tryptic digestion procedure is performed directly on the well plate using automated pipetting steps. The well plate is then directly transferred to nanoLC–MS/MS for analysis using a fast-analytical gradient runtime of 14.4 min, resulting in 100 measurements per day. The proteomics data obtained are then automatically subjected to Mascot database searching using Mascot Daemon. Next, using in-house written R scripts, all Mascot data are compiled into a single Excel sheet in which information on toxins identified is sorted by fractionation time (i.e., retention time of elution for each toxin; all toxins have eluted over a series of subsequent wells during the high-resolution fractionation). From there, for each identified toxin, a script plots so-called Protein Score Chromatograms (PSCs), in which protein scores are plotted on the y-axis versus retention times of adjacent series of wells in which a toxin was fractionated on the x-axis. The peaks in all PSCs were subsequently integrated to yield semiquantitation results on the toxins in a venom under study. Finally, the obtained venomics and intact MS data could be correlated for additional toxin characterization.
Figure 2
Figure 2
PSCs of the Calloselasma rhodostoma venom. The protein scores from each of the toxin IDs obtained with Mascot database searching are plotted against the retention time from the wells they were detected in. Each of the individual toxin traces is numbered with its corresponding protein identifier on the right. This results in so-called PSCs, which can, for example, be used as a method for the identification of venom toxins through different detection methods.
Figure 3
Figure 3
LC–UV-MS-PSC data superimposed from Calloselasma rhodostoma venom. The data for C. rhodostoma venom from the three detection techniques used in this study were superimposed to obtain a comprehensive figure that facilitates the identification of venom toxins. The top graph shows the UV (220 nm) trace. The second graph shows the total ion chromatogram (TIC) from the mass spectrometry data. The middle trace shows the total protein chromatogram (TPC) consisting of the sum of all protein scores obtained from the proteomics data. The penultimate graph shows the extracted ion chromatograms (XICs) obtained from the mass spectrometry data. The XICs shown here are believed to match to the toxin IDs found in the bottom graph (PSCs) based on their matching retention times and peak shapes. The bottom graph shows the PSCs, which represent the individual venom proteins found with the Mascot database searching of the digested contents in the wells.
Figure 4
Figure 4
Pie charts showing the number of toxins identified and their respective toxin families when using the transcriptomic databases for venom sourced from Calloselasma rhodostoma, Echis ocellatus, and Naja pallida.
Figure 5
Figure 5
Detection of multiple PSC peaks from Calloselasma rhodostoma venom corresponding to a single protein accession. Bottom Graphs (C,D) show PSCs of venom toxins PA2BD (Phospholipase A2), PA2AB (PLA2), and VM2RH (snake venom metalloproteinase). Upper graphs (A,B) show XICs and their accurate masses correlating to the PSCs. In graph C, toxin VM2RH shows two peaks of which one corresponds to the disintegrin rhodostomin from which the exact mass can be exactly matched to an accurate mass in the MS (graph A), contrary to its SVMP rhodostoxin from which the exact mass cannot be determined due to its exact glycosylations being unknown. In graph C, toxin PA2BD displays three peaks of which the largest peak can be exactly correlated to the correct accurate mass (0) in graph A. The other PSC peaks corresponding to toxin PA2BD correlate to other accurate masses (1,2,3) shown in graph A. This could be due to PTMs or sequence similarities in different toxins present that are not yet known in the database and therefore are recognized to their closest homologue (PA2BD). In graph C toxin PA2AB displays two peaks from which the largest peak can be exactly correlated to the correct accurate mass (0) in graph A. The other PSC peak corresponding to toxin PA2AB correlates to the other accurate mass (1) shown in graph A. This could be due to PTMs or sequence similarities in the other toxin present that is not yet known in the database and therefore is recognized to its closest homologue (PA2AB). Graph D shows PSCs from SVMPs VM2RH and VM1K with multiple peaks. The two VM2RH peaks can be explained by one that corresponds to its disintegrin rhodostomin and the other to the SVMP rhodostoxin. For VM1K, there are multiple peaks present that correlate to different accurate masses, which are most likely different toxins with sequence similarities but are not yet known in the database and therefore are recognized to their closest homologue (VM1K).
Figure 6
Figure 6
Proteomics analysis and venom composition analysis by PSC peak integration of Naja nigricollis. (A) Superimposed data of UV, TPC, and EPC data from the Naja nigricollis venom used to correlate UV observed peaks to toxins identified by proteomics. (B) Pie chart of the venom composition of Naja nigricollis based on the PSC peak areas of the identified proteins and their respective toxin families. In addition, two examples of PSC peak integration are shown to illustrate the integration process of the script.
Figure 7
Figure 7
Comparison PSC peak areas and UV peak areas as means for semiquantitation for the venom composition of Calloselasma rhodostoma. The two pie charts show the venom composition based on the integrated PSC and UV peak areas and for each of the found proteins and their respective toxin classes. Comparable results were obtained for both methods regarding the SVSPs (snake venom serine protease) and SVMPs, while more deviation was observed for the LAAOS, PLA2s, and CTLs (C-type lectins).
Figure 8
Figure 8
Comparison of the venom compositions of Naja nigricollis obtained absolute venomics and high-throughput venomics approaches. The two pie charts show the venom composition based on the absolute venomics from Calderón-Celis et al. (2017) and the integrated PSC peak areas for each of the found proteins and their respective toxin classes from this study. Comparable results were obtained for both methods regarding the PLA2s and CRISPs, while more deviation was observed for the 3FTx’s and SVMPs.
Figure 9
Figure 9
Pie charts of venom composition derived from medically relevant snake species obtained through high-throughput venomics analysis. After the proteomics data are obtained and processed into PSCs, as described in the Materials and Methods, the number of toxins and their respective toxin families were compiled into summary pie charts. The proteomics results obtained through the Uniprot database were used rather than the transcriptomic databases due to the absence of transcriptomic databases for several snake species. In addition, the results of Naja nigricollis and Naja pallida are not shown here due to a limited number of toxins present in the Uniprot database (two and three, respectively; though see Supporting Information document 1 Section 7 for details).

References

    1. Slagboom J.; Kool J.; Harrison R. A.; Casewell N. R. Haemotoxic snake venoms: their functional activity, impact on snakebite victims and pharmaceutical promise. British journal of haematology 2017, 177, 947–959. 10.1111/bjh.14591. - DOI - PMC - PubMed
    1. Harrison R. A.; Gutiérrez J. M. Priority Actions and Progress to Substantially and Sustainably Reduce the Mortality, Morbidity and Socioeconomic Burden of Tropical Snakebite. Toxins 2016, 8, 351.10.3390/toxins8120351. - DOI - PMC - PubMed
    1. Harrison R. A.; Cook D. A.; Renjifo C.; Casewell N. R.; Currier R. B.; Wagstaff S. C. Research strategies to improve snakebite treatment: challenges and progress. Journal of proteomics 2011, 74, 1768–1780. 10.1016/j.jprot.2011.06.019. - DOI - PubMed
    1. Warrell D. A. Snake bite. The lancet 2010, 375, 77–88. 10.1016/s0140-6736(09)61754-2. - DOI - PubMed
    1. Dart R. C.; Seifert S. A.; Boyer L. V.; Clark R. F.; Hall E.; McKinney P.; McNally J.; Kitchens C. S.; Curry S. C.; Bogdan G. M.; et al. A randomized multicenter trial of crotalinae polyvalent immune Fab (ovine) antivenom for the treatment for crotaline snakebite in the United States. Archives of internal medicine 2001, 161, 2030–2036. 10.1001/archinte.161.16.2030. - DOI - PubMed

Publication types