. 2023 Jul 7;13(7):1636-1655.
doi: 10.1158/2159-8290.CD-22-1175.

Type I Interferon Signaling via the EGR2 Transcriptional Regulator Potentiates CAR T Cell-Intrinsic Dysfunction

Affiliations

Type I Interferon Signaling via the EGR2 Transcriptional Regulator Potentiates CAR T Cell-Intrinsic Dysfunction

In-Young Jung et al. Cancer Discov. .

Abstract

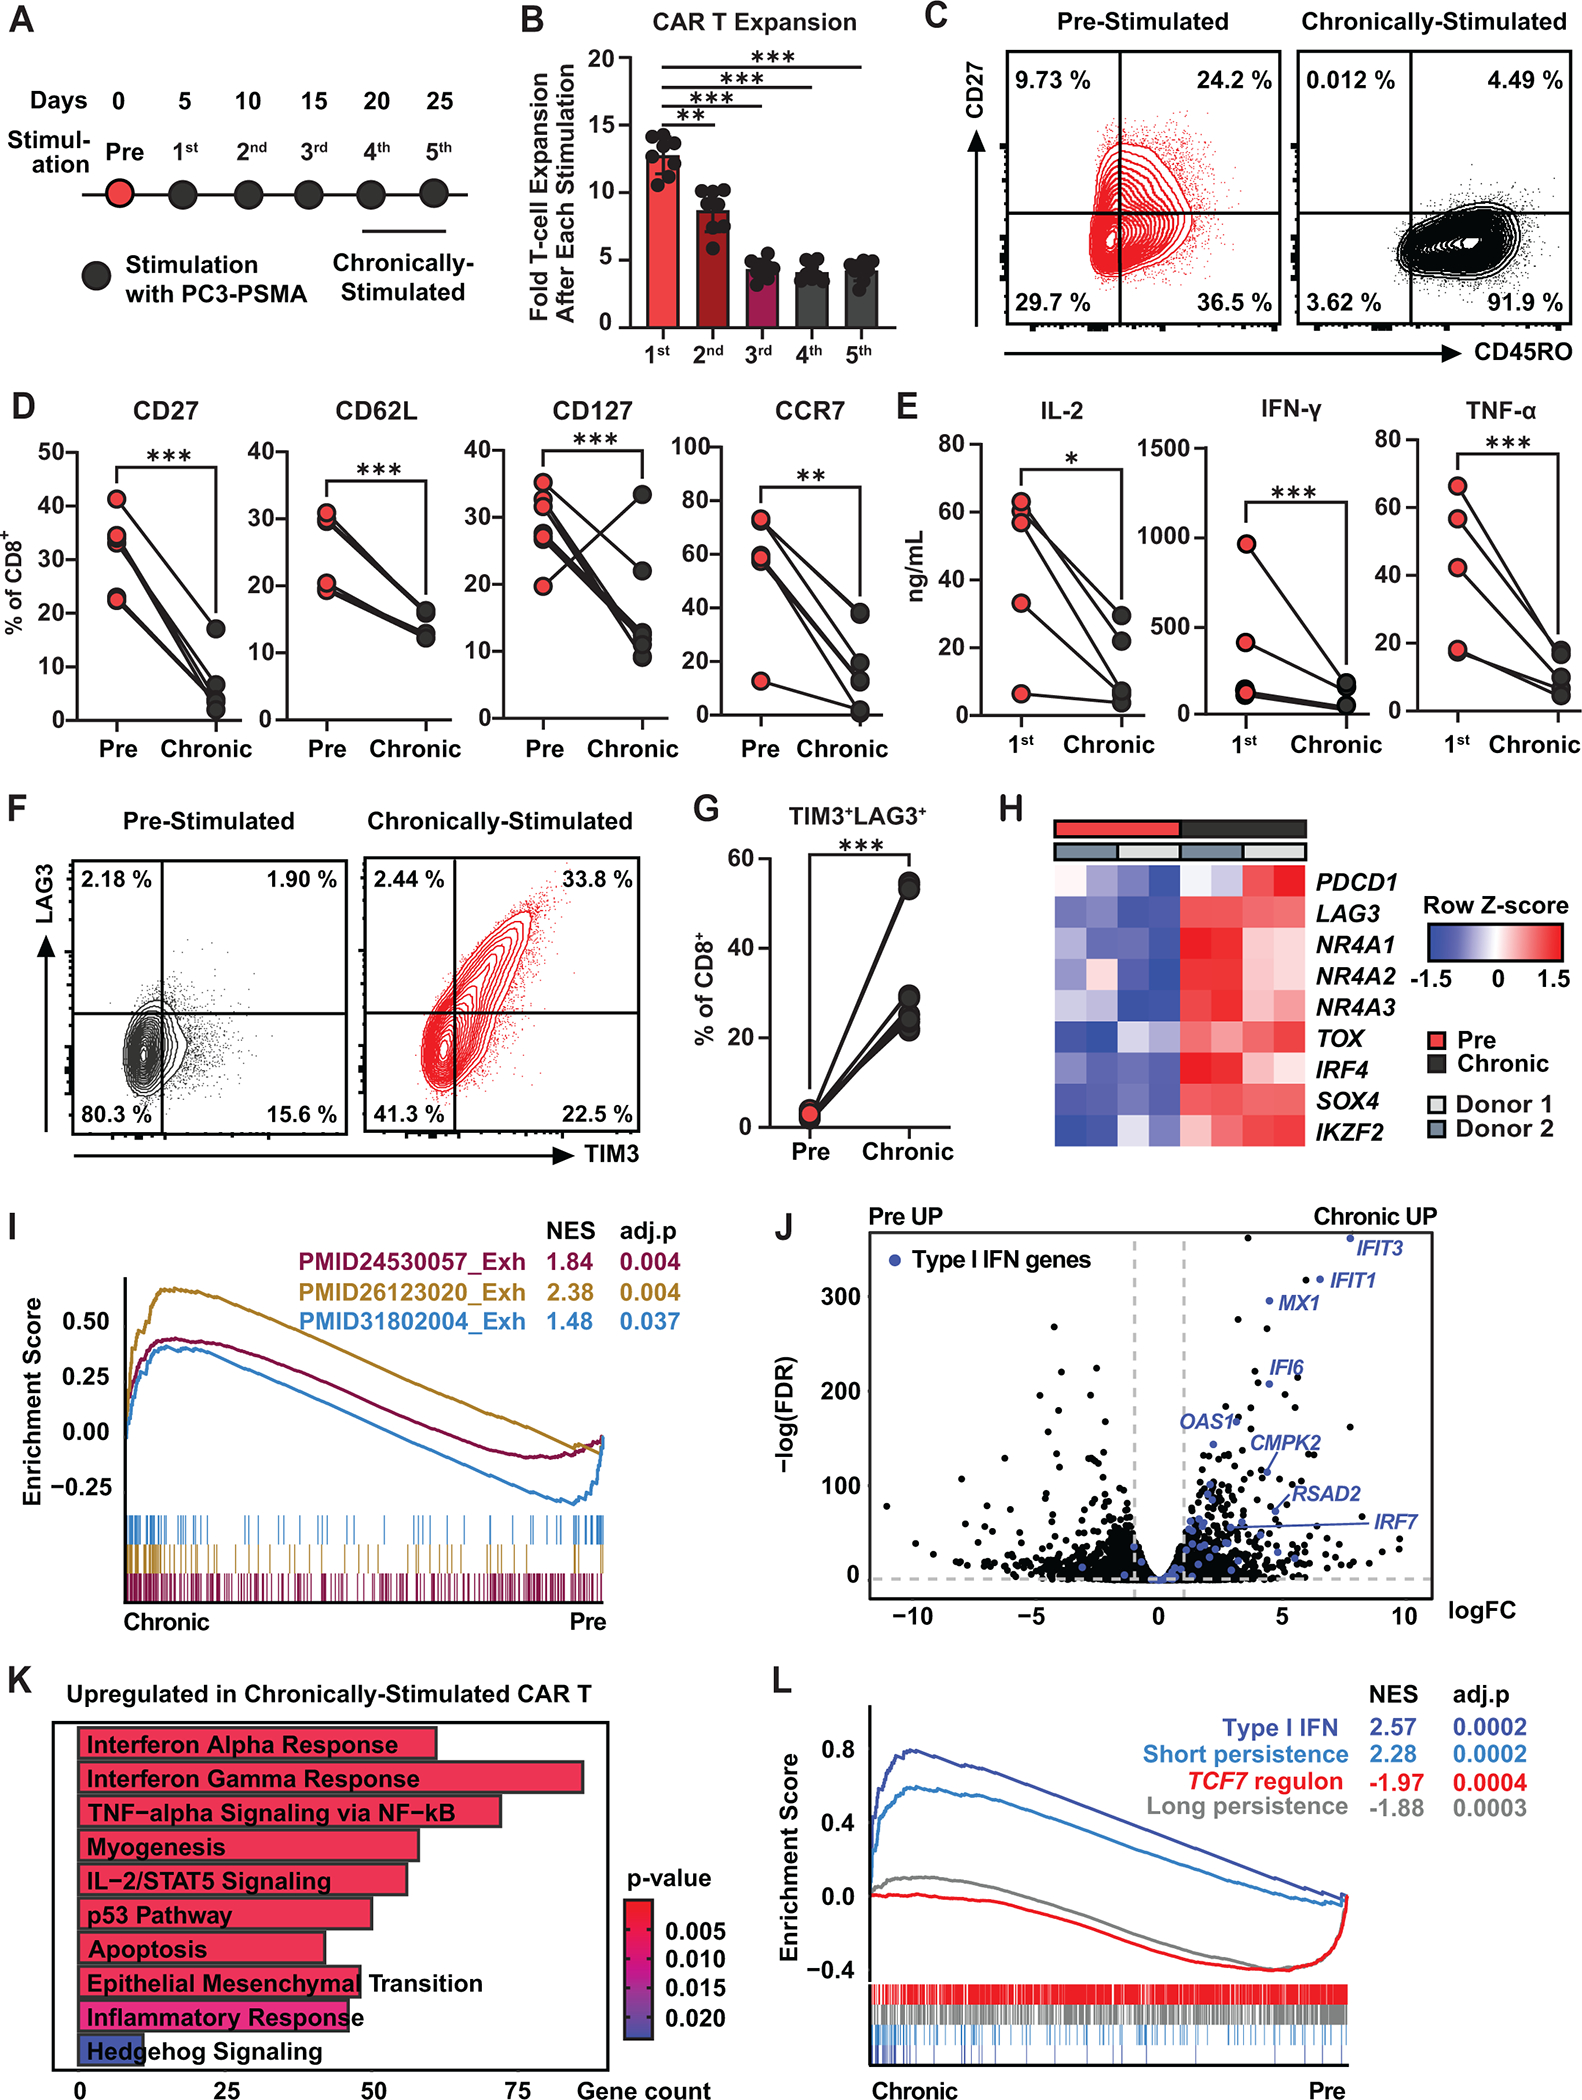
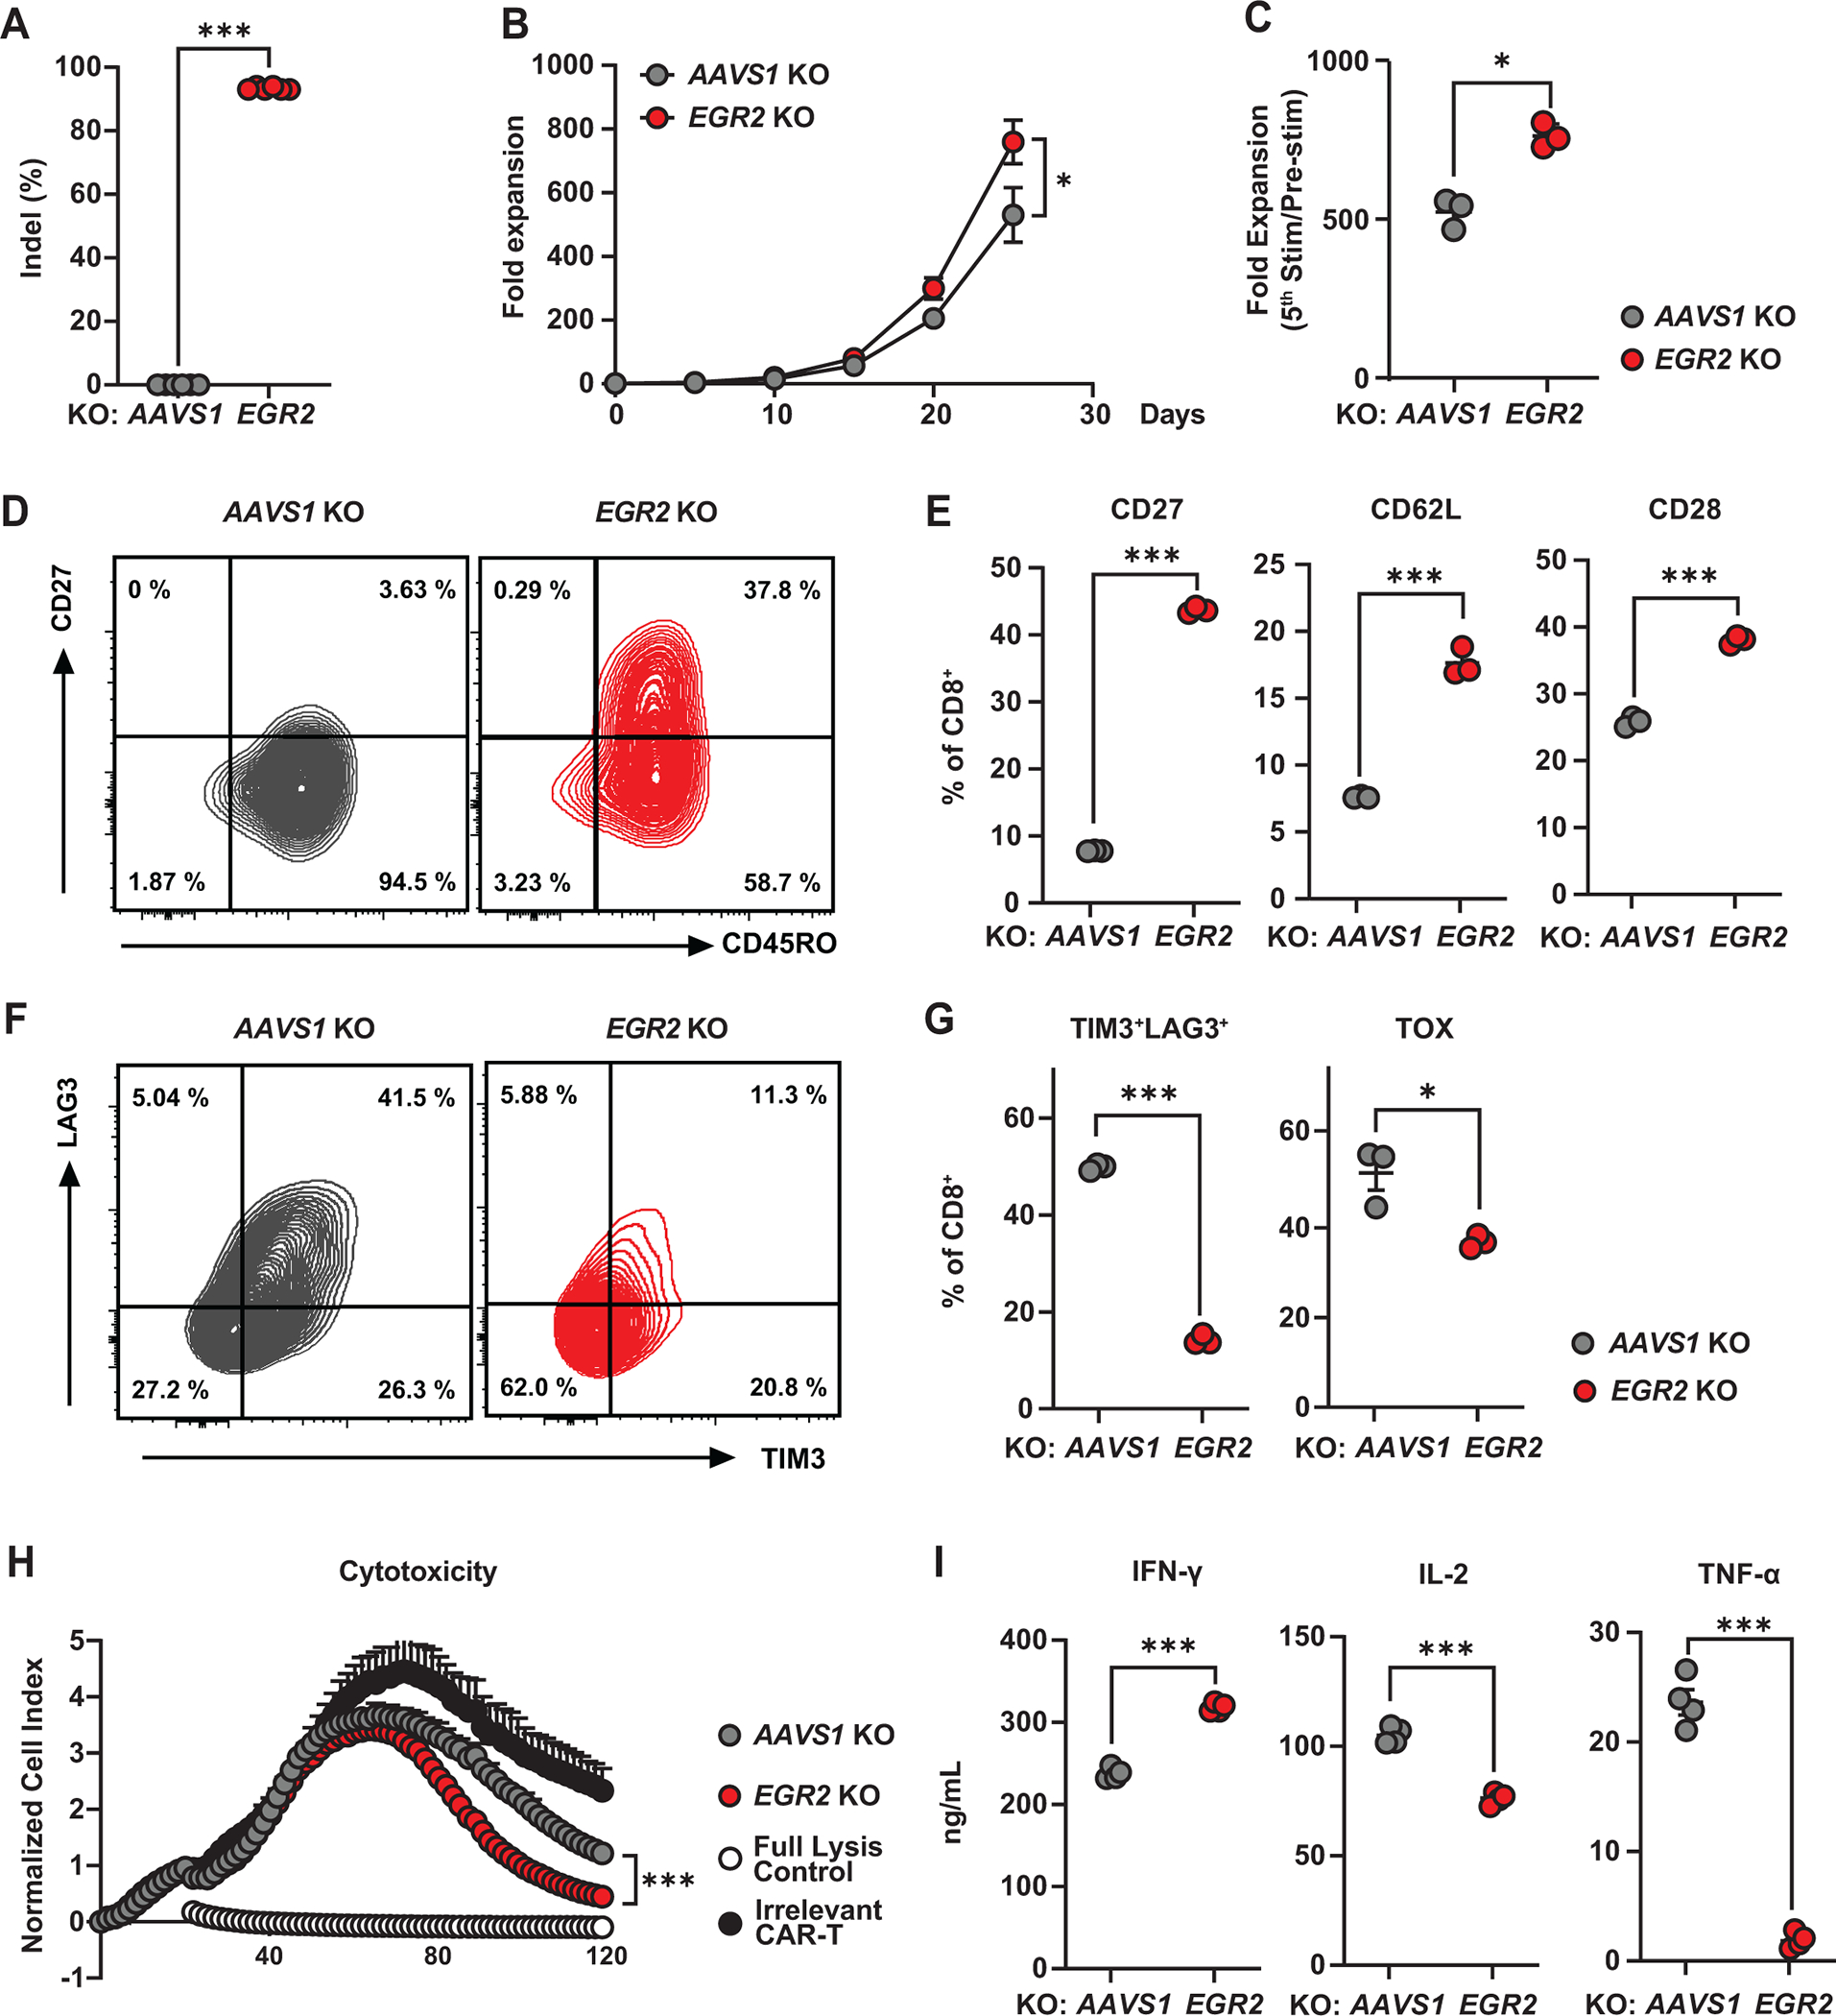
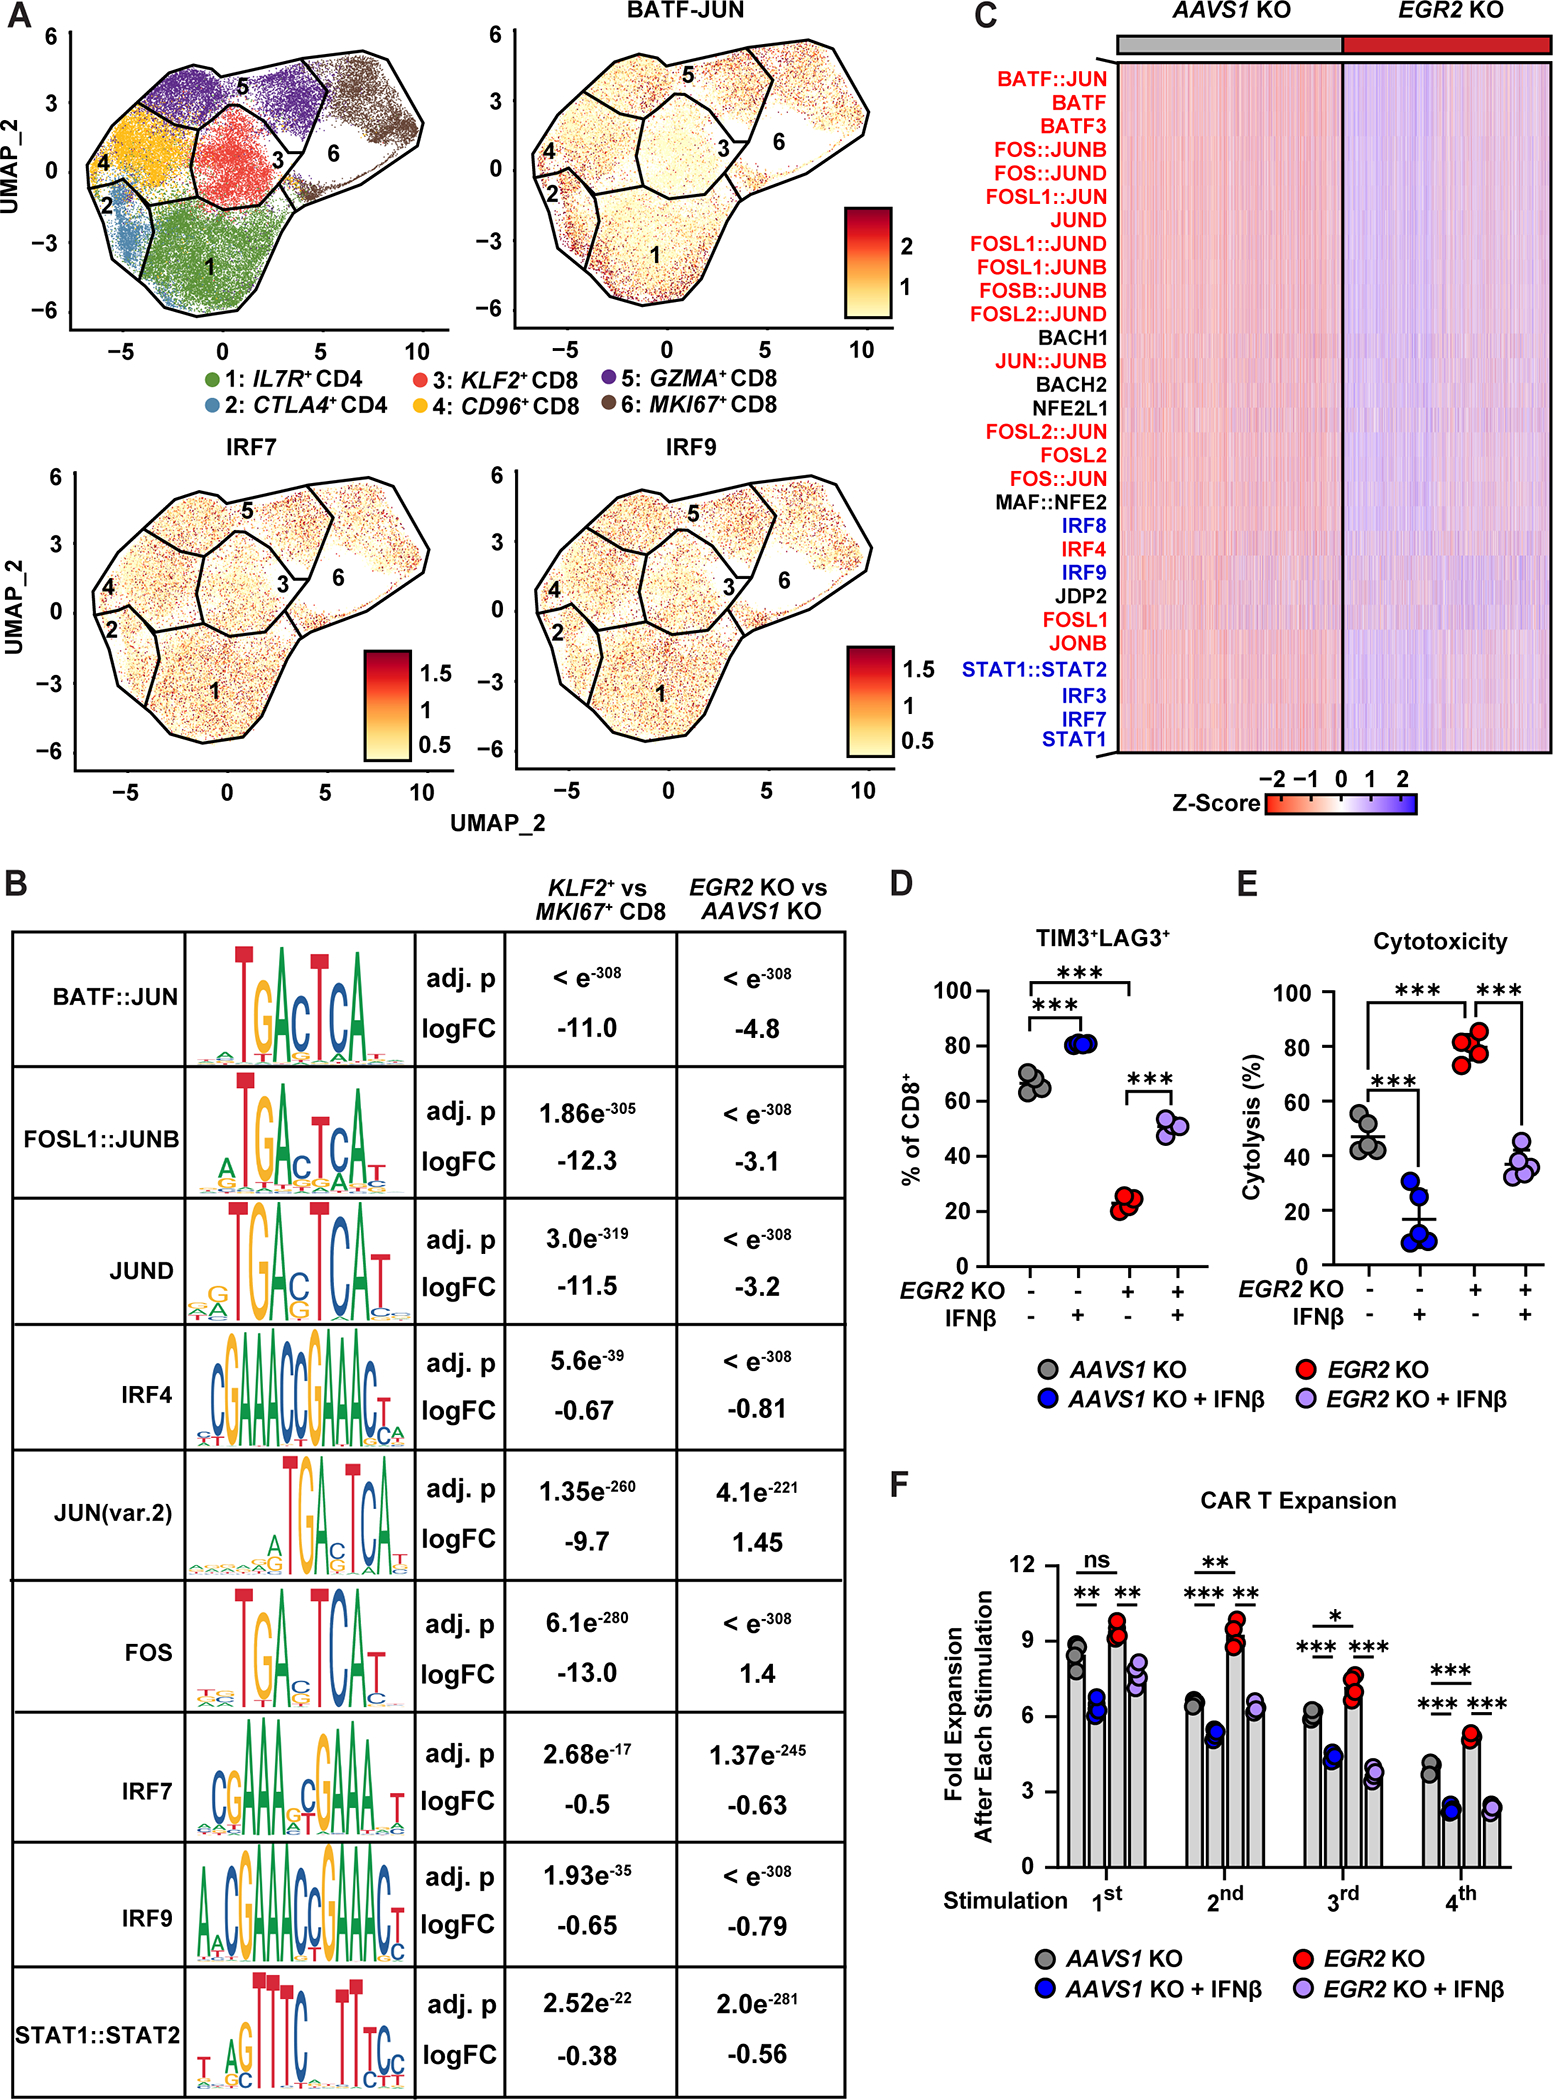
Chimeric antigen receptor (CAR) T cell therapy has shown promise in treating hematologic cancers, but resistance is common and efficacy is limited in solid tumors. We found that CAR T cells autonomously propagate epigenetically programmed type I interferon signaling through chronic stimulation, which hampers antitumor function. EGR2 transcriptional regulator knockout not only blocks this type I interferon-mediated inhibitory program but also independently expands early memory CAR T cells with improved efficacy against liquid and solid tumors. The protective effect of EGR2 deletion in CAR T cells against chronic antigen-induced exhaustion can be overridden by interferon-β exposure, suggesting that EGR2 ablation suppresses dysfunction by inhibiting type I interferon signaling. Finally, a refined EGR2 gene signature is a biomarker for type I interferon-associated CAR T cell failure and shorter patient survival. These findings connect prolonged CAR T cell activation with deleterious immunoinflammatory signaling and point to an EGR2-type I interferon axis as a therapeutically amenable biological system.

Significance: To improve CAR T cell therapy outcomes, modulating molecular determinants of CAR T cell-intrinsic resistance is crucial. Editing the gene encoding the EGR2 transcriptional regulator renders CAR T cells impervious to type I interferon pathway-induced dysfunction and improves memory differentiation, thereby addressing major barriers to progress for this emerging class of cancer immunotherapies. This article is highlighted in the In This Issue feature, p. 1501.


Conflict of interest statement

Conflict of Interest Statement: I.Y. Jung, V. Narayan, N.B. Haas, D.L. Siegel, D.L. Porter, S. Guedan, F.D. Bushman and J.A. Fraietta hold patents and other intellectual property in the field of T-cell-based immunotherapy for cancer and have received royalties. The remaining authors declare no potential conflicts of interest related to this work.

Figures

Figure 1.
Figure 1.. Chronically-stimulated CAR T-cells exhibit type I IFN pathway upregulation.
A, Schematic representation of the in vitro “stress test” used to induce CAR T-cell dysfunction. Briefly, PSMA CAR T-cells were challenged with PC3 prostate tumor cells expressing PSMA every five days at an effector to target (E:T) ratio of 3:1. B, Magnitude of CAR T-cell expansion after each antigen stimulation. Data indicate mean ± S.D. from n = 8 individual healthy donors (one-way ANOVA). C, Representative flow cytometry plots showing frequencies of CD8+ CAR T-cells expressing CD27 and CD45RO. D, Proportions of pre- and chronically stimulated CAR T-cells expressing early memory markers (CD27, CD127, and CCR7: n = 8 using four different healthy donors, CD62L: n = 6 using two healthy donors; ratio paired t-test). E, Cytokine production after the first and chronic antigen stimulation time points (n = 5 using four healthy donors; ratio paired t-test). F, Representative flow cytometry plots showing percentages of CAR T-cells expressing TIM3 and LAG3 inhibitory receptors. G, Frequency of TIM3+LAG3+ CD8 CAR T-cells. (H) Heatmap showing expression levels of exhaustion-related genes. I, Gene set enrichment analysis (GSEA) of exhaustion pathways. J, Volcano plot showing differentially expressed genes between pre- and chronically stimulated CAR T-cells. Type I IFN genes are highlighted in blue. K, Top pathways upregulated in chronically stimulated CAR T-cells. L, GSEA analysis using gene sets associated with the type I IFN pathway, TCF7 regulon, and CAR T-cell persistence. *P < 0.05, *P < 0.01, ***P < 0.001, ns: not significant.
Figure 2.
Figure 2.. Type I interferon and EGR2 pathways are associated with resistance to CAR T-cells.
A, Transcription factor-encoding genes related to T-cell dysfunction differentially expressed between pre- and chronically-stimulated PSMA CAR T-cells are highlighted in red. B, Expression of EGR2 in pre- and chronically-stimulated CAR T-cells. C, Enrichment of an EGR2 gene signature (EGR2 ARCHS4 co-expression gene set) in chronically-activated CAR T-cells. D, ATACseq tracks of differential chromatin accessibility within a region of the EGR2 gene region in unstimulated versus chronically stimulated CAR T-cells. The differentially accessible region is boxed. E, An EGR2 binding motif is observed in 4.2% of differentially accessible peaks. F, ATACseq tracks of PDCD1 and G, MX2. Differentially accessible peaks colocalized with EGR2 binding motif are highlighted in light blue (F and G). H, EGR2 and type I IFN signature scores during serial antigen restimulation of PSMA CAR T-cells. I, EGR2 and type I IFN gene signature scores measured during expansion of naïve CD8+ T-cells expressing a GD2 CAR with high level of tonic signaling compared to a non-tonically signaling CD19 CAR. CAR T-cells were generated using T-cells from a healthy donor. (GSE136891). J, Expression levels of EGR2 and an EGR2 gene signature in clinically favorable (naïve/stem cell-like) and unfavorable (effector memory/effector) baseline/apheresis T-cell populations in ALL. K, Top transcription factor (TF) co-expression signatures overexpressed in CD19 CAR T-cell products of non-responding CLL patients. L, EGR2 and type I IFN gene signature scores measured in stimulated CD19 CAR T-cell products from CLL patients. (CR: complete response, PRTD: very good partial response, PR: conventional partial response, NR: no response) *P < 0.05, *P < 0.01, ***P < 0.001, ns: not significant. M, Type I IFN and EGR2 module scores in PSMA CAR T-cells from non-lymphodepleted metastatic castration resistant prostate cancer patients in association with in vivo CAR T-cell expansion and PSA response.
Figure 3.
Figure 3.. EGR2 knockout CAR T-cells demonstrate an early memory differentiation phenotype and reduced dysfunction.
A, CRISPR/Cas9-mediated EGR2 knockout (KO) was confirmed by ICE (Inference of CRISPR Edits) analysis (n = 6). B, C, CAR T-cell expansion capacity during an in vitro stress test. PSMA CAR T-cells were challenged with PC3 cells expressing PSMA every five days at an effector to target (E:T) ratio of 3:1. D, Representative flow cytometry plots showing frequencies of AAVS1 (control) and EGR2-edited CD8+ CAR T-cells expressing CD27 and CD45RO. E, Frequencies of AAVS1 (control) and EGR2 knockout CD8+ CAR T-cells expressing memory markers following two consecutive rounds of antigen stimulation. F, Representative flow cytometric contour plots showing gene-edited CAR T-cells expressing TIM3 and LAG3. G, Exhaustion marker profiles of serially-restimulated CD8+ CAR T-cells following chronic antigen challenges. H, Cytolytic activity of EGR2 knockout CAR T-cells measured using the xCELLigence-based real-time cytotoxicity assay. 20% Tween 20-treated tumor targets were used as a full lysis control. I, Effector cytokines produced by CAR T-cells after 24-hours of antigen stimulation. All in vitro “stress test” experiments were conducted using CAR T-cells manufactured from three different healthy subjects. Figures (B-I) are comprised of representative data from one donor. *P < 0.05, *P < 0.01, ***P < 0.001, ns.: not significant (Student’s t-test).
Figure 4.
Figure 4.. EGR2 knockout in CAR T-cells blocks the inhibitory type I IFN transcriptional program and increases memory-related pathways.
A, Uniform manifold approximation and projection (UMAP) plot displaying CD4+ and CD8+ CAR T-cell clusters. Single-cell multiome gene expression experiments were conducted using chronically-stimulated AAVS1 and EGR2 knockout CAR T-cells produced from two healthy donors. B, Bubble plot showing marker gene expression in CD4+ and CD8+ CAR T-cell clusters. C, Frequencies of CAR T-cell clusters in each sample are shown. D, E, Gene signatures scores associated with (D) T-cell stemness, memory, and exhaustion and (E) favorable and unfavorable clinical responses in each CD8+ cluster and CAR T-cell sample. F, Pathways (GO biological processes) differentially regulated in EGR2 knockout CD8+ CAR T-cells. G, Volcano plot showing differentially expressed genes between EGR2 and AAVS1 knockout CD8+ CAR T-cells. Type I IFN genes are highlighted in blue.
Figure 5.
Figure 5.. EGR2 deletion ameliorates an epigenetic program of CAR T-cell exhaustion that is functionally bypassed by type I IFN exposure.
A, UMAP plots showing CD4+ and CD8+ subclusters and chromVAR motif deviation scores. B, Table displaying transcription factor motifs enriched in CD8+subclusters and AAVS1 (control) or EGR2 knockout CAR T-cell samples. C, Heatmap showing top transcription factor motifs inaccessible in EGR2 KO CAR T-cells. Exhaustion-associated AP-1/bZIP motifs and type I IFN-associated IRF/STAT motifs are highlighted in red and blue, respectively. (D-F) PSMA CAR T-cells were serially stimulated with PSMA-expressing PC3 tumor targets in the presence or absence of IFNβ treatment (1ng/mL). Experiments were conducted using CAR T-cells produced from multiple healthy subjects, each represented by a separate dot. D, Frequency of TIM3+LAG3+ CD8+ CAR-T-cells after chronic antigen stimulation (one-way ANOVA, n = 4). E, CAR T-cells were isolated after chronic stimulation and co-cultured with target cancer cells to measure cytolytic capacity using the xCELLigence real-time cytotoxicity assay (one-way ANOVA, n = 5). F, Proliferative capacity of CAR T-cells during the “stress test” (two-way ANOVA, n = 4). Single cell multiome ATACseq experiments were conducted using chronically-stimulated AAVS1 and EGR2 knockout CAR T-cells generated from two different healthy donors. *P < 0.05, **P < 0.01, ***P < 0.001, ns.: not significant.
Figure 6.
Figure 6.. EGR2 knockout improves CAR T-cell efficacy in multiple liquid and solid tumor in vivo models.
(A-E) NSG mice were intravenously infused with 106 NALM6-CBG cells. On day seven post-tumor injection, AAVS1 and EGR2 knockout CD19 CAR T-cells and negative control, irrelevant PSMA CAR T-cells (pBBz), were adoptively transferred (n = 6–7). A, Longitudinal leukemia burden measured by bioluminescent imaging. Data are representative of two independent experiments. Peripheral blood samples were collected on day twelve post-CAR T-cell injection for immunophenotyping (Mann-Whitney test, n = 6–7). B, Kaplan-Meier curves showing survival of mice following CAR T-cell treatment (Log-rank test). C, Human T-cell counts measured by using counting beads. Frequencies of hCD45+CD8+ cells expressing D, a memory marker (CD27) and E, exhaustion markers (PD1, TIM3, and LAG3). F, NSG mice were treated with 4 × 10⁶ Capan2 cells subcutaneously. On day 38, AAVS1 and EGR2 knockout mesothelin-targeting CAR T-cells were injected intravenously, and tumor growth was monitored over time (Mann-Whitney test, n = 6). Data are representative of two independent experiments. G, NSG mice were subcutaneously injected with 4 × 10⁶ AsPC1 cells. On day 31, the indicated mesothelin-targeting CAR T-cells were injected intravenously, and tumor growth was monitored over time (n = 7). Mice treated with irrelevant CD19 CAR T-cells (19BBz) served as a negative control. Data are representative of two independent experiments. H, On day 37 post-CAR T-cell infusion, tumors were harvested, and CAR T-cells isolated from tumors were reactivated ex vivo. Effector proteins produced by CAR T-cells were measured using flow cytometry (Mann-Whitney test, n = 7). *P < 0.05, *P < 0.01, ***P < 0.001, ns.: not significant.
Figure 7.
Figure 7.. A refined EGR2 molecular signature predicts CAR T-cell potency, clinical response and patient survival.
(A-B) EGR2-targeted gene expression scores in A, unstimulated and B, CAR-stimulated CD19 CAR T-cell products from responders (CR/PRTD) and non-responders (NR/PR) in CLL (EGR2 KO UP/DN signatures: genes upregulated or downregulated in EGR2 KO CAR T-cells compared to AAVS1 KO CAR T-cells) (Mann-Whitney test). C, Kaplan–Meier analysis of overall survival (left) and event-free survival (right) stratified by CLL CD19 CAR T cells products with high and low EGR2 KO UP gene expression scores (n = 22 evaluable patients). Correlation between an EGR2-targeted gene expression score and D, peripheral blood CAR T-cell expansion in patients (Pearson correlation), E, frequencies of clinically favorable (CD8+PD1CD27+) and unfavorable (CD8+PD1+CD27) subsets in CAR T-cell infusion products (Pearson correlation). (F, G) CD19 CAR T-cells were generated from a CLL non-responder using apheresis material, and their antitumor activity was evaluated in the NALM6 xenograft model. NSG mice were intravenously injected with 105 NALM6-CBG cells. On day 1, the mice received 8 × 10⁵ CAR T-cells with EGR2 KO or a negative control T-cells with a PSMA-targeting CAR (n = 6–7). F, Longitudinal tumor growth. G, Mouse survival.

References

    1. Fraietta JA, Lacey SF, Orlando EJ, Pruteanu-Malinici I, Gohil M, Lundh S, et al. Determinants of response and resistance to CD19 chimeric antigen receptor (CAR) T cell therapy of chronic lymphocytic leukemia. Nat Med 2018;24(5):563–71 doi 10.1038/s41591-018-0010-1. - DOI - PMC - PubMed
    1. Fraietta JA, Nobles CL, Sammons MA, Lundh S, Carty SA, Reich TJ, et al. Disruption of TET2 promotes the therapeutic efficacy of CD19-targeted T cells. Nature 2018;558(7709):307–12 doi 10.1038/s41586-018-0178-z. - DOI - PMC - PubMed
    1. Shah NN, Qin H, Yates B, Su L, Shalabi H, Raffeld M, et al. Clonal expansion of CAR T cells harboring lentivector integration in the CBL gene following anti-CD22 CAR T-cell therapy. Blood Adv 2019;3(15):2317–22 doi 10.1182/bloodadvances.2019000219. - DOI - PMC - PubMed
    1. Lindner SE, Johnson SM, Brown CE, Wang LD. Chimeric antigen receptor signaling: Functional consequences and design implications. Sci Adv 2020;6(21):eaaz3223 doi 10.1126/sciadv.aaz3223. - DOI - PMC - PubMed
    1. Jin J, Cheng J, Huang M, Luo H, Zhou J. Fueling chimeric antigen receptor T cells with cytokines. Am J Cancer Res 2020;10(12):4038–55. - PMC - PubMed

Publication types

Substances