. 2023 Jul 7;13(7):1592-1615.
doi: 10.1158/2159-8290.CD-23-0004.

A Compendium of Syngeneic, Transplantable Pediatric High-Grade Glioma Models Reveals Subtype-Specific Therapeutic Vulnerabilities

Affiliations

A Compendium of Syngeneic, Transplantable Pediatric High-Grade Glioma Models Reveals Subtype-Specific Therapeutic Vulnerabilities

Michael McNicholas et al. Cancer Discov. .

Erratum in

Abstract

Pediatric high-grade gliomas (pHGG) are lethal, incurable brain tumors frequently driven by clonal mutations in histone genes. They often harbor a range of additional genetic alterations that correlate with different ages, anatomic locations, and tumor subtypes. We developed models representing 16 pHGG subtypes driven by different combinations of alterations targeted to specific brain regions. Tumors developed with varying latencies and cell lines derived from these models engrafted in syngeneic, immunocompetent mice with high penetrance. Targeted drug screening revealed unexpected selective vulnerabilities-H3.3G34R/PDGFRAC235Y to FGFR inhibition, H3.3K27M/PDGFRAWT to PDGFRA inhibition, and H3.3K27M/PDGFRAWT and H3.3K27M/PPM1DΔC/PIK3CAE545K to combined inhibition of MEK and PIK3CA. Moreover, H3.3K27M tumors with PIK3CA, NF1, and FGFR1 mutations were more invasive and harbored distinct additional phenotypes, such as exophytic spread, cranial nerve invasion, and spinal dissemination. Collectively, these models reveal that different partner alterations produce distinct effects on pHGG cellular composition, latency, invasiveness, and treatment sensitivity.

Significance: Histone-mutant pediatric gliomas are a highly heterogeneous tumor entity. Different histone mutations correlate with different ages of onset, survival outcomes, brain regions, and partner alterations. We have developed models of histone-mutant gliomas that reflect this anatomic and genetic heterogeneity and provide evidence of subtype-specific biology and therapeutic targeting. See related commentary by Lubanszky and Hawkins, p. 1516. This article is highlighted in the In This Issue feature, p. 1501.


Figures

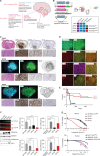
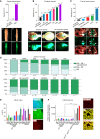
Figure 1. A, Schematic representation of cosegregating mutations in pHGGs and DMGs and their correlation with different anatomic compartments. WT, wild-type. B, Schematic describing in utero electroporation (IUE)–based H3.3G34R-driven brain tumor modeling. Different combinations of piggyBac and CRISPR vectors are delivered into neural stem cells (NSC) in the ganglionic eminences (GE) at E12.5. After birth, mice develop tumors representing distinct pHGG subtypes. Inset: mutation combinations represented in each H3.3G34R model and the acronyms used to refer to them. E12.5, embryonic day 12.5; LOF, loss of function. C, Immunofluorescence and IHC detection of GFP, G34R, Ki-67, and hematoxylin and eosin (H&E) in coronal forebrain sections from tumor-bearing, symptomatic mice. Embryos were electroporated with vectors encoding (i) H3.3G34R, p53LOF, ATRXLOF, PDGFRAWT (GPAP); (ii) H3.3G34R, p53LOF, ATRXLOF, PDGFRAD842V (GPAD); and (iii) H3.3G34R, p53LOF, ATRXLOF, PDGFRAC235Y (GPAC). Tumor cells are GFP+. Higher magnification panels below each low-magnification panel are of the tumor bulk in the ventral forebrain, i.e., striatum, which is what the GE differentiates into in adults. Scale bars, 1 mm in the immunofluorescence panels and 200 μm in the IHC panels. D, Immunofluorescence of tumor tissue in the ventral forebrain, i.e., striatum, to confirm the presence of cointroduced mutations and for colocalization with various markers. Tumor cells are GFP+, G34R+, HA+, PDGFRA+, and ATRX−. They also express higher levels of Ki-67 and Nestin. Scale bars, 50 μm. E, Kaplan–Meier survival curves of IUE, tumor-bearing mice carrying different combinations of mutations. GPAP (n = 15), GPAD (n = 7), and GPAC (n = 17). Statistical comparisons using the log-rank Mantel–Cox tests are described in Supplementary Table S2. F, Left: acid-extracted histone and protein lysates prepared from ex vivo gliomasphere (GS) lines derived from the H3.3G34R-driven de novo models (GPAP, GPAD, and GPAC). GS lines express higher levels of G34R, HA, and PDGFRA than control wild-type NSCs derived from GEs (GE NSC). Total H3.3 levels and GAPDH were used as loading controls. Middle: validation of p53 and ATRX downregulation in ex vivo H3.3G34R GS cells by qRT-PCR. Right: validation of DLX1/2 upregulation in ex vivo H3.3G34R GS cells by qRT-PCR. Data are presented as means ± SD from at least n = 3 replicates. ****, P < 0.0001 and ***, P = 0.0003 were calculated using one-way ANOVA. G, Dose–response curves for mouse GPAP, GPAD, and GPAC cells and normal H3.3WT NSCs (top), and human G34R (GBM002), G34R knockout (KO), and H3.3WT glioma cells (bottom) following treatment with infigratinib for 6 days at the indicated concentrations. Means ± SD are plotted from at least n = 3 replicates. Statistics are summarized in Supple­mentary Table S7.
Figure 1.
A, Schematic representation of cosegregating mutations in pHGGs and DMGs and their correlation with different anatomic compartments. WT, wild-type. B, Schematic describing in utero electroporation (IUE)–based H3.3G34R-driven brain tumor modeling. Different combinations of piggyBac and CRISPR vectors are delivered into neural stem cells (NSC) in the ganglionic eminences (GE) at E12.5. After birth, mice develop tumors representing distinct pHGG subtypes. Inset: mutation combinations represented in each H3.3G34R model and the acronyms used to refer to them. E12.5, embryonic day 12.5; LOF, loss of function. C, Immunofluorescence and IHC detection of GFP, G34R, Ki-67, and hematoxylin and eosin (H&E) in coronal forebrain sections from tumor-bearing, symptomatic mice. Embryos were electroporated with vectors encoding (i) H3.3G34R, p53LOF, ATRXLOF, PDGFRAWT (GPAP); (ii) H3.3G34R, p53LOF, ATRXLOF, PDGFRAD842V (GPAD); and (iii) H3.3G34R, p53LOF, ATRXLOF, PDGFRAC235Y (GPAC). Tumor cells are GFP+. Higher magnification panels below each low-magnification panel are of the tumor bulk in the ventral forebrain, i.e., striatum, which is what the GE differentiates into in adults. Scale bars, 1 mm in the immunofluorescence panels and 200 μm in the IHC panels. D, Immunofluorescence of tumor tissue in the ventral forebrain, i.e., striatum, to confirm the presence of cointroduced mutations and for colocalization with various markers. Tumor cells are GFP+, G34R+, HA+, PDGFRA+, and ATRX. They also express higher levels of Ki-67 and Nestin. Scale bars, 50 μm. E, Kaplan–Meier survival curves of IUE, tumor-bearing mice carrying different combinations of mutations. GPAP (n = 15), GPAD (n = 7), and GPAC (n = 17). Statistical comparisons using the log-rank Mantel–Cox tests are described in Supplementary Table S2. F, Left: acid-extracted histone and protein lysates prepared from ex vivo gliomasphere (GS) lines derived from the H3.3G34R-driven de novo models (GPAP, GPAD, and GPAC). GS lines express higher levels of G34R, HA, and PDGFRA than control wild-type NSCs derived from GEs (GE NSC). Total H3.3 levels and GAPDH were used as loading controls. Middle: validation of p53 and ATRX downregulation in ex vivo H3.3G34R GS cells by qRT-PCR. Right: validation of DLX1/2 upregulation in ex vivo H3.3G34R GS cells by qRT-PCR. Data are presented as means ± SD from at least n = 3 replicates. ****, P < 0.0001 and ***, P = 0.0003 were calculated using one-way ANOVA. G, Dose–response curves for mouse GPAP, GPAD, and GPAC cells and normal H3.3WT NSCs (top), and human G34R (GBM002), G34R knockout (KO), and H3.3WT glioma cells (bottom) following treatment with infigratinib for 6 days at the indicated concentrations. Means ± SD are plotted from at least n = 3 replicates. Statistics are summarized in Supple­mentary Table S7.
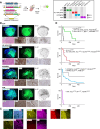
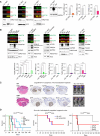
Figure 2. A, Schematic describing IUE-based H3K27M-driven brain tumor modeling. Different combinations of piggyBac and CRISPR vectors are delivered into NSCs lining the LRL at E12.5. After birth, mice develop tumors representing distinct DMG subtypes. Inset: mutation combinations represented in H3K27M models and the acronyms used to refer to them. B, Immunofluorescence and IHC detection of GFP, K27M, Ki-67, and hematoxylin and eosin (H&E) in coronal hindbrain sections from tumor-bearing, symptomatic mice. Embryos were electroporated with vectors encoding (i) H3.3K27M, p53LOF, PDGFRAWT (KPP); (ii) H3.1K27M, ACVRAG328V, PIK3CAE545K (H3.1KACVPIK); (iii) H3.3K27M, PPM1DΔC, PIK3CAE545K (KPPMPIK); and (iv) H3.3K27M, NF1LOF, FGFR1N457K (KNF). Tumor cells are GFP+. Higher magnification panels below each low-magnification panel are of the tumor bulk in the brainstem, i.e., pons and medulla, which are directly below the cerebellum and fourth ventricle. Scale bars represent 1 mm in the immunofluorescence panels and 200 μm in the IHC panels. C, Immunofluorescence of tumor tissue sections in the pons or medulla to confirm the presence of cointroduced mutations and for colocalization with various markers. PIK3CA and PPM1D are coexpressed in HA+ KPPMPIK tumor cells (left); ACVR1 and OLIG2 colocalize in H3.1KACVPIK tumors (middle, top); FGFR1 is upregulated in HA+ KNF tumor cells (middle, bottom); and PDGFRA is expressed in K27M+ KPP tumor cells (right). Scale bars, 50 μm. D, Kaplan–Meier survival curves of IUE, tumor-bearing mice carrying different combinations of mutations. KPP (n = 6), H3.1KACVPIK (n = 13), KPPMPIK (n = 22), and KNF (n = 17). Statistical comparisons using the log-rank Mantel–Cox tests are described in Supplementary Table S2.
Figure 2.
A, Schematic describing IUE-based H3K27M-driven brain tumor modeling. Different combinations of piggyBac and CRISPR vectors are delivered into NSCs lining the LRL at E12.5. After birth, mice develop tumors representing distinct DMG subtypes. Inset: mutation combinations represented in H3K27M models and the acronyms used to refer to them. B, Immunofluorescence and IHC detection of GFP, K27M, Ki-67, and hematoxylin and eosin (H&E) in coronal hindbrain sections from tumor-bearing, symptomatic mice. Embryos were electroporated with vectors encoding (i) H3.3K27M, p53LOF, PDGFRAWT (KPP); (ii) H3.1K27M, ACVRAG328V, PIK3CAE545K (H3.1KACVPIK); (iii) H3.3K27M, PPM1DΔC, PIK3CAE545K (KPPMPIK); and (iv) H3.3K27M, NF1LOF, FGFR1N457K (KNF). Tumor cells are GFP+. Higher magnification panels below each low-magnification panel are of the tumor bulk in the brainstem, i.e., pons and medulla, which are directly below the cerebellum and fourth ventricle. Scale bars represent 1 mm in the immunofluorescence panels and 200 μm in the IHC panels. C, Immunofluorescence of tumor tissue sections in the pons or medulla to confirm the presence of cointroduced mutations and for colocalization with various markers. PIK3CA and PPM1D are coexpressed in HA+ KPPMPIK tumor cells (left); ACVR1 and OLIG2 colocalize in H3.1KACVPIK tumors (middle, top); FGFR1 is upregulated in HA+ KNF tumor cells (middle, bottom); and PDGFRA is expressed in K27M+ KPP tumor cells (right). Scale bars, 50 μm. D, Kaplan–Meier survival curves of IUE, tumor-bearing mice carrying different combinations of mutations. KPP (n = 6), H3.1KACVPIK (n = 13), KPPMPIK (n = 22), and KNF (n = 17). Statistical comparisons using the log-rank Mantel–Cox tests are described in Supplementary Table S2.
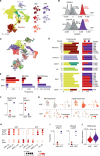
Figure 3. A, Uniform manifold approximation and projection (UMAP) of KNF and KPP integration colored by cell type annotation summarized in Supplementary Table S5 (left) and by replicate (right). Cells that did not meet quality control thresholds, as determined from individual sample analysis, and cells with no cell type consensus are not plotted. OL, oligodendrocyte. B, Distribution of ssGSEA scores per cell for human tumor signatures in OPC-projected cells of KNF samples (top) and KPP samples (bottom). Signatures were derived from differential expression of bulk RNA-seq data for tumor subtypes (see Methods). N = 34,326 cells in KNF; N = 3,892 cells in KPP. C, UMAP as in A with cells colored by cluster. D, Predominant cell types per cluster of KNF and KPP integration (left), corresponding proportion of each genotype within the cluster (middle), and number of cells per cluster (right). Only cells passing QC and with a cell type consensus are considered. Cell types comprising at least 30% of the cluster are shown. ASTR, astrocyte. E, Proportion of cells per replicate annotated as OPC (left), microglia (middle), and macrophages (right). F, Proportion of cells with detected Mag (left) and Pdgfra (right). G, UMAPs of each replicate from individual sample analysis with cells colored by normalized expression of Myrf (left) and Cspg4 (right). H, Mean inferred TF activity scores (scaled) and percent of cells with activity of TF shown for clusters 0, 7, 10, and 2, with predominant cell types of OPC, proliferating OPC (P-OPC), newly forming oligodendrocytes (NFOL), and mature oligodendrocytes, respectively; cluster number is indicated in parenthesis. Representative TFs with differing activity patterns between genotypes are shown. I, Proportion of cells with detected Ptprc (left) and Ly86 (right). J, Mean expression of DAM signature genes in immune cluster 5, with cells grouped by genotype. P < 2.2e-16.
Figure 3.
A, Uniform manifold approximation and projection (UMAP) of KNF and KPP integration colored by cell type annotation summarized in Supplementary Table S5 (left) and by replicate (right). Cells that did not meet quality control thresholds, as determined from individual sample analysis, and cells with no cell type consensus are not plotted. OL, oligodendrocyte. B, Distribution of ssGSEA scores per cell for human tumor signatures in OPC-projected cells of KNF samples (top) and KPP samples (bottom). Signatures were derived from differential expression of bulk RNA-seq data for tumor subtypes (see Methods). N = 34,326 cells in KNF; N = 3,892 cells in KPP. C, UMAP as in A with cells colored by cluster. D, Predominant cell types per cluster of KNF and KPP integration (left), corresponding proportion of each genotype within the cluster (middle), and number of cells per cluster (right). Only cells passing QC and with a cell type consensus are considered. Cell types comprising at least 30% of the cluster are shown. ASTR, astrocyte. E, Proportion of cells per replicate annotated as OPC (left), microglia (middle), and macrophages (right). F, Proportion of cells with detected Mag (left) and Pdgfra (right). G, UMAPs of each replicate from individual sample analysis with cells colored by normalized expression of Myrf (left) and Cspg4 (right). H, Mean inferred TF activity scores (scaled) and percent of cells with activity of TF shown for clusters 0, 7, 10, and 2, with predominant cell types of OPC, proliferating OPC (P-OPC), newly forming oligodendrocytes (NFOL), and mature oligodendrocytes, respectively; cluster number is indicated in parenthesis. Representative TFs with differing activity patterns between genotypes are shown. I, Proportion of cells with detected Ptprc (left) and Ly86 (right). J, Mean expression of DAM signature genes in immune cluster 5, with cells grouped by genotype. P < 2.2e-16.
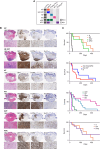
Figure 4. A, Mutation combinations represented in H3K27M models and the acronyms used to refer to them. B, IHC detection of hematoxylin and eosin (H&E), GFP, K27M, and Ki-67 in coronal hindbrain sections from tumor-bearing, symptomatic mice. Embryos were electroporated with vectors encoding (i) H3.3K27M, p53LOF (KP); (ii) H3.1K27M, p53LOF (H3.1KP); (iii) H3.3K27M, FGFR1N457K (KF); (iv) H3.3K27M, NF1LOF (KN); (v) H3.3K27M, p53LOF, FGFR1N457K (KPF); and (vi) H3.3K27M, p53LOF, CCND2WT (KPC). Tumor cells are GFP+. Higher magnification panels below each low-magnification panel are of the tumor bulk in the brainstem, i.e., pons and medulla, which are directly below the cerebellum and fourth ventricle. Scale bars, 2 mm in the low-magnification panels and 200 μm in the high-magnification panels. C, Kaplan–Meier survival curves of IUE, tumor-bearing mice carrying different combinations of mutations. KP (n = 6), H3.1KP (n = 6), KF (n = 10), KN (n = 7), KPF (n = 16), and KPC (n = 9). Statistical comparisons using the log-rank Mantel–Cox tests are described in Supplementary Table S2.
Figure 4.
A, Mutation combinations represented in H3K27M models and the acronyms used to refer to them. B, IHC detection of hematoxylin and eosin (H&E), GFP, K27M, and Ki-67 in coronal hindbrain sections from tumor-bearing, symptomatic mice. Embryos were electroporated with vectors encoding (i) H3.3K27M, p53LOF (KP); (ii) H3.1K27M, p53LOF (H3.1KP); (iii) H3.3K27M, FGFR1N457K (KF); (iv) H3.3K27M, NF1LOF (KN); (v) H3.3K27M, p53LOF, FGFR1N457K (KPF); and (vi) H3.3K27M, p53LOF, CCND2WT (KPC). Tumor cells are GFP+. Higher magnification panels below each low-magnification panel are of the tumor bulk in the brainstem, i.e., pons and medulla, which are directly below the cerebellum and fourth ventricle. Scale bars, 2 mm in the low-magnification panels and 200 μm in the high-magnification panels. C, Kaplan–Meier survival curves of IUE, tumor-bearing mice carrying different combinations of mutations. KP (n = 6), H3.1KP (n = 6), KF (n = 10), KN (n = 7), KPF (n = 16), and KPC (n = 9). Statistical comparisons using the log-rank Mantel–Cox tests are described in Supplementary Table S2.
Figure 5. A, Top: penetrance of spinal dissemination in tumor-bearing mice harboring H3.3K27M, NF1LOF, and FGFR1N457K mutations compared with all other genotypes. Bottom: representative bright field (BF) and fluorescence (GFP) images of GFP+ tumor cells that have disseminated into the thoracic spinal cord. Scale bars, 1 mm. B, Top: penetrance of exophytic spread in tumor-bearing mice harboring FGFR1N457K, PIK3CAE545K, PPM1DΔC, and NF1LOF. Bottom: representative BF and fluorescence images showing exophytic spread (bottom left) or a lack of exophytic spread (bottom right) of GFP+ tumor cells. Scale bars, 1 mm. C, Top: penetrance of cranial nerve invasion in tumor-bearing KF, KPP, H3.1KACVPIK, and KPPMPIK mice. Bottom: representative BF and fluorescence images showing cranial nerve invasion of GFP+ tumor cells (indicated by white arrows). Scale bars, 1 mm. D, Analysis of the extent of invasion of H3.1/3K27M-driven tumors into different anatomic regions (CB, cerebellum; BS, brainstem). E, Immunofluorescence and quantification of Ki-67+/GFP+ cells in H3.1/3K27M- and H3.3G34R-driven tumors. GFP+ tumor cells have a mitotic index of 10 or higher. Data, mean ± SEM. Representative images showing DAPI, GFP, and Ki-67 immunofluorescence levels in a brainstem tumor are shown on the right. Scale bars, 50 μm. F, Quantification of H3K27me3 immunofluorescence signal intensity in HA+ nuclei in tumors. Data, mean ± SEM; ****, P < 0.0001 was calculated using the one-way ANOVA test. Representative images of H3K27me3 and HA staining in a brainstem tumor are shown on the right. Scale bars, 50 μm. a.u., arbitrary units.
Figure 5.
A, Top: penetrance of spinal dissemination in tumor-bearing mice harboring H3.3K27M, NF1LOF, and FGFR1N457K mutations compared with all other genotypes. Bottom: representative bright field (BF) and fluorescence (GFP) images of GFP+ tumor cells that have disseminated into the thoracic spinal cord. Scale bars, 1 mm. B, Top: penetrance of exophytic spread in tumor-bearing mice harboring FGFR1N457K, PIK3CAE545K, PPM1DΔC, and NF1LOF. Bottom: representative BF and fluorescence images showing exophytic spread (bottom left) or a lack of exophytic spread (bottom right) of GFP+ tumor cells. Scale bars, 1 mm. C, Top: penetrance of cranial nerve invasion in tumor-bearing KF, KPP, H3.1KACVPIK, and KPPMPIK mice. Bottom: representative BF and fluorescence images showing cranial nerve invasion of GFP+ tumor cells (indicated by white arrows). Scale bars, 1 mm. D, Analysis of the extent of invasion of H3.1/3K27M-driven tumors into different anatomic regions (CB, cerebellum; BS, brainstem). E, Immunofluorescence and quantification of Ki-67+/GFP+ cells in H3.1/3K27M- and H3.3G34R-driven tumors. GFP+ tumor cells have a mitotic index of 10 or higher. Data, mean ± SEM. Representative images showing DAPI, GFP, and Ki-67 immunofluorescence levels in a brainstem tumor are shown on the right. Scale bars, 50 μm. F, Quantification of H3K27me3 immunofluorescence signal intensity in HA+ nuclei in tumors. Data, mean ± SEM; ****, P < 0.0001 was calculated using the one-way ANOVA test. Representative images of H3K27me3 and HA staining in a brainstem tumor are shown on the right. Scale bars, 50 μm. a.u., arbitrary units.
Figure 6. A, Left: acid-extracted histone and protein lysates prepared from ex vivo GS lines derived from the two-hit de novo models (KP, H3.1KP, KF, and KN) were probed for K27M, K27me3, HA, and total H3.3 levels. NSCs derived from the LRL (LRL NSC) were used as controls. Middle: validation of FGFR1 overexpression in ex vivo KF cells; GAPDH was used as a loading control. Right: validation of p53 and NF1 downregulation in ex vivo cells by qRT-PCR. Data are presented as means ± SD from at least n = 3 replicates. ****, P < 0.0001 and ***, P = 0.0003 were calculated using unpaired t test and one-way ANOVA. B, Left: acid-extracted histone and protein lysates prepared from ex vivo GS lines derived from the three- and four-hit de novo models (KPP, KPD, KPAP, KPAD, KPPMPIK, H3.1KACVPIK, KNF, KPF, and KPC) were probed for K27M, K27me3, HA, and total H3.3 levels. LRL NSCs were used as controls. Validation of PDGFRA, PPM1D, PIK3CA, ACVR1, FGFR1, and CCND2 overexpression in ex vivo GS cells; GAPDH and tubulin were used as loading controls. Right: validation of p53, ATRX, and NF1 downregulation in ex vivo GS cells by qRT-PCR. Data are presented as means ± SD from at least n = 3 replicates. ****, P < 0.0001 and ***, P = 0.0003 were calculated using unpaired t test and one-way ANOVA. C, Left: IHC detection of hematoxylin and eosin (H&E), GFP, K27M, and Ki-67 in coronal hindbrain sections from orthotopically engrafted, symptomatic mice. Mice were injected in either the pons (H3K27M) or striatum (H3.3G34R) with 150,000 to 300,000 cells from each cell GS cell line (n = 5 mice per condition). Tumor cells are GFP+. Scale bars, 2 mm. Right: BLI of brainstem tumors in orthotopically engrafted C57BL/6J mice without shaving/depilation using Akaluc imaging. D, Kaplan–Meier curves depicting survival of mice orthotopically injected with GS cells derived from H3.3K27M (left), H3.1K27M (middle), and H3.3G34R (right) models. Note that the following samples are shown twice in A and B: LRL NSC, KF, and KN; these repetitions are indicated with an asterisk. The sole purpose of this repetition is to make it easier for the reader, by collating all the Western blot (WB) data describing the “two-hit” models in A and all the WB data describing the “three-hit or more” models in B.
Figure 6.
A, Left: acid-extracted histone and protein lysates prepared from ex vivo GS lines derived from the two-hit de novo models (KP, H3.1KP, KF, and KN) were probed for K27M, K27me3, HA, and total H3.3 levels. NSCs derived from the LRL (LRL NSC) were used as controls. Middle: validation of FGFR1 overexpression in ex vivo KF cells; GAPDH was used as a loading control. Right: validation of p53 and NF1 downregulation in ex vivo cells by qRT-PCR. Data are presented as means ± SD from at least n = 3 replicates. ****, P < 0.0001 and ***, P = 0.0003 were calculated using unpaired t test and one-way ANOVA. B, Left: acid-extracted histone and protein lysates prepared from ex vivo GS lines derived from the three- and four-hit de novo models (KPP, KPD, KPAP, KPAD, KPPMPIK, H3.1KACVPIK, KNF, KPF, and KPC) were probed for K27M, K27me3, HA, and total H3.3 levels. LRL NSCs were used as controls. Validation of PDGFRA, PPM1D, PIK3CA, ACVR1, FGFR1, and CCND2 overexpression in ex vivo GS cells; GAPDH and tubulin were used as loading controls. Right: validation of p53, ATRX, and NF1 downregulation in ex vivo GS cells by qRT-PCR. Data are presented as means ± SD from at least n = 3 replicates. ****, P < 0.0001 and ***, P = 0.0003 were calculated using unpaired t test and one-way ANOVA. C, Left: IHC detection of hematoxylin and eosin (H&E), GFP, K27M, and Ki-67 in coronal hindbrain sections from orthotopically engrafted, symptomatic mice. Mice were injected in either the pons (H3K27M) or striatum (H3.3G34R) with 150,000 to 300,000 cells from each cell GS cell line (n = 5 mice per condition). Tumor cells are GFP+. Scale bars, 2 mm. Right: BLI of brainstem tumors in orthotopically engrafted C57BL/6J mice without shaving/depilation using Akaluc imaging. D, Kaplan–Meier curves depicting survival of mice orthotopically injected with GS cells derived from H3.3K27M (left), H3.1K27M (middle), and H3.3G34R (right) models. Note that the following samples are shown twice in A and B: LRL NSC, KF, and KN; these repetitions are indicated with an asterisk. The sole purpose of this repetition is to make it easier for the reader, by collating all the Western blot (WB) data describing the “two-hit” models in A and all the WB data describing the “three-hit or more” models in B.
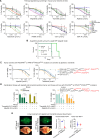
Figure 7. A, Dose–response curves for the PI3K inhibitor alpelisib, the PDGFRAmutant inhibitor avapritinib, the LSD1/HDAC inhibitor corin, the KDM6A/B inhibitor GSK-J4, the MDM2 inhibitor idasanutlin, the NAMPT inhibitor FK866, the FGFR inhibitor infigratinib, and the MEK inhibitor trametinib, tested in mouse tumor-derived GS lines. Cells were treated for 3 days (avapritinib, FK-866, idasanutlin, trametinib) or 6 days (alpelisib, corin, GSK-J4, infigratinib) at the indicated concentrations. The most sensitive and the most resistant cell lines are highlighted with different colors and with dashed vs. solid lines. Means ± SD are plotted from at least n = 3 replicates. Statistics are summarized in Supplementary Table 7. B, Kaplan-Meier curves depicting survival of mice orthotopically injected with KPP cells and orally treated for 2 weeks with avapritinib vs. vehicle control. **, P < 0.01 was calculated using the log-rank Mantel-Cox test. Statistical comparisons are described in Supplementary Table 2. C, Dose–response curves for alpelisib and trametinib tested against patient-derived cell lines for 6 days at the indicated concentrations. Means ± SD are plotted from at least n = 3 replicates. Statistics are summarized in Supplementary Table 7. D, Cell viability assays using mouse GS cells and patient-derived cells following treatment with trametinib, alpelisib, and a combination of both drugs for 6 days at the indicated concentrations. Means ± SD are plotted from at least n = 3 replicates. ****, P < 0.0001; **, P < 0.01 were calculated using ordinary one-way ANOVA. Statistics are summarized in Supplementary Table 7. E, Left: representative fluorescence images of disseminating GFP+ tumor cells 12 days following engraftment, and 4 days following initiation of continuous intracranial delivery of alpelisib and trametinib vs. vehicle control. Scale bar, 1 mm. Right: the extent of dissemination and the size of GFP+ tumors following resection at 4 days after treatment. Means ± SD are plotted from at least n = 3 replicates. *, P < 0.05 was calculated using the Welch t test.
Figure 7.
A, Dose–response curves for the PI3K inhibitor alpelisib, the PDGFRAmutant inhibitor avapritinib, the LSD1/HDAC inhibitor corin, the KDM6A/B inhibitor GSK-J4, the MDM2 inhibitor idasanutlin, the NAMPT inhibitor FK866, the FGFR inhibitor infigratinib, and the MEK inhibitor trametinib, tested in mouse tumor-derived GS lines. Cells were treated for 3 days (avapritinib, FK-866, idasanutlin, trametinib) or 6 days (alpelisib, corin, GSK-J4, infigratinib) at the indicated concentrations. The most sensitive and the most resistant cell lines are highlighted with different colors and with dashed vs. solid lines. Means ± SD are plotted from at least n = 3 replicates. Statistics are summarized in Supplementary Table 7. B, Kaplan-Meier curves depicting survival of mice orthotopically injected with KPP cells and orally treated for 2 weeks with avapritinib vs. vehicle control. **, P < 0.01 was calculated using the log-rank Mantel-Cox test. Statistical comparisons are described in Supplementary Table 2. C, Dose–response curves for alpelisib and trametinib tested against patient-derived cell lines for 6 days at the indicated concentrations. Means ± SD are plotted from at least n = 3 replicates. Statistics are summarized in Supplementary Table 7. D, Cell viability assays using mouse GS cells and patient-derived cells following treatment with trametinib, alpelisib, and a combination of both drugs for 6 days at the indicated concentrations. Means ± SD are plotted from at least n = 3 replicates. ****, P < 0.0001; **, P < 0.01 were calculated using ordinary one-way ANOVA. Statistics are summarized in Supplementary Table 7. E, Left: representative fluorescence images of disseminating GFP+ tumor cells 12 days following engraftment, and 4 days following initiation of continuous intracranial delivery of alpelisib and trametinib vs. vehicle control. Scale bar, 1 mm. Right: the extent of dissemination and the size of GFP+ tumors following resection at 4 days after treatment. Means ± SD are plotted from at least n = 3 replicates. *, P < 0.05 was calculated using the Welch t test.

Comment in

References

    1. Vitanza NA, Monje M. Diffuse intrinsic pontine glioma: from diagnosis to next-generation clinical trials. Curr Treat Options Neurol 2019;21:37. - PMC - PubMed
    1. Mackay A, Burford A, Carvalho D, Izquierdo E, Fazal-Salom J, Taylor KR, et al. . Integrated molecular meta-analysis of 1,000 pediatric high-grade and diffuse intrinsic pontine glioma. Cancer Cell 2017;32:520–37. - PMC - PubMed
    1. Ostrom QT, Price M, Ryan K, Edelson J, Neff C, Cioffi G, et al. . CBTRUS statistical report: pediatric brain tumor foundation childhood and adolescent primary brain and other central nervous system tumors diagnosed in the United States in 2014–2018. Neuro Oncol 2022;24( Suppl 3):iii1–iii38. - PMC - PubMed
    1. Schwartzentruber J, Korshunov A, Liu XY, Jones DT, Pfaff E, Jacob K, et al. . Driver mutations in histone H3.3 and chromatin remodelling genes in paediatric glioblastoma. Nature 2012;482:226–31. - PubMed
    1. Wu G, Broniscer A, McEachron TA, Lu C, Paugh BS, Becksfort J, et al. . Somatic histone H3 alterations in pediatric diffuse intrinsic pontine gliomas and non-brainstem glioblastomas. Nat Genet 2012;44:251–3. - PMC - PubMed

Publication types