. 2023 Apr 3;21(4):e3001964.
doi: 10.1371/journal.pbio.3001964. eCollection 2023 Apr.

Control of stereocilia length during development of hair bundles

Affiliations

Control of stereocilia length during development of hair bundles

Jocelyn F Krey et al. PLoS Biol. .

Abstract

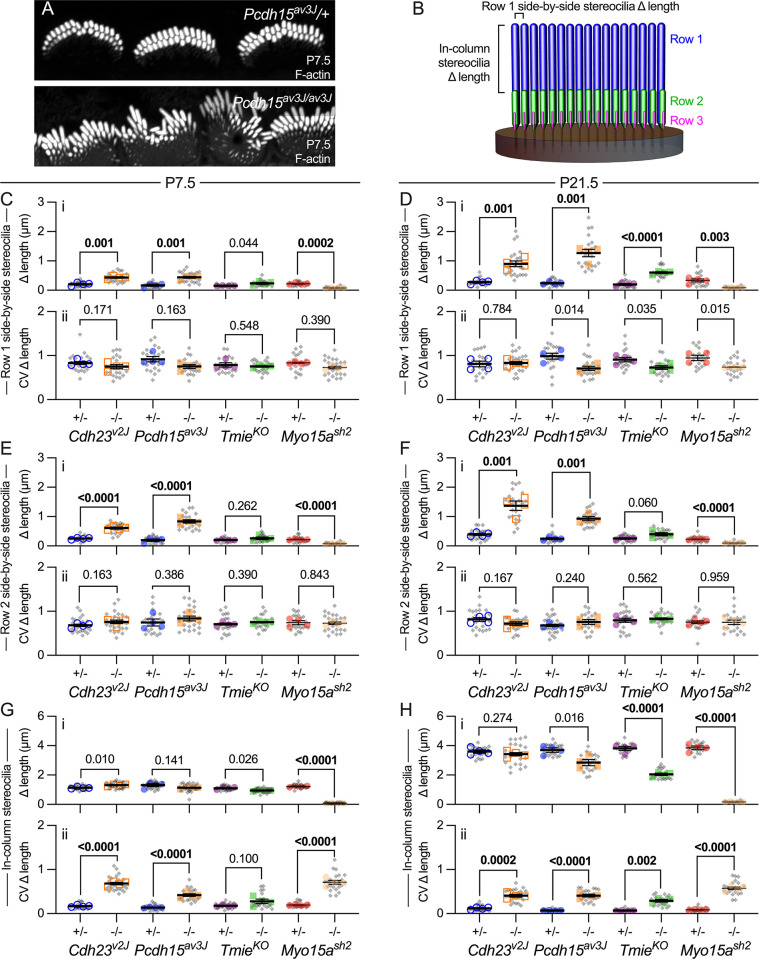
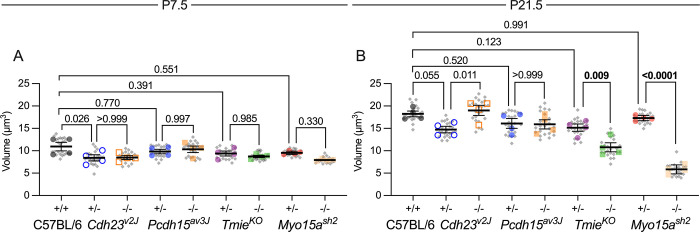
Assembly of the hair bundle, the sensory organelle of the inner ear, depends on differential growth of actin-based stereocilia. Separate rows of stereocilia, labeled 1 through 3 from tallest to shortest, lengthen or shorten during discrete time intervals during development. We used lattice structured illumination microscopy and surface rendering to measure dimensions of stereocilia from mouse apical inner hair cells during early postnatal development; these measurements revealed a sharp transition at postnatal day 8 between stage III (row 1 and 2 widening; row 2 shortening) and stage IV (final row 1 lengthening and widening). Tip proteins that determine row 1 lengthening did not accumulate simultaneously during stages III and IV; while the actin-bundling protein EPS8 peaked at the end of stage III, GNAI3 peaked several days later-in early stage IV-and GPSM2 peaked near the end of stage IV. To establish the contributions of key macromolecular assemblies to bundle structure, we examined mouse mutants that eliminated tip links (Cdh23v2J or Pcdh15av3J), transduction channels (TmieKO), or the row 1 tip complex (Myo15ash2). Cdh23v2J/v2J and Pcdh15av3J/av3J bundles had adjacent stereocilia in the same row that were not matched in length, revealing that a major role of these cadherins is to synchronize lengths of side-by-side stereocilia. Use of the tip-link mutants also allowed us to distinguish the role of transduction from effects of transduction proteins themselves. While levels of GNAI3 and GPSM2, which stimulate stereocilia elongation, were greatly attenuated at the tips of TmieKO/KO row 1 stereocilia, they accumulated normally in Cdh23v2J/v2J and Pcdh15av3J/av3J stereocilia. These results reinforced the suggestion that the transduction proteins themselves facilitate localization of proteins in the row 1 complex. By contrast, EPS8 concentrates at tips of all TmieKO/KO, Cdh23v2J/v2J, and Pcdh15av3J/av3J stereocilia, correlating with the less polarized distribution of stereocilia lengths in these bundles. These latter results indicated that in wild-type hair cells, the transduction complex prevents accumulation of EPS8 at the tips of shorter stereocilia, causing them to shrink (rows 2 and 3) or disappear (row 4 and microvilli). Reduced rhodamine-actin labeling at row 2 stereocilia tips of tip-link and transduction mutants suggests that transduction's role is to destabilize actin filaments there. These results suggest that regulation of stereocilia length occurs through EPS8 and that CDH23 and PCDH15 regulate stereocilia lengthening beyond their role in gating mechanotransduction channels.


Conflict of interest statement

The authors have declared that no competing interests exist.

Figures

Fig 1
Fig 1. Stereocilia dimensions during development of C57BL/6J apical IHCs.
(A–F) Imaris reconstruction of phalloidin-labeled IHC stereocilia from indicated ages. Stereocilia surfaces are color-coded according to row; each box is 14 × 35 μm. Imaris reconstructions show overlapping hair bundles of adjacent cells, presumably an artefact of sample preparation. (G–N) IHC stereocilia dimension measurements using reconstructed stereocilia surfaces. (G) Rows 1 and 2 stereocilia length during development; center 10 stereocilia in each row. Row 1 data were fit with a line with slope of zero from P0.5–P7.5 followed by an exponential climb from P7.5–P21.5; row 2 data were fit with an exponential decline. (H) Rows 1 and 2 stereocilia width (center 10). In the panel, data for row 1 and for row 2 from P0.5–P7.5 were fit with an exponential climb; data for 2 from P7.5–P21.5 were fit with an exponential climb. The data could also be fit linearly; between P0.5 and P7.5, the slope for row 1 was 0.026 μm • day-1 (95% confidence interval of 0.025–0.026), while the row 2 slope was 0.034 μm • day-1 (95% confidence interval of 0.032–0.036). (I) Volume per individual row 1 or row 2 stereocilium (center 10). Data were fit with a linear increase from P0.5–P7.5, following by an exponential climb (row 1) or decline (row 2) from P7.5–P21.5. (J) Rows 1 and 2 stereocilia cross-sectional area (center 10). Data were fit with a linear increase from P0.5–P7.5, followed by an exponential climb (row 1) or decline (row 2) from P7.5–P21.5. (K) Total stereocilia volume per cell using rows 1, 2, and 3 stereocilia. Data were fit with an exponential climb. (L) Number of stereocilia per cell. Data were fit with an exponential decline. (M) Length difference between row 1 and row 2 stereocilia in the same column. Data were fit with a line with slope of zero from P0.5–P7.5, followed by an exponential climb from P7.5–P21.5. (N) Length difference between adjacent (side-by-side) stereocilia in the same row. Data were fit by exponential declines. For each plot, dimension measurements of stereocilia from each bundle were averaged to give an individual cell mean; then all means for individual cells (5–6 cells from each of 3–4 cochleas) were averaged and plotted ± SEM. (O) Diagrams of IHC bundle structure at each Tilney stage in mouse cochlea. Tip links are indicated as blue lines connecting adjacent stereocilia; they appear during stage II. Transducing stereocilia are shaded red and are the stereocilia that contain active transduction channels. The principal stereocilia-building function in each stage is indicated. The data underlying all the graphs shown in the figure can be found in figshare (https://doi.org/10.6084/m9.figshare.21632636.v2). IHC, inner hair cell.
Fig 2
Fig 2. Scanning electron microscopy of mutants showing links and tip profiles.
(A–H) Scanning electron micrographs of single IHC hair bundles from P8.5 cochleas of indicated genotypes. For each genotype, top panel (labeled i) is a profile example and bottom panel (ii) is a top-down example. The insets in Ai, Bi, Ci, Di, and Gi all provide examples of beveled or pointed stereocilia tips; the insets in Ei, Fi, and Hi provide example of rounded tips. Some links were still present in both Cdh23v2J/v2J and Pcdh15av3j/av3J bundles, but were not associated with beveled stereocilia tips. Panel widths, 6 μm; inserts are 0.5 μm wide and are magnified 3-fold on left. Arrows indicate tip links. (I–L) Quantitation of number of stereocilia per hair bundle from scanning electron micrographs. Rows 1, 2, and 3 separately plotted; additional rows of stereocilia and microvilli on each cell’s apical surface were also counted (row 4+). P values for unpaired t tests are indicated. The data underlying all the graphs shown in the figure can be found in figshare (https://doi.org/10.6084/m9.figshare.21632636.v2). IHC, inner hair cell.
Fig 3
Fig 3. Stereocilia length in IHCs of mutants.
(A–H) Imaris reconstruction of phalloidin-labeled stereocilia from Cdh23v2J (A, B), Pcdh15av3J (C, D), TmieKO (E, F), and Myo15ash2 (G, H) IHCs at P7.5 and P21.5. Stereocilia surfaces are color-coded according to row; scale bar in A (2 μm) applies to all panels. (I–P) Average stereocilia length (panels labeled i) and CV (ii). Length measurements used reconstructed stereocilia surfaces. Lengths were determined for the center 10 stereocilia of each hair cell and means for all 10 stereocilia were plotted separately for rows 1 and 2 (gray symbols). The cell means were averaged for each cochlea (5–6 cells per cochlea) and plotted with colored symbols (4 cochleas per condition) [57]. Nested t tests were used to compare the cochlea values for each genotype [58]. P values are indicated and were bolded if <0.010. (I, J) Length and length CV at P7.5 and P21.5 for Cdh23v2J. (M, N) Length and length CV at P7.5 and P21.5 for Pcdh15av3J. (K, L) Length and length CV at P7.5 and P21.5 for TmieKO. (O, P) Length and length CV at P7.5 and P21.5 for Myo15ash2. The data underlying all the graphs shown in the figure can be found in figshare (https://doi.org/10.6084/m9.figshare.21632636.v2). CV, coefficient of variation; IHC, inner hair cell.
Fig 4
Fig 4. Stereocilia width in mutants.
Width measurements used reconstructed stereocilia surfaces. (A–H) Average stereocilia width (panels labeled i) and CV (ii) were determined for the center 10 stereocilia of each hair cell (gray symbols), separately for rows 1 and 2. Plotting and statistical testing were as in Fig 3. (A, B) Width and width CV at P7.5 and P21.5 for Cdh23v2J. (C, D) Width and width CV at P7.5 and P21.5 for Pcdh15av3J. (E, F) Width and width CV at P7.5 and P21.5 for TmieKO. (G, H) Width and width CV at P7.5 and P21.5 for Myo15ash2. The data underlying all the graphs shown in the figure can be found in figshare (https://doi.org/10.6084/m9.figshare.21632636.v2). CV, coefficient of variation.
Fig 5
Fig 5. Adjacent stereocilia length coordination in mutants.
(A) Phalloidin-labeled stereocilia from P7.5 Pcdh15av3J IHCs. Adjacent stereocilia in homozygous mutant hair bundles are irregular in length. Panel widths: 30 μm. (B) Schematic showing measurements made. For each pair of adjacent stereocilia in row 1 and, separately, in row 2, we measured the difference in length between them (side-by-side stereocilia Δ length). For example, Δ length for the pair indicated in panel B would be |length1 –length2|, or the absolute value of the difference in lengths. In addition, for each row 1 –row 2 pair in a column, we measured the difference in length between the 2 stereocilia (in-column stereocilia Δ length). The brackets in panel B mark this length difference for the first row 1-row 2 stereocilia pair. (C–H) Difference in adjacent stereocilia length for Cdh23v2J, Pcdh15av3J, TmieKO, and Myo15ash2 mice using reconstructed stereocilia surfaces. Plotting and statistical testing were as in Fig 3. (C, D) Difference in length (Δ length) of side-by-side row 1 stereocilia at P7.5 and P21.5. (E, F) Δ length of side-by-side row 2 stereocilia at P7.5 and P21.5. (G, H) Δ length of in-column (adjacent rows 1 and 2) stereocilia at P7.5 and P21.5. The data underlying all the graphs shown in the figure can be found in figshare (https://doi.org/10.6084/m9.figshare.21632636.v2). IHC, inner hair cell.
Fig 6
Fig 6. Pcdh15av3J;Myo15ash2 double-knockout mice.
(A–C) Scanning electron micrographs of single IHC hair bundles from P8.5 cochleas of indicated Pcdh15av3J/+;Myo15ash2/+ (Het;Het), Pcdh15av3J/+;Myo15ash2/sh2 (Het;KO), and Pcdh15av3J/av3J; Myo15ash2/sh2 (KO;KO) cochleas (2 examples per genotype). Panel widths, 6 μm. Inserts are 0.5 μm wide and are magnified 3-fold on left; arrows indicate tip links. (D–F) Phalloidin-labeled IHC hair bundles from Het;Het, Het;KO, and KO;KO cochleas. Panels labeled i (20 μm wide) are single x-y planes from image stacks; panels labeled ii (same scale as i panels) are x-z reslices from those stacks, with the region of the stack indicated with a yellow box in i. (G–N) Dimension measurements using reconstructed stereocilia surfaces. Plotting was as in Fig 3; statistical tests used one-way ANOVA analysis with the Šidák correction. (G, H) Length and CV length measurements. (I, J) Width and width CV measurements. (K, L) Difference in length (Δ length) and CV for Δ length of side-by-side row 1 stereocilia. (M, N) Difference in length (Δ length) and CV for Δ length of in-column (adjacent rows 1 and 2) stereocilia. The data underlying all the graphs shown in the figure can be found in figshare (https://doi.org/10.6084/m9.figshare.21632636.v2). CV, coefficient of variation; IHC, inner hair cell.
Fig 7
Fig 7. Pruning of short stereocilia and microvilli in mutant IHCs.
(A–H) Phalloidin labeling of P7.5 (A–D) and P21.5 (E–H) IHC hair bundles (i, heterozygotes; ii, homozygotes). Yellow boxes in heterozygotes highlight rows 3–4 stereocilia (low signal intensity because they are short and narrow). Arrows indicate extra rows of thicker stereocilia. Panel widths: 20 μm. (I–L) Individual stereocilium volumes (panels labeled i) and total volumes per cell for all stereocilia in a row (ii). Row 3 (I, J) and row 4+ (K, L) are separately plotted. Volume measurements used reconstructed stereocilia surfaces. Plotting and statistical testing were as in Fig 3. The data underlying all the graphs shown in the figure can be found in figshare (https://doi.org/10.6084/m9.figshare.21632636.v2). IHC, inner hair cell.
Fig 8
Fig 8. Total stereocilia volume in mutant IHCs.
(A, B) Total stereocilia volume per hair bundle and volume CV for Cdh23v2J, Pcdh15av3J, TmieKO, and Myo15ash2 IHCs. Volume measurements used reconstructed stereocilia surfaces. Plotting was as in Fig 3; statistical tests used one-way ANOVA analysis with the Šidák correction. (A) P7.5. No significant differences in volume between any of the genotypes. (B) P21.5. Modest differences in total stereocilia volume were seen for Cdh23v2J/+ vs. Cdh23v2J/v2J and TmieKO/+ vs. TmieKO/KO; a large difference in volume was seen for Myo15ash2 IHCs. The data underlying all the graphs shown in the figure can be found in figshare (https://doi.org/10.6084/m9.figshare.21632636.v2). CV, coefficient of variation; IHC, inner hair cell.
Fig 9
Fig 9. Developmental expression of row 1 complex proteins in IHC stereocilia.
(A–D) Localization of GPSM2 and EPS8 in P0.5, P7.5, P15.5, and P21.5 IHCs. (E, F) Localization of GNAI3 and EPS8 in P0.5, P7.5, P15.5, and P21.5 IHCs. In (A, B) and (E, F), images are projections of horizontal slices with partially flattened hair bundles. In (C, D) and (G, H), images are projections of horizontal slices obtained at the level of row 1 tips only (top) or row 2 tips and row shafts (bottom). Images in A–D were acquired in the same imaging session and used the same acquisition, processing, and display parameters; the same holds for images in E–H. Arrows in A–F indicate level of rows 1 and 2. Panel widths: A–H, 30 μm. (I-K) Quantitation of EPS8, GNAI3, and GPSM2 immunofluorescence at rows 1 and 2 tips. Fluorescence was normalized to fluorescence at P7.5 (EPS8 and GNAI3) or P15.5 (GPSM2) to allow comparison between multiple experiments. The data underlying all the graphs shown in the figure can be found in figshare (https://doi.org/10.6084/m9.figshare.21632636.v2). IHC, inner hair cell.
Fig 10
Fig 10. Row 1 protein localization in mutant IHCs.
(A–D) Localization of GNAI3 and EPS8 in Pcdh15av3J and TmieKO heterozygotes and homozygotes at P7.5. (E–H) Localization of WHRN and EPS8 in Pcdh15av3J and TmieKO heterozygotes and homozygotes at P7.5. (I–L) Localization of GPSM2 and EPS8 in Pcdh15av3J and TmieKO heterozygotes and homozygotes at P15.5. Images from all pairs of heterozygote and homozygote cochleas (A and B, C and D, E and F, G and H, I and J, K and L) were acquired in the same session and used the same acquisition, processing, and display parameters. All images are projections of horizontal slices; projections that allow visualization of the entire hair bundle typically had stereocilia splayed against the apical surface, especially at P15.5, which resulted in immunofluorescence signal from stereocilia being overlaid on top of immunofluorescence signal from apical surfaces. Small arrows in A, C, G, I, and K indicate positions of rows 1 and 2. Large arrows in B, F, and J show high levels of EPS8 in row 2 stereocilia of Pcdh15av3J/av3J IHCs. Asterisks in D and L show reduced levels of GNAI3 and GPSM2 in TmieKO/KO IHCs. Panel widths: 30 μm. IHC, inner hair cell.
Fig 11
Fig 11. Distribution of EPS8 at tips of stereocilia in tip-link and transduction mutant IHCs.
(A, B) EPS8 fluorescence average intensity per hair bundle for all measured stereocilia (rows 1 and 2) for Cdh23v2J, Pcdh15av3J, and TmieKO hair cells at P7.5 (A) and P21.5 (B). Plotting and statistical testing were as in Fig 3. (C–F) Frequency distribution of stereocilia length and EPS8 tip intensity in Cdh23v2J hair cells. (G–J) Frequency distribution of stereocilia length and EPS8 tip intensity in Pcdh15av3J hair cells. (K–N) Frequency distribution of stereocilia length and EPS8 tip intensity in TmieKO hair cells. Stereocilia length measurements (C, E, G, I, K, M) and EPS8 tip intensities (D, F, H, J, L, N) were from all rows 1 and 2 stereocilia; distributions were fit with double Gaussian functions. (O–R) Correlation of normalized EPS8 intensity with stereocilia length. Data from individual rows were displayed with separate symbol colors but all data were used for fits; data were fit with y = a + b • exp(-kx), where y is stereocilia length, x is EPS intensity, and a, b, and k are constants. The data underlying all the graphs shown in the figure can be found in figshare (https://doi.org/10.6084/m9.figshare.21632636.v2). IHC, inner hair cell.
Fig 12
Fig 12. Distribution of GNAI3, GPSM2, and WHRN at tips of stereocilia in tip-link and transduction mutant IHCs.
(A, B) GNAI3 (A) and WHRN (B) fluorescence average intensity per hair bundle for all measured stereocilia (rows 1 and 2) for Pcdh15av3J and TmieKO hair cells at P7.5. Plotting and statistical testing were as in Fig 3. (C, D) GPSM2 (C) and EPS8 (D) fluorescence average intensity per hair bundle for all measured stereocilia (rows 1 and 2) for Pcdh15av3J and TmieKO hair cells at P15.5. (E, F) Frequency distribution of GNAI3 and WHRN tip intensity in Pcdh15av3J hair cells at P7.5. (G, H) Frequency distribution of GPSM2 and EPS8 tip intensity in Pcdh15av3J hair cells at P15.5. (I, J) Frequency distribution of GNAI3 and WHRN tip intensity in TmieKO hair cells at P7.5. (K, L) Frequency distribution of GPSM2 and EPS8 tip intensity in TmieKO hair cells at P15.5. Tip intensities were from all rows 1 and 2 stereocilia; distributions were fit with double Gaussian functions. (M–P) Correlation of normalized GPSM2 intensity with stereocilia length. Data from individual rows were displayed with separate symbol colors but all data were used for fits; data were fit with y = a + b • exp(-kx), where y is stereocilia length, x is GPSM2 intensity, and a, b, and k are constants. The data underlying all the graphs shown in the figure can be found in figshare (https://doi.org/10.6084/m9.figshare.21632636.v2). IHC, inner hair cell.
Fig 13
Fig 13. Free barbed end labeling of IHC stereocilia with rhodamine-actin.
(A–L) Rhodamine-actin (Rh-actin) and phalloidin labeling of mutant IHC hair bundles at P7.5 and P21.5. Pcdh15av3J (A–B, G–H), TmieKO (C–D, I–J), and Myo15ash2 (E–F, K–L). Arrows in A, C, and E indicate high levels of row 2 rhodamine-actin labeling in P7.5 control IHC bundles; asterisks in B, D, F, H, and J indicate similar rhodamine-actin levels at all stereocilia tips in P7.5 and P21.5 mutant IHC bundles. Panel widths: 24 μm. (M–R) Rh-actin tip intensity and intensity CV in Pcdh15av3, TmieKO, and Myo15ash2 at P7.5 (M–O) and P21.5 (P–R). Plotting and statistical testing were as in Fig 3. The data underlying all the graphs shown in the figure can be found in figshare (https://doi.org/10.6084/m9.figshare.21632636.v2). CV, coefficient of variation; IHC, inner hair cell.
Fig 14
Fig 14. Row 2 protein localization in mutant IHCs.
(A–F) Localization of CAPZB and EPS8L2 in Pcdh15av3J (A, B), TmieKO (C, D), and Myo15ash2 (E, F) heterozygous and homozygous IHCs at P21.5. Arrows in A, C, and E show high levels of row 2 CAPZB in heterozygotes. In B, asterisks show CAPZB labeling along stereocilia shafts and arrowheads show strong EPS8L2 labeling at rows 1 and 2 tips. Arrows in F show CAPZB at tips of all stereocilia in Myo15ash2/sh2. Panel widths: A-F, 30 μm. (G, H) Quantitation of CAPZB (G) and EPS8L2 (H) average intensity in row 2 tips divided by the average intensity in row 1 tips in heterozygotes and homozygotes at P21.5. Plotting and statistical testing were as in Fig 3. The data underlying all the graphs shown in the figure can be found in figshare (https://doi.org/10.6084/m9.figshare.21632636.v2). IHC, inner hair cell.
Fig 15
Fig 15. Model for assembly of IHC hair bundle.
(A) Left, stereocilia building blocks (combined actin and actin crosslinkers) increase continuously in IHCs throughout early postnatal development. Right, a spatial gradient of building blocks may also exist, with building blocks having greater access to row 1 stereocilia than to shorter rows. (B) PCDH15 and CDH23 maintain coordination of adjacent stereocilia lengths, presumably by triggering actin depolymerization when spontaneous stereocilia elongation interrupts the stable state. (C) Timing of tip-link and transduction appearance relative to stages depicted in panels D–F. (D–F) Stage-dependent processes. (D) EPS8 is present at all stages of stereocilia growth. In stage II, EPS8 is present at all tips in approximate proportion to stereocilia length. In stages III and IV, EPS8 levels drop at row 2 tips while they remain constant at row 1 tips. (E) If transduction proteins are present in the hair bundle, GPSM2 levels rise during stage IV, presumably leading to activation of EPS8 and actin-filament elongation. (F) At row 2, the actin-depolymerizing proteins DSTN and CFL1 (and their partner WDR1) are found diffusely in stereocilia. During stage III, transduction leads to localization of DSTN and CFL1 at row 2 tips, triggering actin-filament turnover and shrinkage of row 2. CAPZB and TWF2 are localized separately during this stage, but in stage IV, both are found together at row 2 tips if transduction is active. IHC, inner hair cell.

References

    1. Tilney LG, Tilney MS, DeRosier DJ. Actin filaments, stereocilia, and hair cells: how cells count and measure. Annu Rev Cell Biol. 1992;8:257–274. doi: 10.1146/annurev.cb.08.110192.001353 - DOI - PubMed
    1. Qiu X, Müller U. Sensing sound: Cellular specializations and molecular force sensors. Neuron. 2022;110(22):3667–3687. doi: 10.1016/j.neuron.2022.09.018 - DOI - PMC - PubMed
    1. Shotwell SL, Jacobs R, Hudspeth AJ. Directional sensitivity of individual vertebrate hair cells to controlled deflection of their hair bundles. Ann N Y Acad Sci. 1981;374:1–10. doi: 10.1111/j.1749-6632.1981.tb30854.x - DOI - PubMed
    1. Hudspeth AJ. Hair-bundle mechanics and a model for mechanoelectrical transduction by hair cells. Soc Gen Physiol Ser. 1992;47:357–370. - PubMed
    1. Fettiplace R. Hair cell transduction, tuning, and synaptic transmission in the mammalian cochlea. Compr Physiol. 2017;7:1197–1227. doi: 10.1002/cphy.c160049 - DOI - PMC - PubMed

Publication types