. 2023 Apr 11;120(15):e2220333120.
doi: 10.1073/pnas.2220333120. Epub 2023 Apr 3.

Hot carrier extraction from 2D semiconductor photoelectrodes

Affiliations

Hot carrier extraction from 2D semiconductor photoelectrodes

Rachelle Austin et al. Proc Natl Acad Sci U S A. .

Abstract

Hot carrier-based energy conversion systems could double the efficiency of conventional solar energy technology or drive photochemical reactions that would not be possible using fully thermalized, "cool" carriers, but current strategies require expensive multijunction architectures. Using an unprecedented combination of photoelectrochemical and in situ transient absorption spectroscopy measurements, we demonstrate ultrafast (<50 fs) hot exciton and free carrier extraction under applied bias in a proof-of-concept photoelectrochemical solar cell made from earth-abundant and potentially inexpensive monolayer (ML) MoS2. Our approach facilitates ultrathin 7 Å charge transport distances over 1 cm2 areas by intimately coupling ML-MoS2 to an electron-selective solid contact and a hole-selective electrolyte contact. Our theoretical investigations of the spatial distribution of exciton states suggest greater electronic coupling between hot exciton states located on peripheral S atoms and neighboring contacts likely facilitates ultrafast charge transfer. Our work delineates future two-dimensional (2D) semiconductor design strategies for practical implementation in ultrathin photovoltaic and solar fuel applications.

Keywords: 2D materials; hot carrier; photoelectrochemistry; solar energy conversion; transient absorption spectroscopy.


Conflict of interest statement

The authors declare no competing interest.

Figures
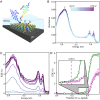
Fig. 1.
Fig. 1.
Optoelectronic properties of the monolayer MoS2 photoelectrochemical cell. (A) Cartoon illustration of the three-electrode photoelectrochemical cell. The solid blue and rainbow arrows indicate pump and probe pulses for TA measurements. Pt counter and Ag/AgI reference electrodes are omitted for clarity. (B) Absorbance spectra in 0.025 V increments from 0.0 V to 0.55 V. (C) EQE spectra vs. applied potential from 0.35 V to 0.55 V. EQE(λ) = qi/I0(λ), where q is the electronic charge (in units of C), i is the photocurrent (in units of A), and I0 is the monochromatic light power (in units of s–1). (D) Monochromatic i-E measurements for resonant A-, B-, and C-exciton excitation (i.e., 650 nm, 605 nm, and 432 nm, respectively).
Fig. 2.
Fig. 2.
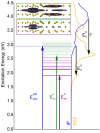
(Center) Eigen spectrum of unsupported ML-MoS2 in vacuum calculated from BSE. The purple and green lines represent the A-exciton hydrogenic series around the K point and the C-exciton states in the band nesting region between K and Γ , respectively. The transparency of each energy level is set to the oscillator strength of the transition, normalized by the A-1s transition (labeled EexA), which is the strongest. EexC is the energy of the first C-exciton state. The dotted blue line represents the fundamental electronic band gap at 2.9 eV, which is at the K point. C-excitons and free carriers at this energy (co)exist in different regions of k-space. (Top) The hole-averaged isosurface plots for the electron density in the aforementioned A-exciton (below, purple box) and C-exciton (above, green box) states. (Right) The absorption spectra as calculated for the BSE states pictured (orange) and the underlying single-particle states (blue). The energy difference between peaks represents the A- and C-exciton binding energies ( EbA and EbC).
Fig. 3.
Fig. 3.
Transient absorption of monolayer MoS2 photoelectrochemical cell. (A) Potential-dependent TA spectra at τ = 1 ps. (B) Temporal trace of the A-exciton (purple) and C-exciton (green) bleach intensity for 0.0 V (filled circles) and 0.5 V (filled diamonds). Solid and dashed lines are fits to SI Appendix, Eqs. S1 and S2. The ΔA values were determined using a Gaussian peak-fitting procedure to obtain the maximum bleach signal regardless of peak shifts induced by unavoidable BGR effects. (C and D) Steady-state absorbance (squares) and TA bleach intensity at τ = 1 ps (circles) for the (C) A- and (D) C-excitons.
Scheme 1.
Scheme 1.
Hot-carrier extraction process in the ML-MoS2 photoelectrochemical cell.

References

    1. Nozik A. J., Spectroscopy and hot electron relaxation dynamics in semiconductor quantum wells and quantum dots. Annu. Rev. Phys. Chem. 52, 193–231 (2001). - PubMed
    1. Shockley W., Queisser H. J., Detailed balance limit of efficiency of p-n junction solar cells. J. Appl. Phys. 32, 510–519 (1961).
    1. Nozik A. J., Utilizing hot electrons. Nat. Energy 3, 170–171 (2018).
    1. Cooper G., Turner J. A., Parkinson B. A., Nozik A. J., Hot carrier injection of photogenerated electrons at indium phosphide-electrolyte interfaces. J. Appl. Phys. 54, 6463–6473 (1983).
    1. Nguyen D. T., et al. , Quantitative experimental assessment of hot carrier-enhanced solar cells at room temperature. Nat. Energy 3, 236–242 (2018).

LinkOut - more resources